Santa Clarita, CA
Demographics And Statistics
Living In Santa Clarita, California Summary
Life in Santa Clarita research summary. HomeSnacks has been using Saturday Night Science to research the quality of life in Santa Clarita over the past nine years using Census, FBI, Zillow, and other primary data sources. Based on the most recently available data, we found the following about life in Santa Clarita:
The population in Santa Clarita is 229,021.
The median home value in Santa Clarita is $792,509.
The median income in Santa Clarita is $119,926.
The cost of living in Santa Clarita is 164 which is 1.6x higher than the national average.
The median rent in Santa Clarita is $2,486.
The unemployment rate in Santa Clarita is 5.3%.
The poverty rate in Santa Clarita is 7.7%.
The average high in Santa Clarita is 75.3° and the average low is 54.1°.
Santa Clarita SnackAbility
Overall SnackAbility
Santa Clarita, CA Crime Report
Crime in Santa Clarita summary. We use data from the FBI to determine the crime rates in Santa Clarita. Key points include:
There were 2,970 total crimes in Santa Clarita in the last reporting year.
The overall crime rate per 100,000 people in Santa Clarita is 1,342.1 / 100k people.
The violent crime rate per 100,000 people in Santa Clarita is 165.4 / 100k people.
The property crime rate per 100,000 people in Santa Clarita is 1,176.7 / 100k people.
Overall, crime in Santa Clarita is -36.67% below the national average.
Total Crimes
Below National Average
Crime In Santa Clarita Comparison Table
| Statistic | Count Raw |
Santa Clarita / 100k People |
California / 100k People |
National / 100k People |
|---|---|---|---|---|
| Total Crimes Per 100K | 2,970 | 1,342.1 | 2,564.5 | 2,119.2 |
| Violent Crime | 366 | 165.4 | 486.0 | 359.0 |
| Murder | 2 | 0.9 | 4.5 | 5.0 |
| Robbery | 94 | 42.5 | 119.1 | 61.0 |
| Aggravated Assault | 242 | 109.4 | 325.8 | 256.0 |
| Property Crime | 2,604 | 1,176.7 | 2,078.4 | 1,760.0 |
| Burglary | 433 | 195.7 | 305.8 | 229.0 |
| Larceny | 1,731 | 782.2 | 1,345.2 | 1,272.0 |
| Car Theft | 440 | 198.8 | 427.5 | 259.0 |
Santa Clarita, CA Cost Of Living
Cost of living in Santa Clarita summary. We use data on the cost of living to determine how expensive it is to live in Santa Clarita. Real estate prices drive most of the variance in cost of living around California. Key points include:
The cost of living in Santa Clarita is 164 with 100 being average.
The cost of living in Santa Clarita is 1.6x higher than the national average.
The median home value in Santa Clarita is $792,509.
The median income in Santa Clarita is $119,926.
Santa Clarita's Overall Cost Of Living
Higher Than The National Average
Cost Of Living In Santa Clarita Comparison Table
| Living Expense | Santa Clarita | California | National Average | |
|---|---|---|---|---|
| Overall | 164 | 141 | 100 | |
| Services | 115 | 110 | 100 | |
| Groceries | 113 | 112 | 100 | |
| Health | 108 | 110 | 100 | |
| Housing | 277 | 195 | 100 | |
| Transportation | 125 | 125 | 100 | |
| Utilities | 113 | 128 | 100 | |
Santa Clarita, CA Weather
The average high in Santa Clarita is 75.3° and the average low is 54.1°.
There are 22.7 days of precipitation each year.
Expect an average of 16.2 inches of precipitation each year with 0.2 inches of snow.
| Stat | Santa Clarita |
|---|---|
| Average Annual High | 75.3 |
| Average Annual Low | 54.1 |
| Annual Precipitation Days | 22.7 |
| Average Annual Precipitation | 16.2 |
| Average Annual Snowfall | 0.2 |
Average High
Days of Rain
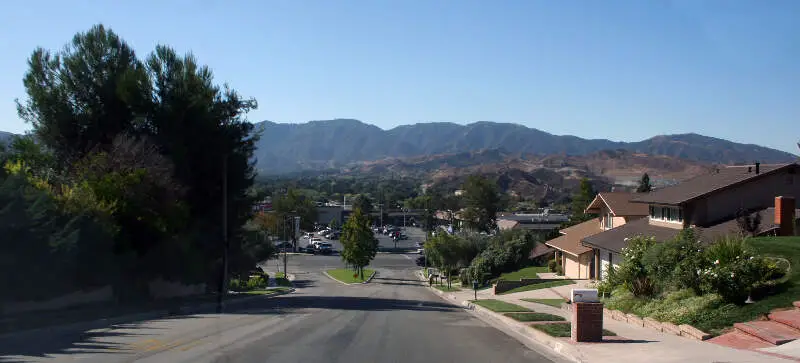
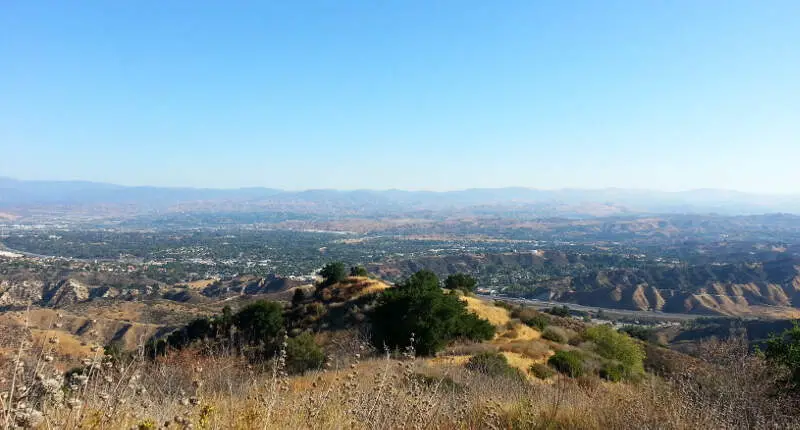
Santa Clarita, CA Photos
1 Reviews & Comments About Santa Clarita
/5

HomeSnacks User - 2018-08-03 01:32:39.017337
Overall, Santa Clarita from a younger individual's perspective is very bland. The city simply lacks of things to do.
What stood out the most about Santa Clarita is how I felt secured in this city. Also the family appears to be more about raising a family.
Rankings for Santa Clarita in California


Locations Around Santa Clarita
Map Of Santa Clarita, CA
Best Places Around Santa Clarita
San Fernando, CA
Population 23,716
La Crescenta-Montrose, CA
Population 19,940
Castaic, CA
Population 18,479
Simi Valley, CA
Population 125,769
Burbank, CA
Population 5,552
Stevenson Ranch, CA
Population 21,317
Acton, CA
Population 7,721
Santa Clarita Demographics And Statistics
Population over time in Santa Clarita
The current population in Santa Clarita is 229,021. The population has increased 33.0% from 2010.
| Year | Population | % Change |
|---|---|---|
| 2023 | 229,021 | 1.4% |
| 2022 | 225,850 | -0.6% |
| 2021 | 227,182 | 6.9% |
| 2020 | 212,519 | -0.4% |
| 2019 | 213,411 | 1.9% |
| 2018 | 209,478 | -0.0% |
| 2017 | 209,489 | 16.2% |
| 2016 | 180,303 | 0.2% |
| 2015 | 179,950 | 0.5% |
| 2014 | 179,030 | 0.9% |
| 2013 | 177,366 | 0.8% |
| 2012 | 175,922 | 1.1% |
| 2011 | 173,993 | 1.0% |
| 2010 | 172,253 | - |
Race / Ethnicity in Santa Clarita
Santa Clarita is:
43.3% White with 99,090 White residents.
4.2% African American with 9,614 African American residents.
0.1% American Indian with 201 American Indian residents.
11.1% Asian with 25,524 Asian residents.
0.4% Hawaiian with 875 Hawaiian residents.
0.6% Other with 1,406 Other residents.
4.3% Two Or More with 9,768 Two Or More residents.
36.0% Hispanic with 82,543 Hispanic residents.
| Race | Santa Clarita | CA | USA |
|---|---|---|---|
| White | 43.3% | 34.6% | 58.2% |
| African American | 4.2% | 5.3% | 12.0% |
| American Indian | 0.1% | 0.3% | 0.5% |
| Asian | 11.1% | 15.1% | 5.7% |
| Hawaiian | 0.4% | 0.3% | 0.2% |
| Other | 0.6% | 0.5% | 0.5% |
| Two Or More | 4.3% | 4.1% | 3.9% |
| Hispanic | 36.0% | 39.8% | 19.0% |
Gender in Santa Clarita
Santa Clarita is 50.5% female with 115,548 female residents.
Santa Clarita is 49.5% male with 113,472 male residents.
| Gender | Santa Clarita | CA | USA |
|---|---|---|---|
| Female | 50.5% | 50.0% | 50.5% |
| Male | 49.5% | 50.0% | 49.5% |
Highest level of educational attainment in Santa Clarita for adults over 25
5.0% of adults in Santa Clarita completed < 9th grade.
4.0% of adults in Santa Clarita completed 9-12th grade.
19.0% of adults in Santa Clarita completed high school / ged.
23.0% of adults in Santa Clarita completed some college.
10.0% of adults in Santa Clarita completed associate's degree.
26.0% of adults in Santa Clarita completed bachelor's degree.
9.0% of adults in Santa Clarita completed master's degree.
2.0% of adults in Santa Clarita completed professional degree.
2.0% of adults in Santa Clarita completed doctorate degree.
| Education | Santa Clarita | CA | USA |
|---|---|---|---|
| < 9th Grade | 5.0% | 8.0% | 5.0% |
| 9-12th Grade | 4.0% | 7.0% | 6.0% |
| High School / GED | 19.0% | 20.0% | 26.0% |
| Some College | 23.0% | 20.0% | 19.0% |
| Associate's Degree | 10.0% | 8.0% | 9.0% |
| Bachelor's Degree | 26.0% | 22.0% | 21.0% |
| Master's Degree | 9.0% | 10.0% | 10.0% |
| Professional Degree | 2.0% | 3.0% | 2.0% |
| Doctorate Degree | 2.0% | 2.0% | 2.0% |
Household Income For Santa Clarita, California
3.0% of households in Santa Clarita earn Less than $10,000.
1.2% of households in Santa Clarita earn $10,000 to $14,999.
3.2% of households in Santa Clarita earn $15,000 to $24,999.
4.9% of households in Santa Clarita earn $25,000 to $34,999.
6.7% of households in Santa Clarita earn $35,000 to $49,999.
10.7% of households in Santa Clarita earn $50,000 to $74,999.
10.7% of households in Santa Clarita earn $75,000 to $99,999.
21.0% of households in Santa Clarita earn $100,000 to $149,999.
14.2% of households in Santa Clarita earn $150,000 to $199,999.
24.4% of households in Santa Clarita earn $200,000 or more.
| Income | Santa Clarita | CA | USA |
|---|---|---|---|
| Less than $10,000 | 3.0% | 4.4% | 4.9% |
| $10,000 to $14,999 | 1.2% | 3.0% | 3.6% |
| $15,000 to $24,999 | 3.2% | 5.2% | 6.6% |
| $25,000 to $34,999 | 4.9% | 5.5% | 6.8% |
| $35,000 to $49,999 | 6.7% | 8.4% | 10.4% |
| $50,000 to $74,999 | 10.7% | 13.3% | 15.7% |
| $75,000 to $99,999 | 10.7% | 11.8% | 12.7% |
| $100,000 to $149,999 | 21.0% | 17.9% | 17.4% |
| $150,000 to $199,999 | 14.2% | 11.1% | 9.3% |
| $200,000 or more | 24.4% | 19.4% | 12.6% |


