Everyone wants a bit of a blissful breeze or a scoop of sunny sanctuary when looking for a place to live in Nevada.
The more sun, the more you can go outside. The more you go outside, the more you’ll feel at peace. The more you’ll feel at peace, the more you’ll enjoy where you live.
So it makes sense to try and find the places with the best weather in Nevada. We used Saturday Night Science to compare the number of sunny days, total precipitation, and the deviation from the ideal 70-degree weather for 21 places in Nevada over 11,000 people.
Grab your shades and put away your raincoat as we look at the cities with the best weather in Nevada.
Table Of Contents: Top Ten | Methodology | Table
The 10 Cities With The Best Weather In Nevada For 2026

What city has the best weather in Nevada, with more than 11,000 people? The city with the best weather in Nevada is North Las Vegas with 0.1 sunny days and an average high of 80.8 degrees.
Read on below to see where your city ranked.
And if you already knew these places were beautiful, check out the best places to live in Nevada or the cheapest places in Nevada.
The 10 Snowiest Cities In Nevada For 2026


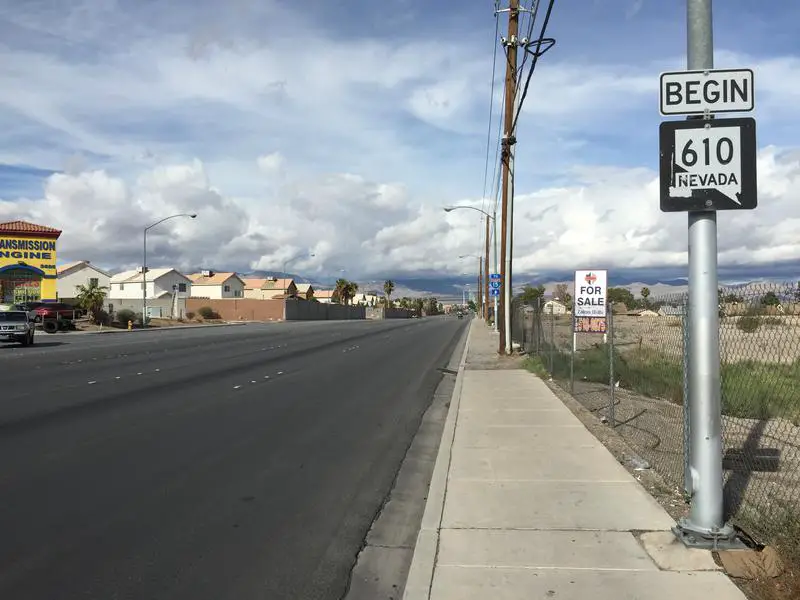
Population: 226,860
Average Annual High: 80.8 degrees
Average Annual Low: 54.0 degrees
Average Annual Snowfall: 0.1 inches
Average Annual Precipitation: 4.5 inches
Sunny Days: 353.4 days
More on North Las Vegas: Data | Crime | Cost Of Living | Movers


Population: 28,365
Average Annual High: 81.0 degrees
Average Annual Low: 54.7 degrees
Average Annual Snowfall: 0.2 inches
Average Annual Precipitation: 4.5 inches
Sunny Days: 353.8 days
More on Winchester: Data | Cost Of Living | Movers

Population: 191,464
Average Annual High: 82.0 degrees
Average Annual Low: 54.8 degrees
Average Annual Snowfall: 0.2 inches
Average Annual Precipitation: 4.5 inches
Sunny Days: 353.4 days
More on Sunrise Manor: Data | Cost Of Living | Movers

Population: 40,165
Average Annual High: 82.5 degrees
Average Annual Low: 55.5 degrees
Average Annual Snowfall: 0.2 inches
Average Annual Precipitation: 4.8 inches
Sunny Days: 353.8 days
More on Whitney: Data | Cost Of Living | Movers

Population: 15,266
Average Annual High: 79.1 degrees
Average Annual Low: 57.7 degrees
Average Annual Snowfall: 0.0 inches
Average Annual Precipitation: 5.2 inches
Sunny Days: 350.6 days
More on Boulder City: Data | Crime | Cost Of Living | Movers


Population: 271,725
Average Annual High: 80.4 degrees
Average Annual Low: 55.3 degrees
Average Annual Snowfall: 0.2 inches
Average Annual Precipitation: 5.0 inches
Sunny Days: 352.5 days
More on Henderson: Data | Crime | Cost Of Living | Movers

Population: 226,957
Average Annual High: 80.9 degrees
Average Annual Low: 54.9 degrees
Average Annual Snowfall: 0.3 inches
Average Annual Precipitation: 4.7 inches
Sunny Days: 353.2 days
More on Paradise: Data | Cost Of Living | Movers


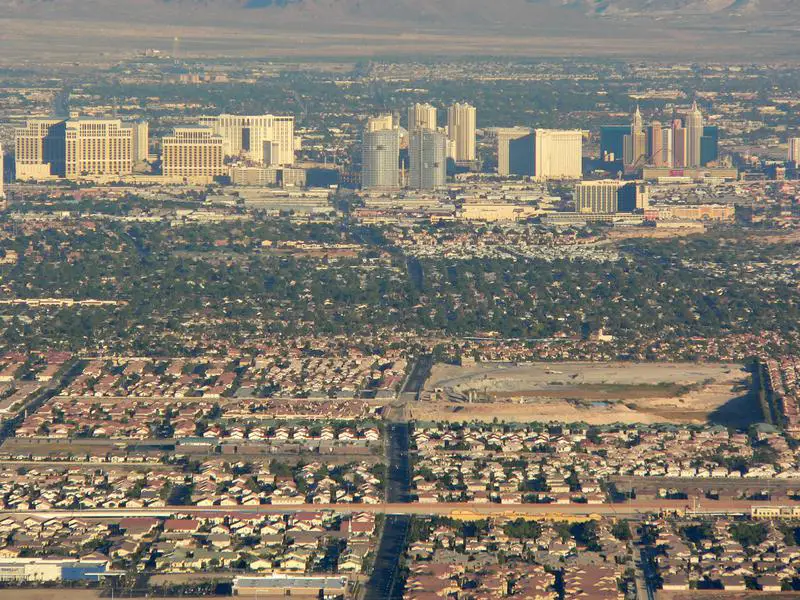
Population: 605,097
Average Annual High: 79.3 degrees
Average Annual Low: 53.5 degrees
Average Annual Snowfall: 0.4 inches
Average Annual Precipitation: 4.8 inches
Sunny Days: 352.2 days
More on Las Vegas: Data | Cost Of Living | Movers

Population: 186,632
Average Annual High: 79.2 degrees
Average Annual Low: 53.7 degrees
Average Annual Snowfall: 0.7 inches
Average Annual Precipitation: 5.2 inches
Sunny Days: 352.4 days
More on Spring Valley: Data | Cost Of Living | Movers


Population: 34,902
Average Annual High: 79.0 degrees
Average Annual Low: 48.3 degrees
Average Annual Snowfall: 0.5 inches
Average Annual Precipitation: 4.8 inches
Sunny Days: 351.5 days
More on Pahrump: Data | Cost Of Living | Movers
How We Determined The Cities In Nevada With The Best Weather
To rank the most fair weather cities in Nevada, we used Saturday Night Science and the National Oceanic and Atmospheric Administration (NOAA) database, to see which cities in the Silver State get the best weather.
We used the following criteria to find the best weather:
- Number of sunny days
- Highest average low
- Average high deviation from 70 degrees
- Least amount of rain
- Least amount of snow
We ranked each city of over 11,000 people in Nevada from best to worst on each criterion. We then averaged each ranking into a weather quality index. The city with the best index, North Las Vegas, was anointed the city with the best weather in Nevada.
Before we get too far, here are the annual precipitation rates for major cities:
- Las Vegas — 4.8 inches
- Henderson — 5.0 inches
- Reno — 10.1 inches
The cities with the best weather in Nevada are North Las Vegas, Winchester, Sunrise Manor, Whitney, Boulder City, Henderson, Paradise, Las Vegas, Spring Valley, and Pahrump.
There’s a complete chart at the bottom.
If you’re curious, here are the places with the worst weather in Nevada:
- Spring Creek
- Elko
- Gardnerville Ranchos
For more Nevada reading, check out:
Detailed List Of Places With The Best Weather In Nevada
| Rank | City | Population | Sunny Days | Avg. High | Precipitation (Inches) | Snow (Inches) |
|---|---|---|---|---|---|---|
| 1 | North Las Vegas | 226,860 | 353.4 | 80.8 | 4.5 | 0.1 |
| 2 | Winchester | 28,365 | 353.8 | 81.0 | 4.5 | 0.2 |
| 3 | Sunrise Manor | 191,464 | 353.4 | 82.0 | 4.5 | 0.2 |
| 4 | Whitney | 40,165 | 353.8 | 82.5 | 4.8 | 0.2 |
| 5 | Boulder City | 15,266 | 350.6 | 79.1 | 5.2 | 0.0 |
| 6 | Henderson | 271,725 | 352.5 | 80.4 | 5.0 | 0.2 |
| 7 | Paradise | 226,957 | 353.2 | 80.9 | 4.7 | 0.3 |
| 8 | Las Vegas | 605,097 | 352.2 | 79.3 | 4.8 | 0.4 |
| 9 | Spring Valley | 186,632 | 352.4 | 79.2 | 5.2 | 0.7 |
| 10 | Pahrump | 34,902 | 351.5 | 79.0 | 4.8 | 0.5 |
| 11 | Fernley | 19,185 | 348.3 | 67.9 | 5.2 | 20.8 |
| 12 | Enterprise | 125,498 | 350.5 | 78.2 | 5.9 | 0.8 |
| 13 | Summerlin South | 25,338 | 342.8 | 77.5 | 5.8 | 1.3 |
| 14 | Sparks | 93,437 | 342.3 | 67.0 | 8.4 | 15.0 |
| 15 | Mesquite | 16,533 | 349.5 | 83.2 | 6.5 | 0.8 |
| 16 | Spanish Springs | 15,789 | 342.3 | 66.5 | 8.5 | 18.5 |
| 17 | Sun Valley | 19,663 | 342.5 | 65.9 | 9.1 | 21.6 |
| 18 | Reno | 234,161 | 342.9 | 66.0 | 10.1 | 22.3 |
| 19 | Gardnerville Ranchos | 11,023 | 343.2 | 66.8 | 10.4 | 27.6 |
| 20 | Elko | 19,709 | 333.0 | 62.0 | 10.0 | 44.1 |
| 21 | Spring Creek | 13,564 | 325.6 | 61.1 | 10.9 | 53.1 |


