Everyone wants a bit of a blissful breeze or a scoop of sunny sanctuary when looking for a place to live in New Mexico.
The more sun, the more you can go outside. The more you go outside, the more you’ll feel at peace. The more you’ll feel at peace, the more you’ll enjoy where you live.
So it makes sense to try and find the places with the best weather in New Mexico. We used Saturday Night Science to compare the number of sunny days, total precipitation, and the deviation from the ideal 70-degree weather for 23 places in New Mexico over 10,000 people.
Grab your shades and put away your raincoat as we look at the cities with the best weather in New Mexico.
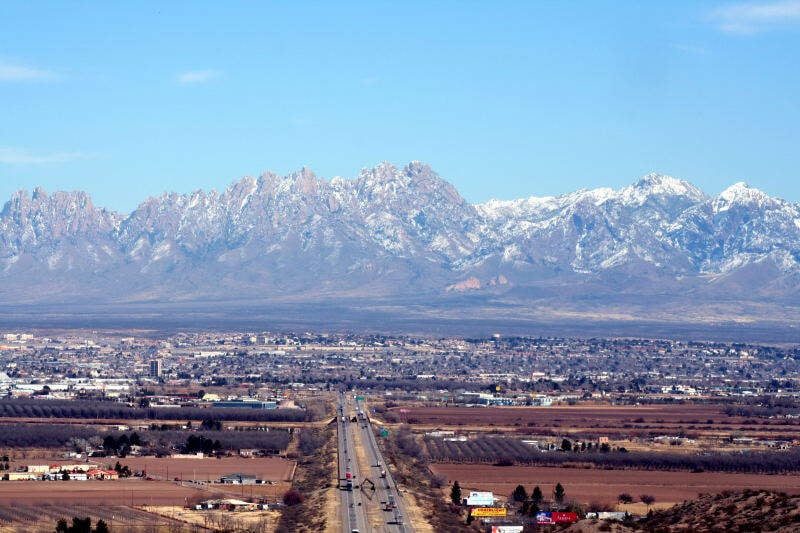
340.4 sunny days · 76.9 degree average high
Las Cruces, also known as “The City of the Crosses”, is the seat of Doa Ana County, New Mexico, United States. As of the 2010 census the population was 97,618, and in 2015 the estimated population was 101,643, making it the second largest city in the state, after Albuquerque. Las Cruces is the largest city in both Doa Ana County and southern New Mexico. The Las Cruces metropolitan area had an estimated population of 213,676 in 2014. It is the principal city of a metropolitan statistical area which encompasses all of Doa Ana County and is part of the larger El Paso-Las Cruces combined statistical area.
Data | Crime | Cost of living | Movers
340.9 sunny days · 77.7 degree average high

345.2 sunny days · 78.7 degree average high
Sunland Park is a city in southern Doa Ana County, New Mexico, United States, on the borders of Texas and the Mexican state of Chihuahua, with Ciudad Jurez adjoining it on the south and El Paso, Texas on the east. The community of Santa Teresa adjoins it on the northwest. The population of Sunland Park was 14,106 at the 2010 census and was estimated at 15,400 by the United States Census Bureau in 2014. Though it lies adjacent to El Paso, being in Doa Ana County makes it a part of the Las Cruces metropolitan statistical area. Las Cruces is 42 miles to the north.
Data | Crime | Cost of living | Movers
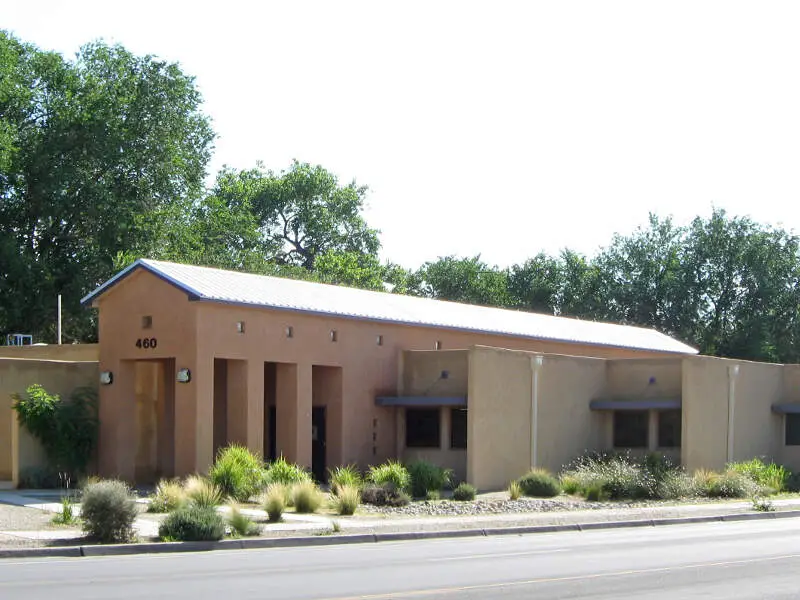
338.7 sunny days · 73.5 degree average high
Los Lunas is a village in Valencia County, New Mexico, in the United States. As of the 2010 census, the village population is 14,835 inside the village limits due to the new housing developments at El Cerro de Los Lunas. It is the county seat of Valencia County.
Data | Crime | Cost of living | Movers

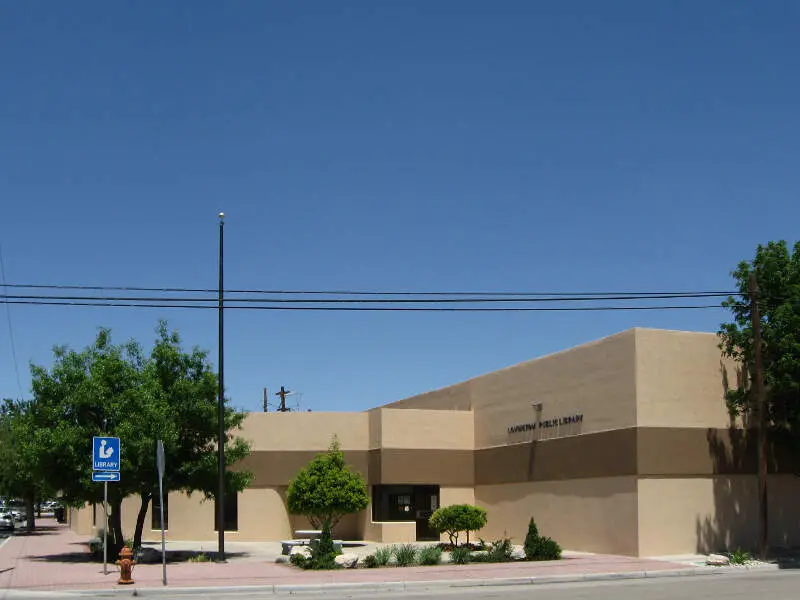
337.8 sunny days · 76.9 degree average high
Deming is a city in Luna County, New Mexico, United States, located 60 miles west of Las Cruces and thirty-three miles north of the Mexican border. The population was 14,855 according to the 2010 census. Deming is the county seat and principal community of Luna County.
Data | Crime | Cost of living | Movers
338.1 sunny days · 72.1 degree average high

337.4 sunny days · 69.7 degree average high
Rio Rancho is the largest city and economic hub of Sandoval County in the U.S. state of New Mexico. A small portion of the city extends into northern Bernalillo County. It is the third-largest and also one of the fastest expanding cities in New Mexico. As of the 2010 census, Rio Rancho had a population of 93,820.
Data | Crime | Cost of living | Movers

338.3 sunny days · 78.5 degree average high
Carlsbad is a city in and the county seat of Eddy County, New Mexico, United States. As of the 2010 census, the city population was 26,138. Carlsbad is centered at the intersection of U.S. Routes 62/180 and 285, and is the principal city of the Carlsbad-Artesia Micropolitan Statistical Area, which has a total population of 55,435. Located in the southeastern part of New Mexico, Carlsbad straddles the Pecos River and sits at the eastern edge of the Guadalupe Mountains.
Data | Crime | Cost of living | Movers
336.0 sunny days · 74.8 degree average high
Data | Crime | Cost of living | Movers
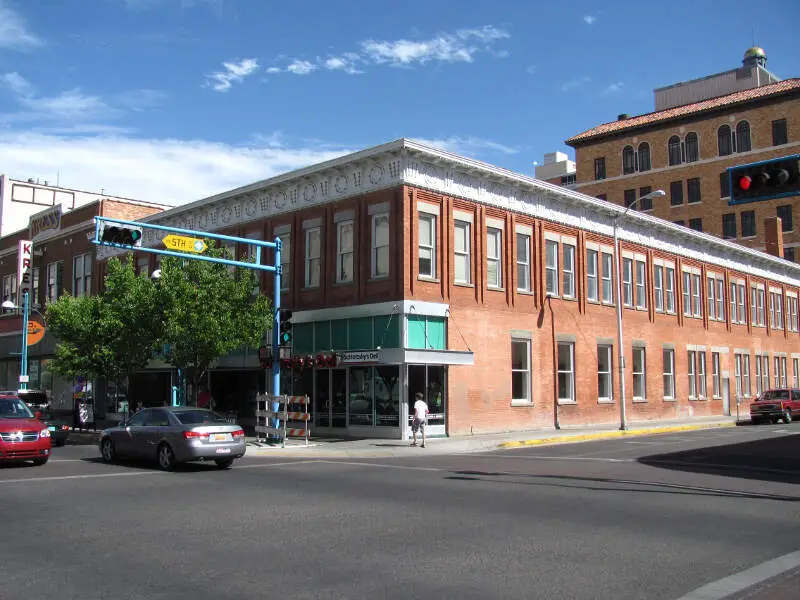
335.2 sunny days · 70.4 degree average high
Albuquerque AL-b-kur-kee; Navajo: Beeeldl Dahsinil ) is the most populous city in the U.S. state of New Mexico. The high-elevation city serves as the county seat of Bernalillo County, and it is situated in the north central part of the state, straddling the Rio Grande. The city population is 559,277 as of the July 1, 2016 population estimate from the United States Census Bureau, and ranks as the 32nd-largest city in the U.S. The Albuquerque metropolitan statistical area has a population of 909,906 according to the United States Census Bureau’s most recently available estimate for 2016. Albuquerque is the 60th-largest United States metropolitan area. The Albuquerque MSA population includes the city of Rio Rancho, Bernalillo, Placitas, Corrales, Los Lunas, Belen, Bosque Farms, and forms part of the larger Albuquerque-Santa Fe-Las Vegas combined statistical area, with a total population of 1,171,991 as of the July 1, 2016, Census Bureau estimates.
Data | Crime | Cost of living | Movers
The receipts
Compare the top ten
Pick a metric. The bars rescale. The red line is New Mexico’s statewide median.
On the map
Where New Mexico’s best weather is
Saturday Night Science
How We Determined The Cities In New Mexico With The Best Weather
To rank the most fair weather cities in New Mexico, we used Saturday Night Science and the National Oceanic and Atmospheric Administration (NOAA) database, to see which cities in the Land of Enchantment get the best weather.
We used the following criteria to find the best weather:
- Number of sunny days
- Highest average low
- Average high deviation from 70 degrees
- Least amount of rain
- Least amount of snow
We ranked each city of over 10,000 people in New Mexico from best to worst on each criterion. We then averaged each ranking into a weather quality index. The city with the best index, Las Cruces, was anointed the city with the best weather in New Mexico.
Before we get too far, here are the annual precipitation rates for major cities: Albuquerque (10.7 inches), Las Cruces (10.6 inches), and Rio Rancho (11.0 inches).
The cities with the best weather in New Mexico are Las Cruces, Chaparral, Sunland Park, Los Lunas, Deming, South Valley, Rio Rancho, Carlsbad, Lovington, and Albuquerque.
There’s a complete chart at the bottom.
The full plate
Detailed List Of Places With The Best Weather In New Mexico
Click any column to sort. Search by city name.
| Rank | City | Population | Sunny Days | Avg. High | Precipitation (Inches) | Snow (Inches) |
|---|---|---|---|---|---|---|
| 1 | Las Cruces | 101,164 | 340.4 | 76.9 | 10.6 | 2.6 |
| 2 | Chaparral | 13,629 | 340.9 | 77.7 | 9.0 | 5.5 |
| 3 | Sunland Park | 15,142 | 345.2 | 78.7 | 9.9 | 5.2 |
| 4 | Los Lunas | 15,281 | 338.7 | 73.5 | 8.8 | 6.6 |
| 5 | Deming | 14,667 | 337.8 | 76.9 | 10.7 | 2.1 |
| 6 | South Valley | 41,660 | 338.1 | 72.1 | 9.6 | 8.9 |
| 7 | Rio Rancho | 91,807 | 337.4 | 69.7 | 11.0 | 11.3 |
| 8 | Carlsbad | 27,592 | 338.3 | 78.5 | 13.8 | 5.3 |
| 9 | Lovington | 11,499 | 336.0 | 74.8 | 16.1 | 3.3 |
| 10 | Albuquerque | 556,092 | 335.2 | 70.4 | 10.7 | 13.4 |
| 11 | Hobbs | 36,191 | 334.7 | 75.7 | 15.3 | 3.8 |
| 12 | Alamogordo | 31,198 | 333.9 | 75.4 | 12.4 | 5.7 |
| 13 | Farmington | 44,865 | 335.1 | 67.6 | 9.4 | 12.8 |
| 14 | Artesia | 11,641 | 337.0 | 77.1 | 12.6 | 6.9 |
| 15 | Roswell | 48,553 | 338.1 | 76.1 | 13.1 | 9.6 |
| 16 | North Valley | 11,221 | 333.0 | 69.7 | 11.7 | 17.0 |
| 17 | Silver City | 10,184 | 323.8 | 70.3 | 19.4 | 4.7 |
| 18 | Portales | 12,416 | 330.1 | 73.4 | 17.0 | 7.7 |
| 19 | Clovis | 39,466 | 325.6 | 71.6 | 18.2 | 12.9 |
| 20 | Gallup | 22,467 | 330.4 | 65.5 | 12.4 | 33.0 |
| 21 | Santa Fe | 83,008 | 326.7 | 64.4 | 14.2 | 27.8 |
| 22 | Las Vegas | 13,713 | 322.8 | 65.8 | 17.6 | 26.2 |
| 23 | Los Alamos | 11,815 | 316.2 | 63.2 | 19.0 | 42.5 |
Source: NOAA climate data. 23 New Mexico cities with more than 10,000 residents.
Summary
Summary: The Cities With The Best Weather In New Mexico For 2026
If you’re looking for the New Mexico cities with the most sunny days, the least rain and snow, and highs closest to a perfect 70 degrees, this is an accurate list.
The cities with the best weather in New Mexico are Las Cruces, Chaparral, Sunland Park, Los Lunas, Deming, South Valley, Rio Rancho, Carlsbad, Lovington, and Albuquerque.


