Albuquerquevs.Denver Which City Is Right for You in 2026?
A head-to-head guide to cost of living, jobs, transportation, weather, crime, and quality of life — so you can decide where to live, work, or visit.
Updated 2026-05-26 · By HomeSnacks Editorial
Albuquerque vs. Denver at a glance
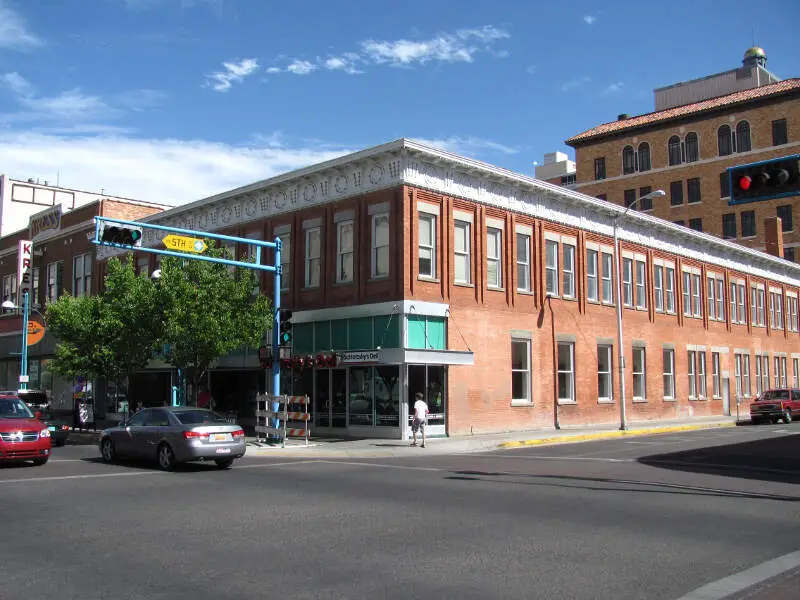
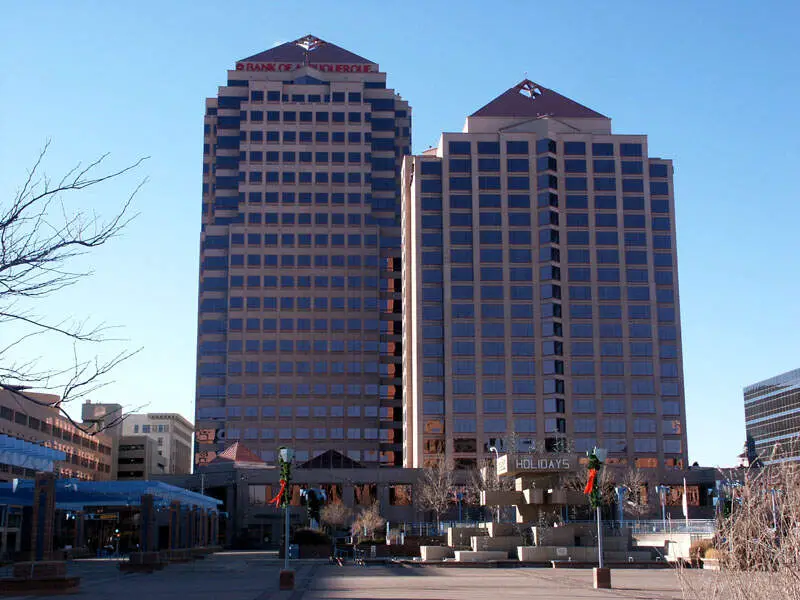
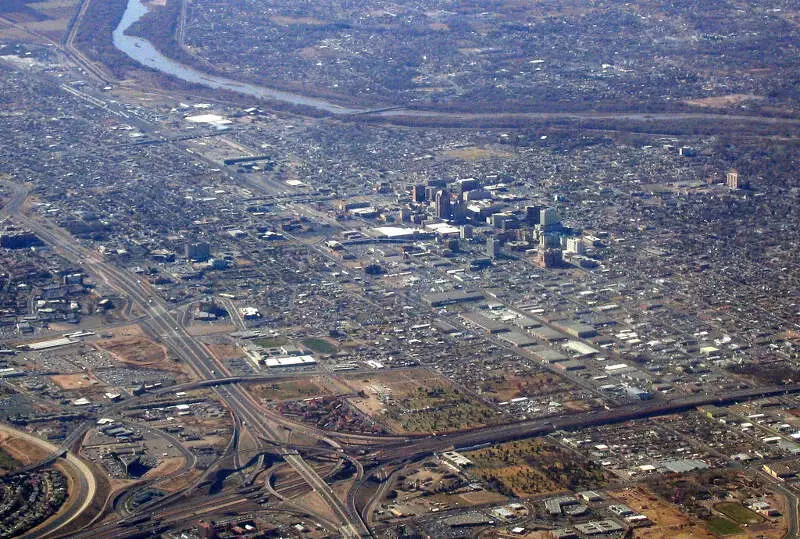
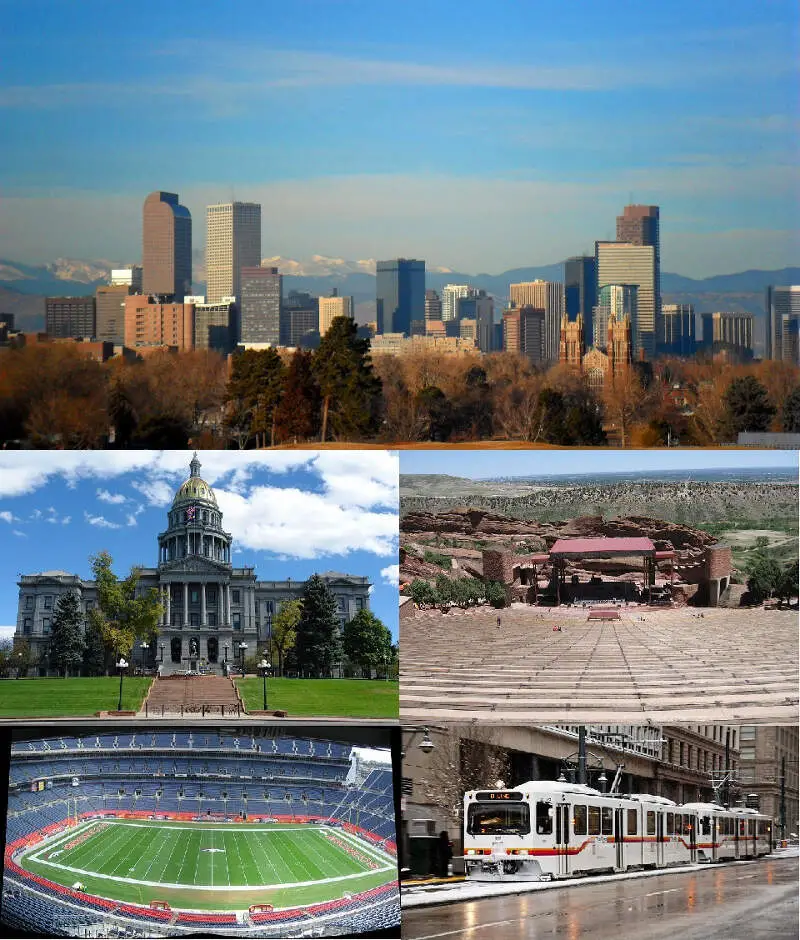
Albuquerque, NM and Denver, CO sit at very different points on the U.S. map — and the numbers reflect it. Albuquerque is the most populous city in the U.S. state of New Mexico. Denver is the capital and most populous city of the U.S. state of Colorado.
On cost of living, Albuquerque is the cheaper city: its overall index sits at 102 versus 142 in Denver (100 = national average). Median home values run $344,457 in Albuquerque and $539,666 in Denver, with median rents at $1,145 and $1,831 respectively. That puts the home-value-to-income ratio at 5.0x in Albuquerque versus 5.7x in Denver.
Crime data tells a different story. Denver reports 5,755 total crimes per 100,000 residents annually versus 5,811 in Albuquerque. Albuquerque is the more racially diverse of the two on a Herfindahl index basis — Albuquerque skews 48% Hispanic while Denver skews 54% White. On HomeSnacks' overall SnackAbility score, Denver edges ahead at 8/10 versus 6/10 for Albuquerque.
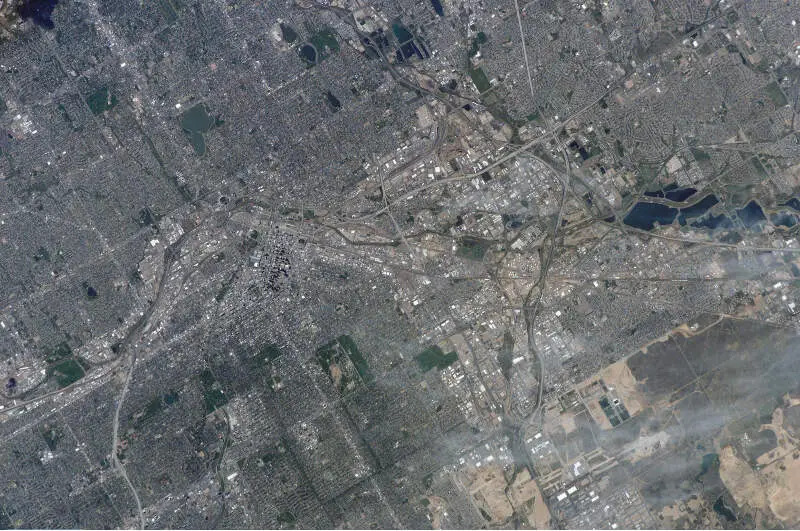
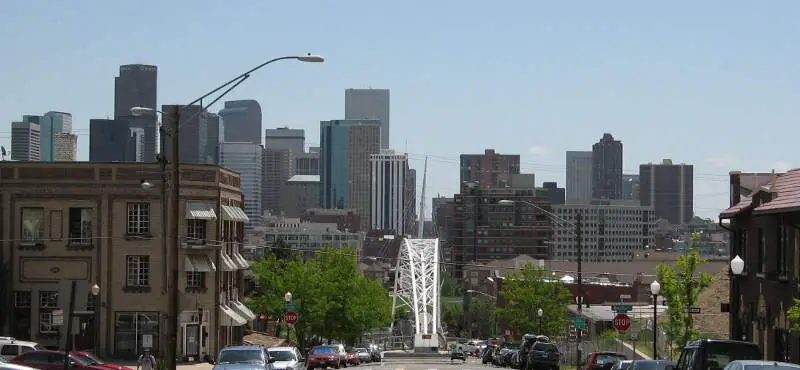
Albuquerque vs. Denver in photos
A side-by-side look at each city.
Cost of living
Albuquerque is the cheaper city overall — 28% higher in Denver than its rival. Index baseline: 100 = national average.
| Living expense | Albuquerque | Denver | US average |
|---|---|---|---|
| Overall | 102 | 142 | 100 |
| Services | 97 | 108 | 100 |
| Groceries | 97 | 107 | 100 |
| Health | 110 | 214 | 100 |
| Housing | 97 | 113 | 100 |
| Transportation | 94 | 110 | 100 |
| Utilities | 97 | 111 | 100 |
Lower index = cheaper. 100 = U.S. national average. Bar inside each cell scales relative to the highest value in the table.
Sources: HomeSnacks Cost of Living indices, normalized so 100 = U.S. national average. Drill in: Albuquerque cost of living, Denver cost of living, or the cheapest cities in America.
Housing breakdown
Home prices are higher in Denver. Compare absolute price and price-to-income — a $500k home in a $100k-income city is very different from one in a $50k-income city.
| Metric | Albuquerque | Denver | United States |
|---|---|---|---|
| Median Home Value | $344,457 | $539,666 | $332,700 |
| Median Rent | $1,145 | $1,831 | $1,413 |
| Median Income | $68,317 | $94,718 | $80,734 |
| Home Value To Income | 5.0x | 5.7x | 4.1x |
| Rent To Monthly Income | 0.2x | 0.23x | 0.21x |
Source: U.S. Census Bureau ACS 2020-2024. See also states with the highest rent in America.
Crime
Denver is the safer city — total crime rate of 5,755 per 100k people vs 5,811 for Albuquerque. US average: 2,119.
| Crime (per 100k) | Albuquerque | Denver | US average |
|---|---|---|---|
| Total crime | 5,811 | 5,755 | 2,119 |
| Murder | 18 | 10 | 5 |
| Robbery | 159 | 176 | 61 |
| Aggravated Assault | 942 | 713 | 256 |
| Violent Crime | 1,182 | 993 | 359 |
| Burglary | 772 | 708 | 229 |
| Larceny | 2,839 | 2,822 | 1,272 |
| Car Theft | 1,017 | 1,232 | 259 |
| Property Crime | 4,629 | 4,762 | 1,760 |
Lower = safer. Bar inside each cell scales relative to the highest crime rate in the table.
Source: FBI Uniform Crime Reporting (2024). All rates are per 100,000 people. City pages: Albuquerque crime, Denver crime. See also: safest cities in America.
Diversity
Albuquerque is more racially diverse — lower HHI (closer to 0) means a more even mix across groups.
| Group | Albuquerque | Denver | United States |
|---|---|---|---|
| White | 37.5% | 54.0% | 57.4% |
| African American | 2.9% | 8.6% | 11.9% |
| American Indian | 3.9% | 0.3% | 0.5% |
| Asian | 3.2% | 3.6% | 5.9% |
| Hawaiian | 0.1% | 0.1% | 0.2% |
| Other | 0.7% | 0.5% | 0.6% |
| Two Or More | 3.9% | 4.8% | 4.3% |
| Hispanic | 47.7% | 28.0% | 19.3% |
Source: U.S. Census ACS 2020-2024. Lower HHI = more even racial mix. See also: most diverse cities in America.
SnackAbility — overall quality of life
Denver scores higher overall — 8/10 vs 6/10. SnackAbility is our 1–10 quality-of-life score; the median U.S. city scores a 7.
SnackAbility is a HomeSnacks proprietary 1–10 score blending jobs, housing, education, commute, amenities, affordability, crime, and diversity. Median U.S. city ≈ 7. Data: Census, BLS, FBI. See also: best places to live in America.
Getting around: Albuquerque vs. Denver
How each city handles commuting, transit, walkability, and car culture — the day-to-day reality that shapes where you'd actually want to live.
Both cities are car-first metros, but Denver has more alternatives. RTD's light rail and commuter rail network connects Union Station to downtown and runs the A Line to Denver International Airport, so you can skip a car for a good number of daily trips. The 16th Street Mall's free shuttle and a growing protected bike lane grid make car-free days realistic in LoDo or Capitol Hill.
Albuquerque's ABQ Ride bus network covers the basics, and the New Mexico Rail Runner connects to Santa Fe, but frequency and coverage lag behind Denver. Most residents rely on a car nearly full-time, navigating the I-25/I-40 interchange, locally called the "Big I." If a short commute matters, Albuquerque's smaller scale can help: congestion rarely matches Denver's peak-hour gridlock on I-70 west.
Jobs and careers in Albuquerque vs. Denver
The local job market, dominant industries, and which city to choose based on your career.
The income gap is real: median household income sits at $68,317 in Albuquerque versus $94,718 in Denver, and the difference reflects two very different job markets. Denver has developed a genuine tech and finance corridor; Charles Schwab relocated its headquarters to Westlake, close enough to draw Denver talent, and software, aerospace, and healthcare firms have followed. UCHealth, Lockheed Martin, and a startup scene centered around RiNo give job-seekers more options at the higher end.
Albuquerque leans heavily on defense, research, and government work. Sandia National Laboratories and Kirtland Air Force Base are two of the largest employers in the state, and the University of New Mexico anchors healthcare and education hiring. The film industry has grown since Netflix and NBCUniversal opened production facilities here, adding a genuine creative sector to the local economy.
Salaries are lower on average, but the cost of living index of 102 versus Denver's 142 softens that gap considerably.
Weather and climate
What to expect day-to-day — sun, fog, heat, rain, and the seasonal extremes that shape the lifestyle.
Both cities sit at roughly a mile in elevation and claim around 300 sunny days a year, so on paper they sound similar. In practice, Albuquerque runs hotter and drier.
Summer afternoons regularly push into the mid-90s with minimal humidity, and monsoon season (July–September) brings brief but intense afternoon thunderstorms. Winters are mild by mountain standards; snow falls occasionally but usually melts within a day or two.
Denver's weather is defined by volatility. A January afternoon can hit 60°F thanks to Chinook winds, then drop 40 degrees by evening with a surprise snowstorm. The Front Range location means Denver sees meaningfully more snow than Albuquerque, which is great if you ski and less fun if you commute.
Neither city gets oppressive humidity, but if you want the driest and most predictable conditions, Albuquerque has the edge.
Culture, nightlife, and entertainment
Food, music, neighborhoods, and the city vibe that gives each place its personality.
Denver's cultural footprint is larger and more varied. The RiNo Arts District draws gallery-hoppers and muralists; Larimer Square is one of the better blocks for an independent-restaurant crawl; and the city has two professional sports venues within walking distance of each other (Coors Field, Ball Arena), with Empower Field nearby.
The craft beer scene is serious: Great Divide, Breckenridge Brewery, and dozens of taprooms are spread across the metro. Nightlife in LoDo runs deep into the week.
Albuquerque has a distinct identity that's easy to underestimate. Old Town roots the city in New Mexico's colonial and Native American heritage, Nob Hill delivers walkable local restaurants and bars along Central Avenue (the old Route 66), and the International Balloon Fiesta each October is one of the most striking events in the American West.
Green chile is a way of life, not a menu option, and the food culture (blending New Mexican, Native, and border influences) is genuinely its own thing. The nightlife scene is smaller than Denver's but real.
Outdoor activities and day trips
Parks, beaches, hikes, and the weekend escapes that define life outside the city limits.
Denver is a launching pad more than a destination for outdoor recreation. Rocky Mountain National Park is about 90 minutes away; ski resorts like Breckenridge, Loveland, and Vail are 60–90 minutes on I-70; Red Rocks Amphitheatre doubles as a concert venue and a free hiking spot with dramatic sandstone formations. Within the city, Washington Park and Cherry Creek Reservoir handle weekend cyclists and runners, and the South Platte River trail system runs through the urban core.
Albuquerque's outdoors are more immediately underfoot. The Sandia Mountains rise to nearly 11,000 feet at the city's edge; the Sandia Peak Tramway lifts you to the summit in 15 minutes, where hiking and mountain biking trails fan out above the treeline. Petroglyph National Monument sits within city limits, and the Rio Grande Bosque trail runs for miles through cottonwood forest.
Day trips reach White Sands National Park and the Jemez Mountains. It's a smaller outdoor menu than Denver's, but much of it requires no highway time at all.
Bottom line: which city is right for you?
Based on the head-to-head data above, here's the short version — pick the city that lines up with what you actually care about.
Choose Albuquerque if you prioritize…
- a lower cost of living (cheaper groceries, services, and day-to-day expenses).
- a more racially diverse community (lower HHI on Census data).
Choose Denver if you prioritize…
- lower crime — a safer place to live, work, and raise a family.
- more affordable housing relative to Albuquerque.
- a higher overall SnackAbility quality-of-life score.
Methodology: winners are picked from public data — U.S. Census Bureau ACS (income, home value, rent, race/HHI), FBI Uniform Crime Reporting (crime rates per 100k), and HomeSnacks' proprietary SnackAbility quality-of-life score, which blends Bureau of Labor Statistics data with the above.
More about New Mexico & Colorado

Best Places To Live In New Mexico
Photo: Public domain
Cheapest Places To Live In New Mexico
Photo: Public domain
Most Dangerous Cities In New Mexico
Photo: Public domain
Best Places To Raise A Family In New Mexico
Photo: Public domain
Best Places To Retire In New Mexico
Photo: Public domain
Richest Cities In New Mexico
Photo: Public domain
Safest Places In New Mexico
Photo: Public domain
Worst Places To Live In New Mexico
Photo: Public domain