St. Petersburg, FL
Demographics And Statistics
Living In St. Petersburg, Florida Summary
Life in St. Petersburg research summary. HomeSnacks has been using Saturday Night Science to research the quality of life in St. Petersburg over the past nine years using Census, FBI, Zillow, and other primary data sources. Based on the most recently available data, we found the following about life in St. Petersburg:
The population in St. Petersburg is 260,646.
The median home value in St. Petersburg is $349,235.
The median income in St. Petersburg is $73,118.
The cost of living in St. Petersburg is 103 which is 1.0x higher than the national average.
The median rent in St. Petersburg is $1,542.
The unemployment rate in St. Petersburg is 4.9%.
The poverty rate in St. Petersburg is 11.7%.
The average high in St. Petersburg is 81.2° and the average low is 65.6°.
St. Petersburg SnackAbility
Overall SnackAbility
St. Petersburg, FL Crime Report
Crime in St. Petersburg summary. We use data from the FBI to determine the crime rates in St. Petersburg. Key points include:
There were 8,158 total crimes in St. Petersburg in the last reporting year.
The overall crime rate per 100,000 people in St. Petersburg is 3,078.5 / 100k people.
The violent crime rate per 100,000 people in St. Petersburg is 619.6 / 100k people.
The property crime rate per 100,000 people in St. Petersburg is 2,458.9 / 100k people.
Overall, crime in St. Petersburg is 45.26% above the national average.
Total Crimes
Above National Average
Crime In St. Petersburg Comparison Table
| Statistic | Count Raw |
St. Petersburg / 100k People |
Florida / 100k People |
National / 100k People |
|---|---|---|---|---|
| Total Crimes Per 100K | 8,158 | 3,078.5 | 1,687.5 | 2,119.2 |
| Violent Crime | 1,642 | 619.6 | 267.1 | 359.0 |
| Murder | 18 | 6.8 | 3.9 | 5.0 |
| Robbery | 216 | 81.5 | 38.2 | 61.0 |
| Aggravated Assault | 1,293 | 487.9 | 197.1 | 256.0 |
| Property Crime | 6,516 | 2,458.9 | 1,420.4 | 1,760.0 |
| Burglary | 555 | 209.4 | 152.5 | 229.0 |
| Larceny | 5,379 | 2,029.8 | 1,144.9 | 1,272.0 |
| Car Theft | 582 | 219.6 | 123.0 | 259.0 |
St. Petersburg, FL Cost Of Living
Cost of living in St. Petersburg summary. We use data on the cost of living to determine how expensive it is to live in St. Petersburg. Real estate prices drive most of the variance in cost of living around Florida. Key points include:
The cost of living in St. Petersburg is 103 with 100 being average.
The cost of living in St. Petersburg is 1.0x higher than the national average.
The median home value in St. Petersburg is $349,235.
The median income in St. Petersburg is $73,118.
St. Petersburg's Overall Cost Of Living
Higher Than The National Average
Cost Of Living In St. Petersburg Comparison Table
| Living Expense | St. Petersburg | Florida | National Average | |
|---|---|---|---|---|
| Overall | 103 | 97 | 100 | |
| Services | 94 | 96 | 100 | |
| Groceries | 101 | 99 | 100 | |
| Health | 90 | 98 | 100 | |
| Housing | 123 | 96 | 100 | |
| Transportation | 100 | 97 | 100 | |
| Utilities | 100 | 95 | 100 | |
St. Petersburg, FL Weather
The average high in St. Petersburg is 81.2° and the average low is 65.6°.
There are 68.5 days of precipitation each year.
Expect an average of 50.1 inches of precipitation each year with 0.0 inches of snow.
| Stat | St. Petersburg |
|---|---|
| Average Annual High | 81.2 |
| Average Annual Low | 65.6 |
| Annual Precipitation Days | 68.5 |
| Average Annual Precipitation | 50.1 |
| Average Annual Snowfall | 0.0 |
Average High
Days of Rain
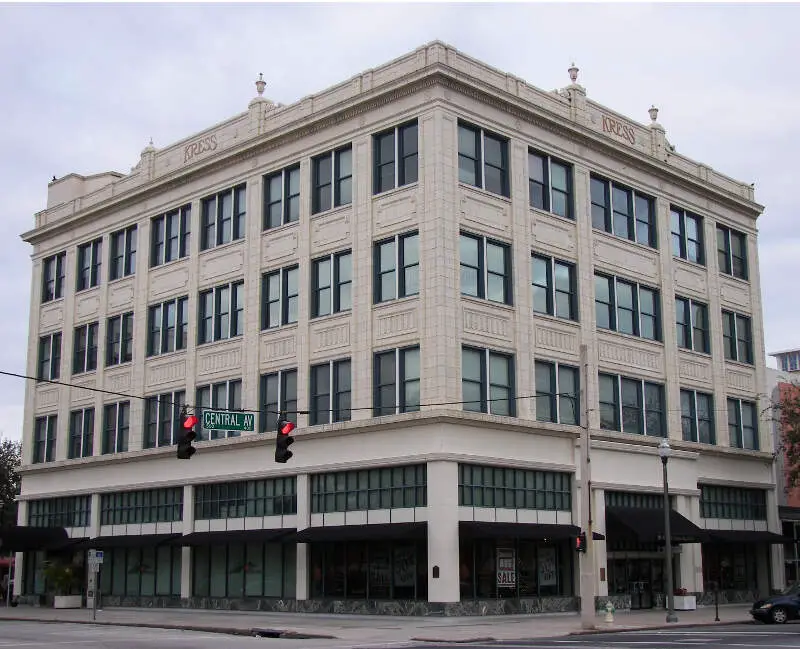
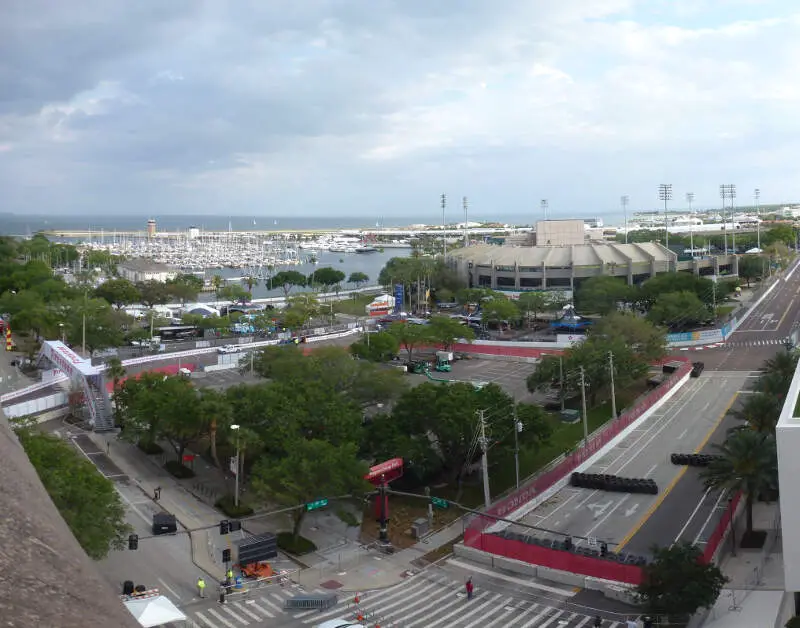
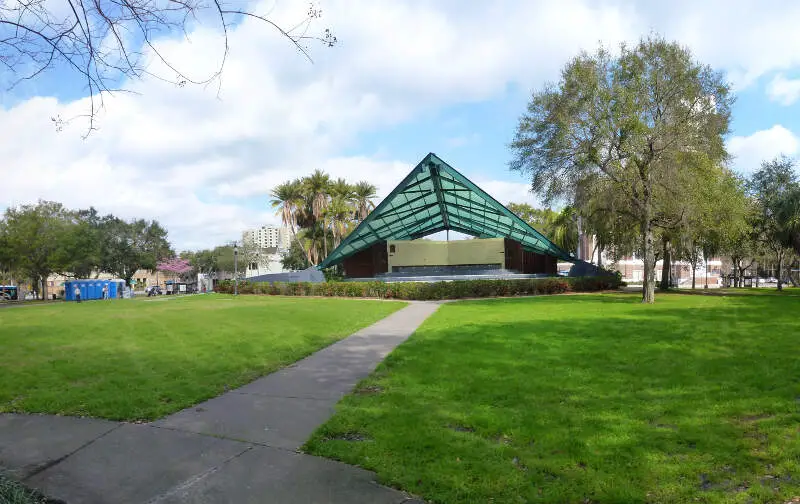
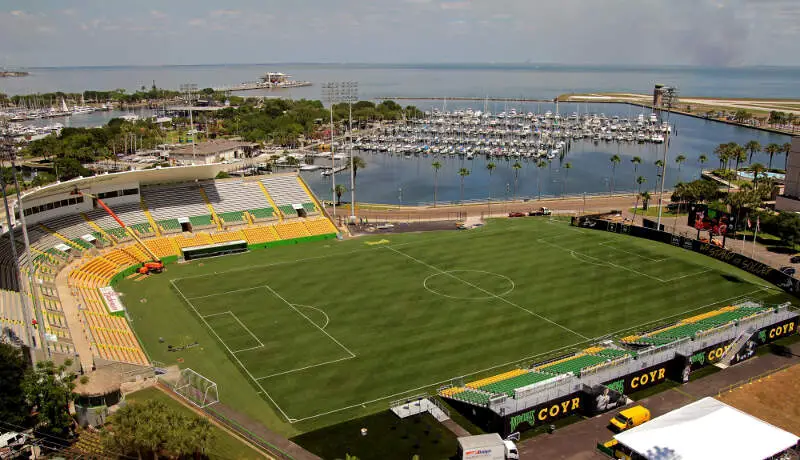
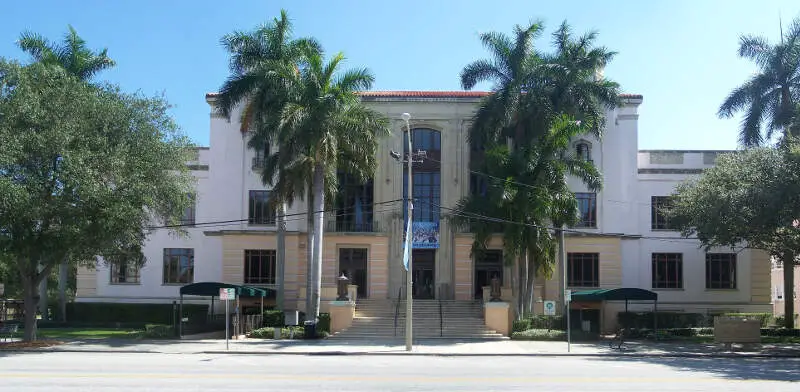
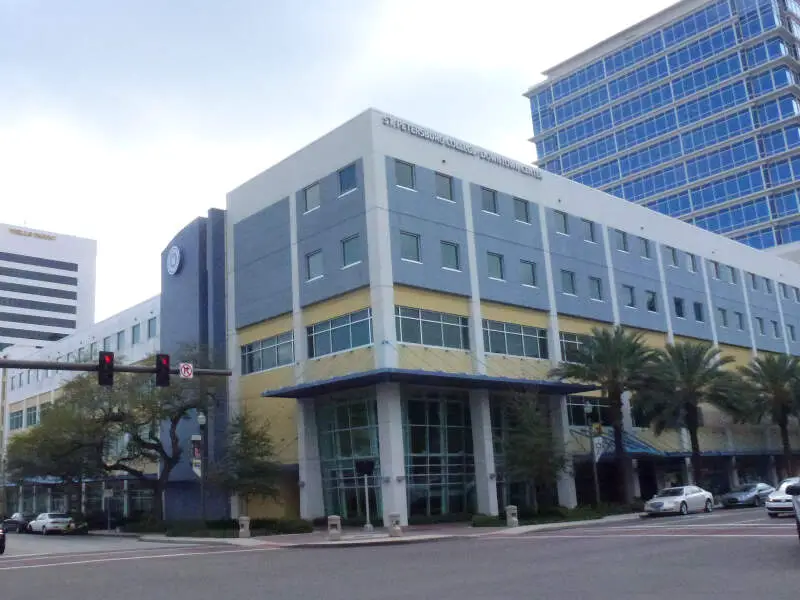
St. Petersburg, FL Photos


St. Petersburg Articles


Rankings for St. Petersburg in Florida

Locations Around St. Petersburg
Map Of St. Petersburg, FL
Best Places Around St. Petersburg
Safety Harbor, FL
Population 17,040
Pinellas Park, FL
Population 53,423
Progress, PA
Population 11,143
Largo, FL
Population 82,506
Oldsmar, FL
Population 14,872
Lealman, FL
Population 21,026
Town 'n' Country, FL
Population 86,544
Seminole, FL
Population 19,336
Bradenton, FL
Population 56,289
Egypt Lake-Leto, FL
Population 35,709
St. Petersburg Demographics And Statistics
Population over time in St. Petersburg
The current population in St. Petersburg is 260,646. The population has increased 6.1% from 2010.
| Year | Population | % Change |
|---|---|---|
| 2023 | 260,646 | 0.5% |
| 2022 | 259,343 | 0.4% |
| 2021 | 258,245 | -2.2% |
| 2020 | 264,001 | 1.0% |
| 2019 | 261,338 | 0.9% |
| 2018 | 259,041 | 1.2% |
| 2017 | 256,031 | 1.0% |
| 2016 | 253,585 | 1.1% |
| 2015 | 250,713 | 0.9% |
| 2014 | 248,429 | 0.7% |
| 2013 | 246,642 | 0.5% |
| 2012 | 245,363 | 0.1% |
| 2011 | 245,097 | -0.3% |
| 2010 | 245,715 | - |
Race / Ethnicity in St. Petersburg
St. Petersburg is:
63.6% White with 165,818 White residents.
19.2% African American with 50,042 African American residents.
0.1% American Indian with 251 American Indian residents.
3.0% Asian with 7,905 Asian residents.
0.0% Hawaiian with 32 Hawaiian residents.
0.6% Other with 1,556 Other residents.
4.1% Two Or More with 10,706 Two Or More residents.
9.3% Hispanic with 24,336 Hispanic residents.
| Race | St. Petersburg | FL | USA |
|---|---|---|---|
| White | 63.6% | 51.4% | 58.2% |
| African American | 19.2% | 14.8% | 12.0% |
| American Indian | 0.1% | 0.1% | 0.5% |
| Asian | 3.0% | 2.8% | 5.7% |
| Hawaiian | 0.0% | 0.1% | 0.2% |
| Other | 0.6% | 0.6% | 0.5% |
| Two Or More | 4.1% | 3.5% | 3.9% |
| Hispanic | 9.3% | 26.7% | 19.0% |
Gender in St. Petersburg
St. Petersburg is 52.0% female with 135,661 female residents.
St. Petersburg is 48.0% male with 124,985 male residents.
| Gender | St. Petersburg | FL | USA |
|---|---|---|---|
| Female | 52.0% | 50.9% | 50.5% |
| Male | 48.0% | 49.1% | 49.5% |
Highest level of educational attainment in St. Petersburg for adults over 25
1.0% of adults in St. Petersburg completed < 9th grade.
4.0% of adults in St. Petersburg completed 9-12th grade.
23.0% of adults in St. Petersburg completed high school / ged.
20.0% of adults in St. Petersburg completed some college.
10.0% of adults in St. Petersburg completed associate's degree.
26.0% of adults in St. Petersburg completed bachelor's degree.
11.0% of adults in St. Petersburg completed master's degree.
3.0% of adults in St. Petersburg completed professional degree.
2.0% of adults in St. Petersburg completed doctorate degree.
| Education | St. Petersburg | FL | USA |
|---|---|---|---|
| < 9th Grade | 1.0% | 5.0% | 5.0% |
| 9-12th Grade | 4.0% | 6.0% | 6.0% |
| High School / GED | 23.0% | 27.0% | 26.0% |
| Some College | 20.0% | 19.0% | 19.0% |
| Associate's Degree | 10.0% | 10.0% | 9.0% |
| Bachelor's Degree | 26.0% | 21.0% | 21.0% |
| Master's Degree | 11.0% | 9.0% | 10.0% |
| Professional Degree | 3.0% | 2.0% | 2.0% |
| Doctorate Degree | 2.0% | 1.0% | 2.0% |
Household Income For St. Petersburg, Florida
5.3% of households in St. Petersburg earn Less than $10,000.
3.4% of households in St. Petersburg earn $10,000 to $14,999.
6.3% of households in St. Petersburg earn $15,000 to $24,999.
6.8% of households in St. Petersburg earn $25,000 to $34,999.
11.4% of households in St. Petersburg earn $35,000 to $49,999.
18.2% of households in St. Petersburg earn $50,000 to $74,999.
13.6% of households in St. Petersburg earn $75,000 to $99,999.
16.1% of households in St. Petersburg earn $100,000 to $149,999.
7.7% of households in St. Petersburg earn $150,000 to $199,999.
11.3% of households in St. Petersburg earn $200,000 or more.
| Income | St. Petersburg | FL | USA |
|---|---|---|---|
| Less than $10,000 | 5.3% | 5.1% | 4.9% |
| $10,000 to $14,999 | 3.4% | 3.4% | 3.6% |
| $15,000 to $24,999 | 6.3% | 7.0% | 6.6% |
| $25,000 to $34,999 | 6.8% | 7.7% | 6.8% |
| $35,000 to $49,999 | 11.4% | 11.6% | 10.4% |
| $50,000 to $74,999 | 18.2% | 17.3% | 15.7% |
| $75,000 to $99,999 | 13.6% | 13.1% | 12.7% |
| $100,000 to $149,999 | 16.1% | 16.8% | 17.4% |
| $150,000 to $199,999 | 7.7% | 8.0% | 9.3% |
| $200,000 or more | 11.3% | 10.1% | 12.6% |


