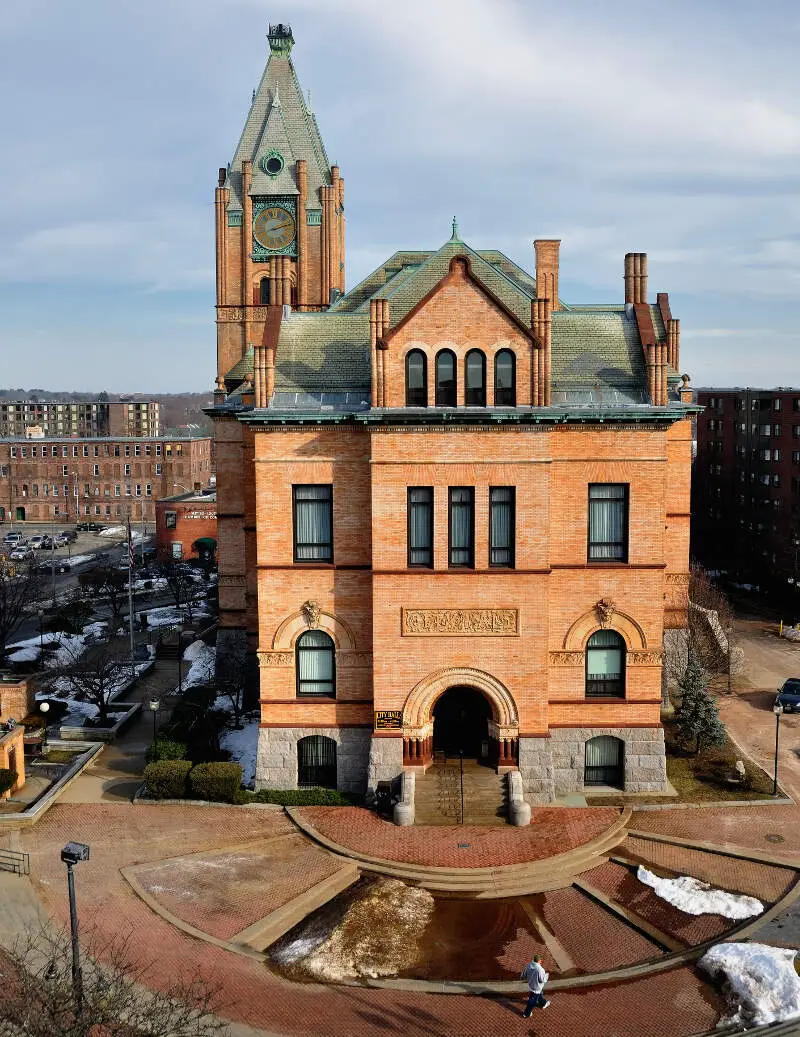
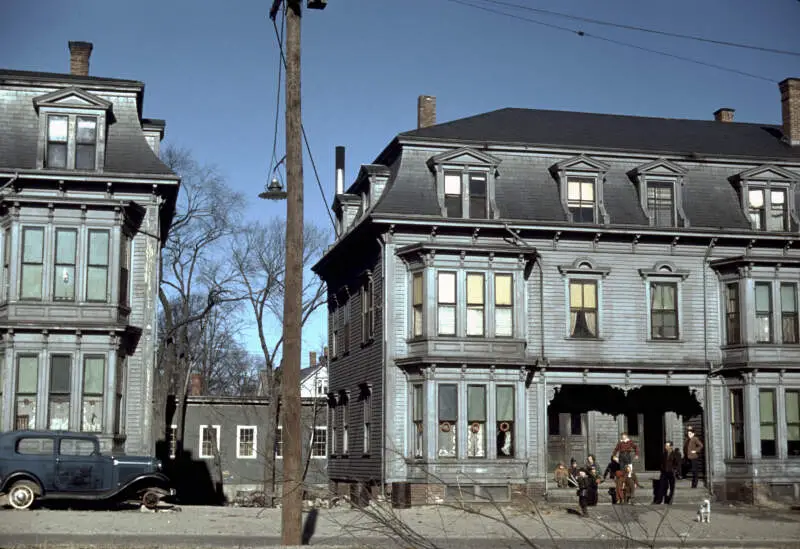
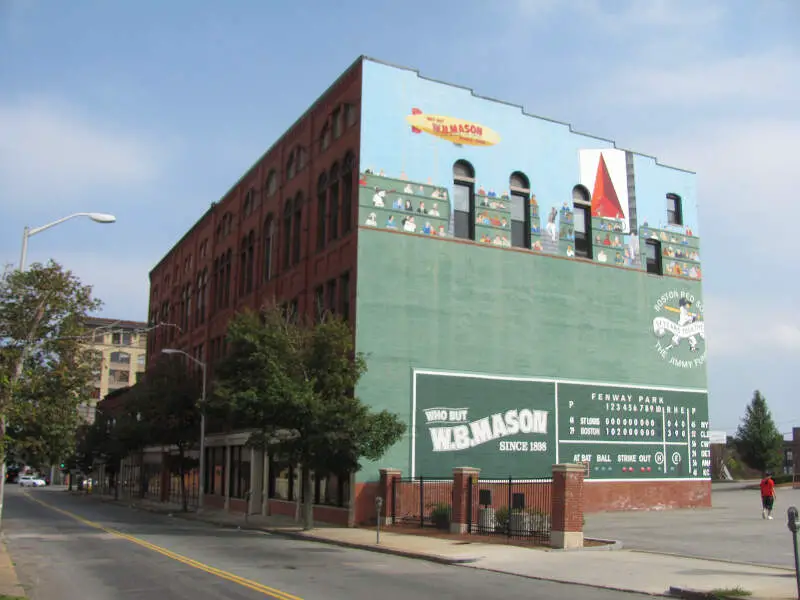
Brockton, MA
Demographics And Statistics
Living In Brockton, Massachusetts Summary
Life in Brockton research summary. HomeSnacks has been using Saturday Night Science to research the quality of life in Brockton over the past nine years using Census, FBI, Zillow, and other primary data sources. Based on the most recently available data, we found the following about life in Brockton:
The population in Brockton is 105,080.
The median home value in Brockton is $497,739.
The median income in Brockton is $77,089.
The cost of living in Brockton is 128 which is 1.3x higher than the national average.
The median rent in Brockton is $1,545.
The unemployment rate in Brockton is 8.3%.
The poverty rate in Brockton is 13.9%.
The average high in Brockton is 60.2° and the average low is 39.7°.
Brockton SnackAbility
Overall SnackAbility
Brockton, MA Crime Report
Crime in Brockton summary. We use data from the FBI to determine the crime rates in Brockton. Key points include:
There were 2,074 total crimes in Brockton in the last reporting year.
The overall crime rate per 100,000 people in Brockton is 1,944.7 / 100k people.
The violent crime rate per 100,000 people in Brockton is 599.2 / 100k people.
The property crime rate per 100,000 people in Brockton is 1,345.5 / 100k people.
Overall, crime in Brockton is -8.24% below the national average.
Total Crimes
Below National Average
Crime In Brockton Comparison Table
| Statistic | Count Raw |
Brockton / 100k People |
Massachusetts / 100k People |
National / 100k People |
|---|---|---|---|---|
| Total Crimes Per 100K | 2,074 | 1,944.7 | 1,426.8 | 2,119.2 |
| Violent Crime | 639 | 599.2 | 314.7 | 359.0 |
| Murder | 8 | 7.5 | 1.8 | 5.0 |
| Robbery | 72 | 67.5 | 36.0 | 61.0 |
| Aggravated Assault | 491 | 460.4 | 249.3 | 256.0 |
| Property Crime | 1,435 | 1,345.5 | 1,112.1 | 1,760.0 |
| Burglary | 249 | 233.5 | 130.3 | 229.0 |
| Larceny | 801 | 751.1 | 876.3 | 1,272.0 |
| Car Theft | 385 | 361.0 | 105.5 | 259.0 |
Brockton, MA Cost Of Living
Cost of living in Brockton summary. We use data on the cost of living to determine how expensive it is to live in Brockton. Real estate prices drive most of the variance in cost of living around Massachusetts. Key points include:
The cost of living in Brockton is 128 with 100 being average.
The cost of living in Brockton is 1.3x higher than the national average.
The median home value in Brockton is $497,739.
The median income in Brockton is $77,089.
Brockton's Overall Cost Of Living
Higher Than The National Average
Cost Of Living In Brockton Comparison Table
| Living Expense | Brockton | Massachusetts | National Average | |
|---|---|---|---|---|
| Overall | 128 | 134 | 100 | |
| Services | 122 | 121 | 100 | |
| Groceries | 106 | 106 | 100 | |
| Health | 114 | 112 | 100 | |
| Housing | 145 | 164 | 100 | |
| Transportation | 118 | 120 | 100 | |
| Utilities | 135 | 136 | 100 | |
Brockton, MA Weather
The average high in Brockton is 60.2° and the average low is 39.7°.
There are 80.4 days of precipitation each year.
Expect an average of 49.9 inches of precipitation each year with 48.3 inches of snow.
| Stat | Brockton |
|---|---|
| Average Annual High | 60.2 |
| Average Annual Low | 39.7 |
| Annual Precipitation Days | 80.4 |
| Average Annual Precipitation | 49.9 |
| Average Annual Snowfall | 48.3 |
Average High
Days of Rain
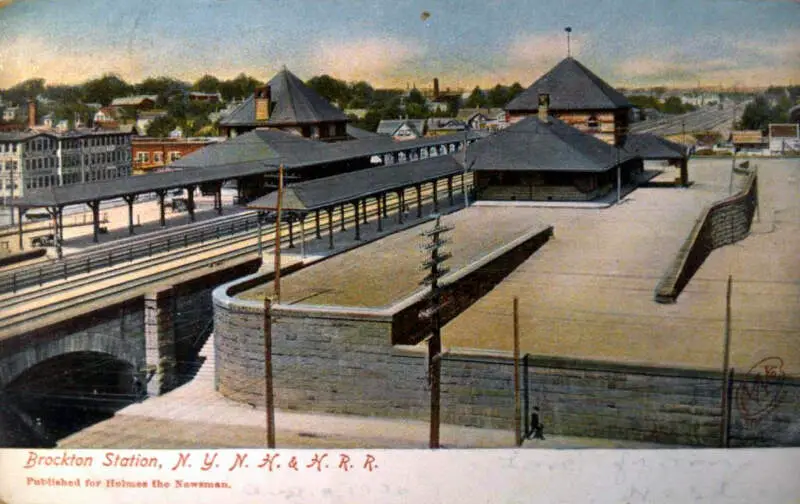
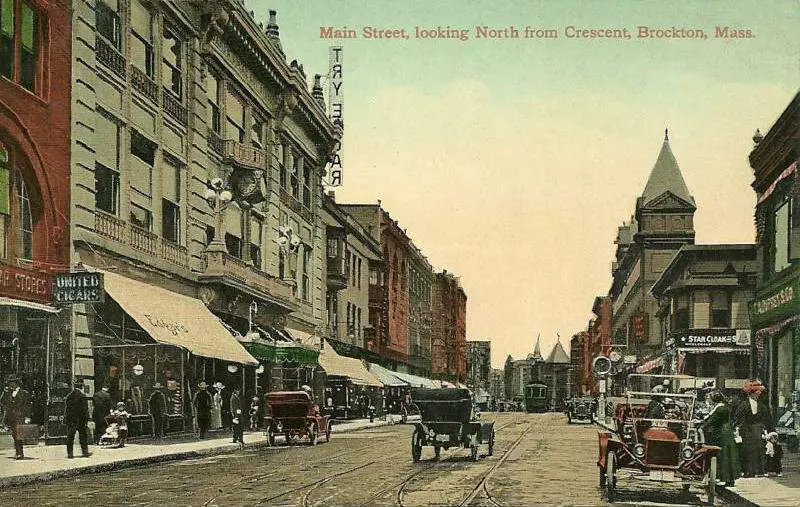
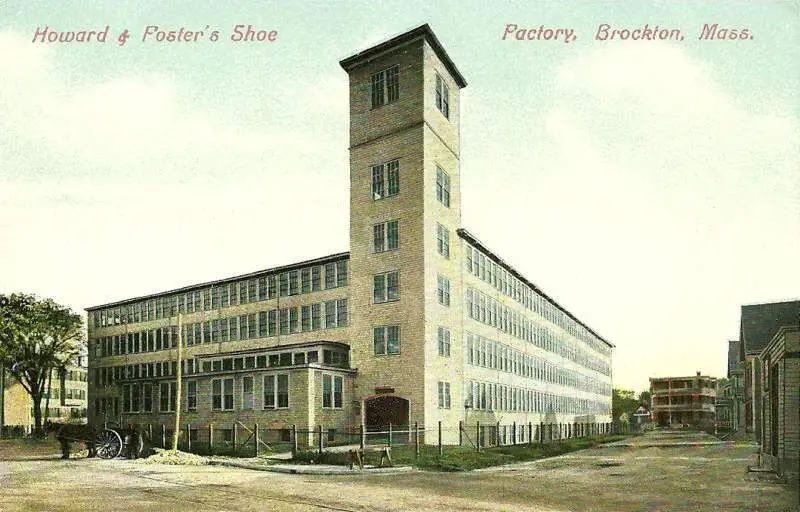
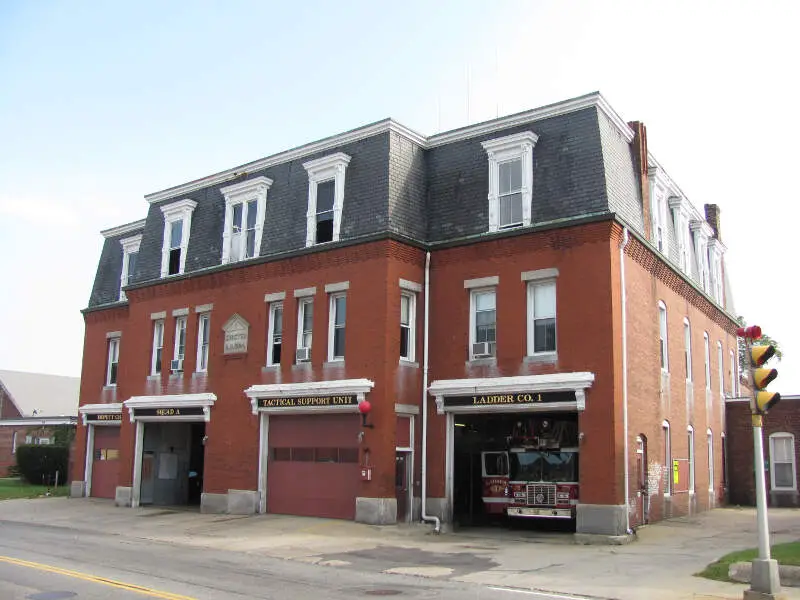
Brockton, MA Photos
2 Reviews & Comments About Brockton
/5

ââÂÂ,âÂÂÃÂââÂÂøÃÂÃÂâ1 - None
I live in Brockton and in the summer it's Worst out here ! it's funny how Boston is not up there if you live in MA you would know how bad Boston is
HomeSnacks User - 2019-03-10 01:55:02.227533
Brockton gets a bad rep. There are large portions of the city that are beautiful and despite the school system being overpopulated, there are plenty of opportunities for students that want to succeed.
Favorite places: Westside Pizza Shop, Fuller Craft Museum, Rocky Marciano Stadium.
Rankings for Brockton in Massachusetts


Locations Around Brockton
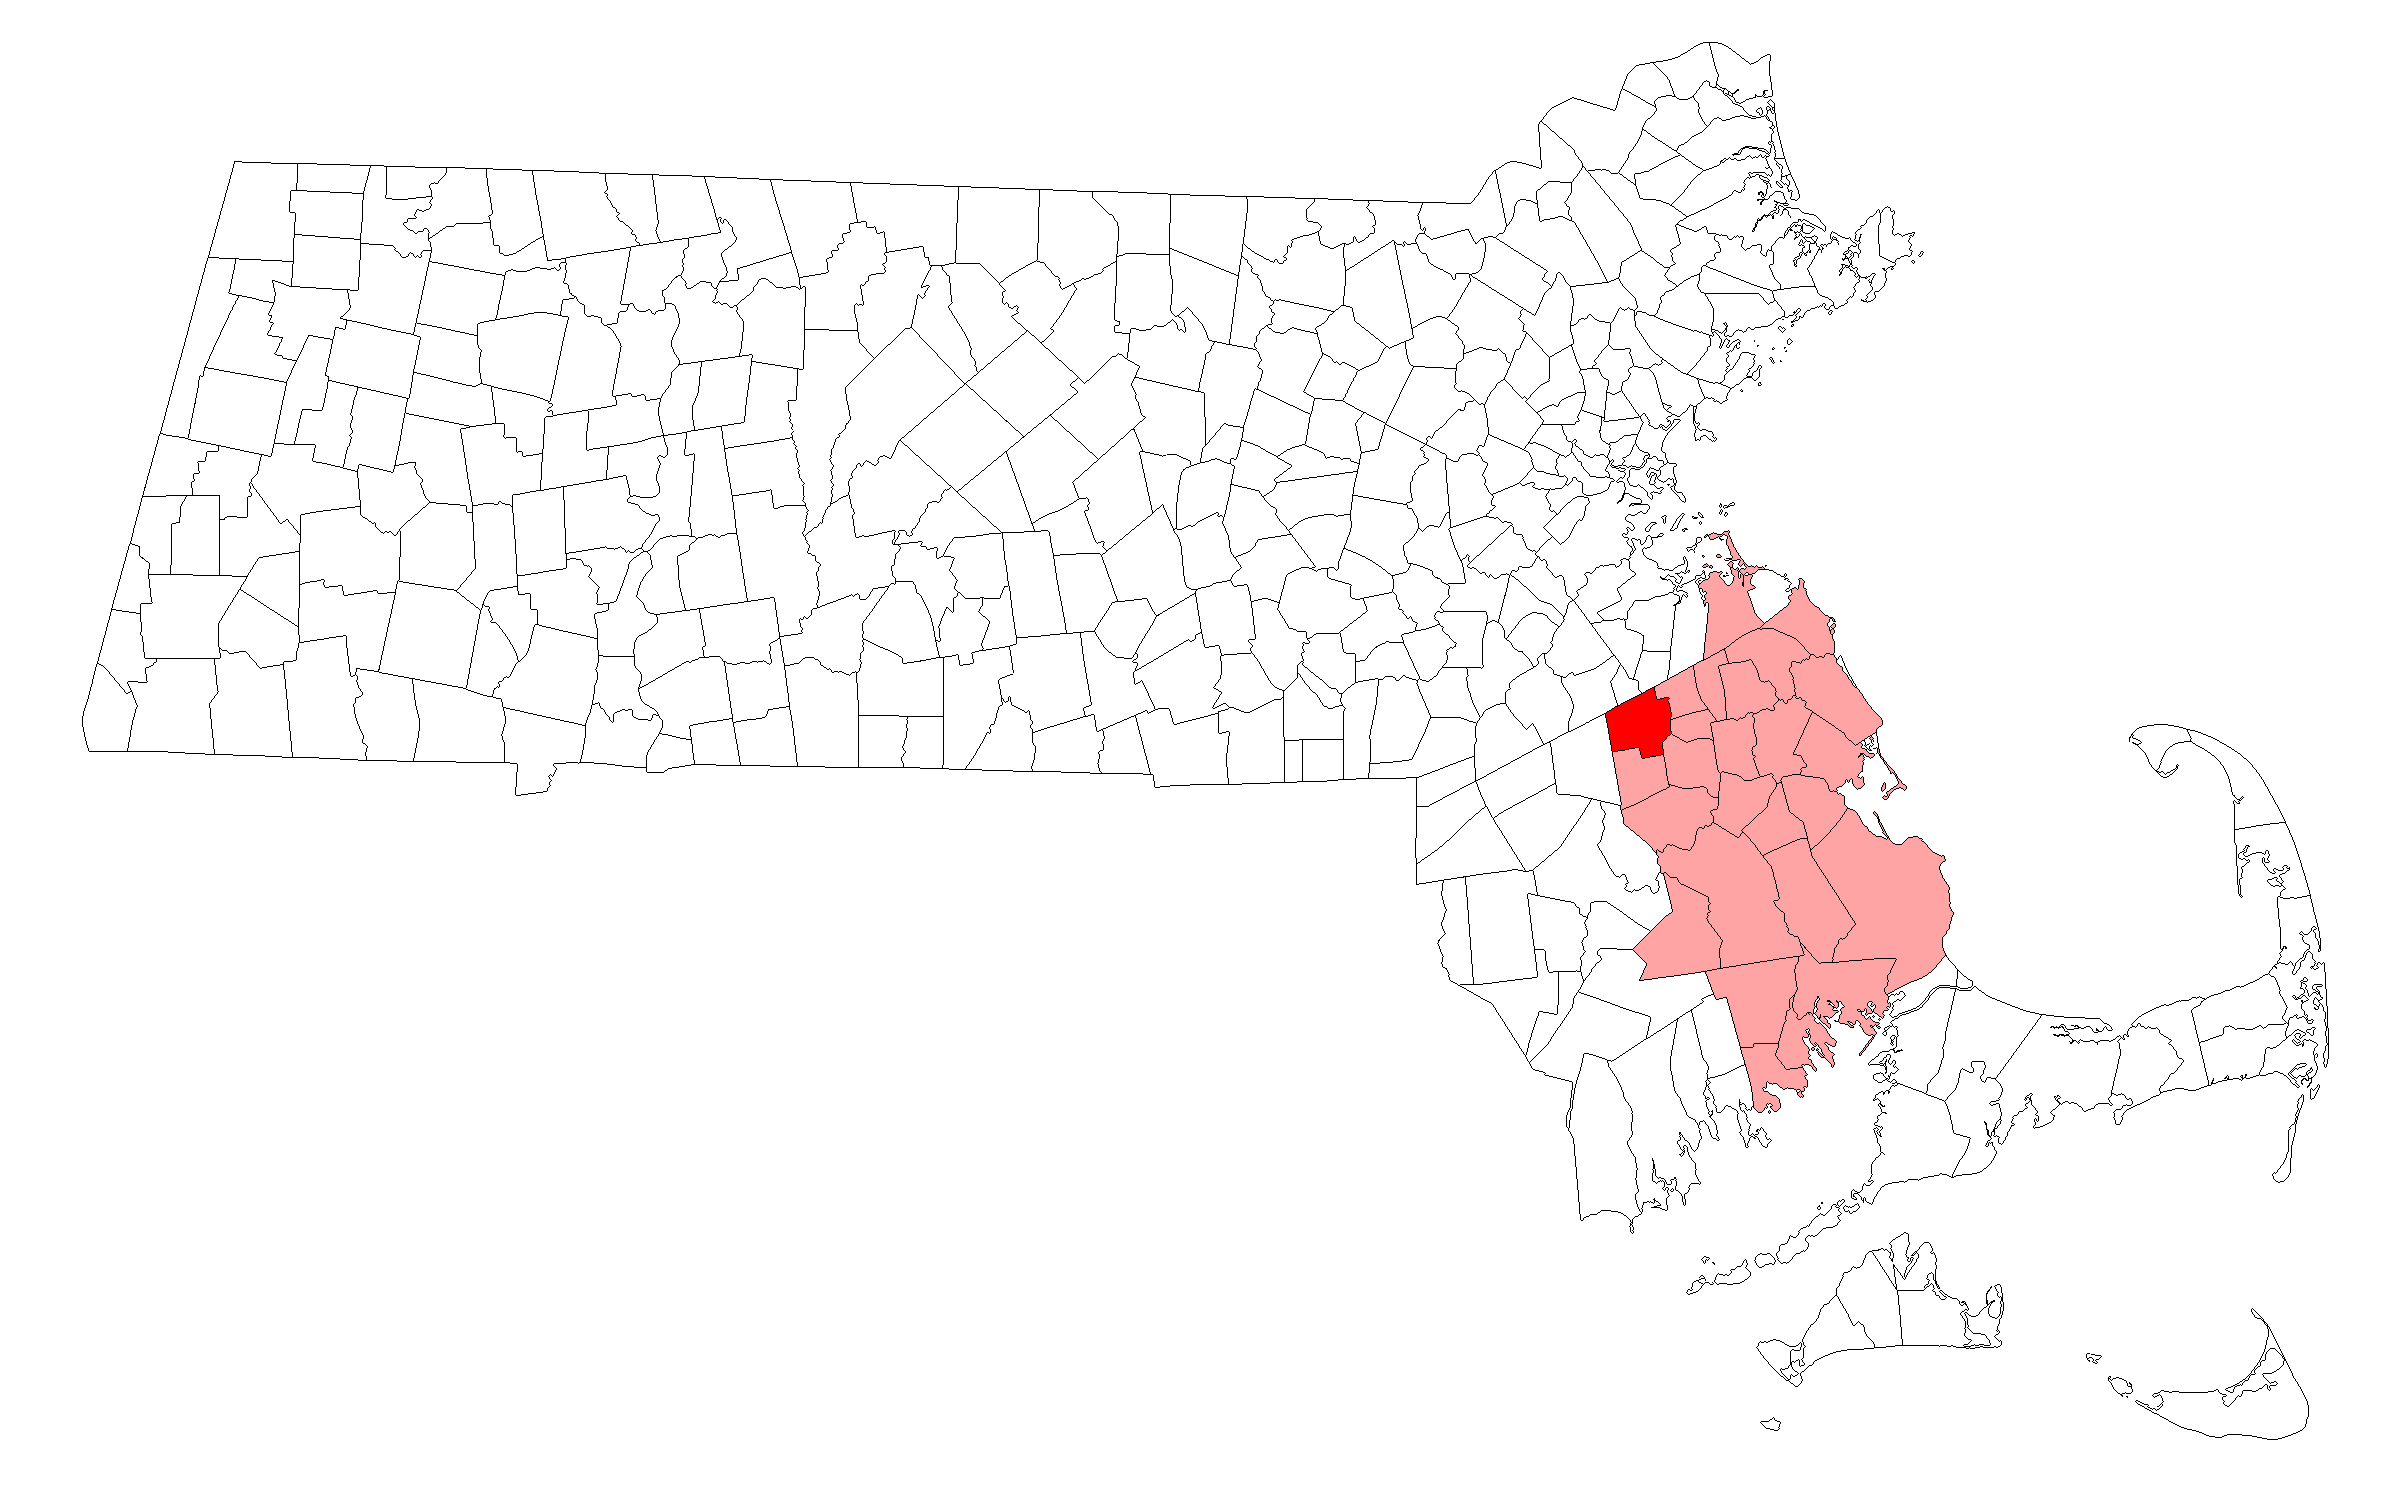
Map Of Brockton, MA
Best Places Around Brockton
Sharon, MA
Population 6,022
Needham, MA
Population 32,059
Newton, MA
Population 88,504
Brookline, MA
Population 62,822
Medfield, MA
Population 6,355
Milton, MA
Population 28,481
Hingham, MA
Population 5,343
Dedham, MA
Population 25,109
Norwood, MA
Population 31,380
Walpole, MA
Population 5,989
Brockton Demographics And Statistics
Population over time in Brockton
The current population in Brockton is 105,080. The population has increased 11.9% from 2010.
| Year | Population | % Change |
|---|---|---|
| 2023 | 105,080 | 0.4% |
| 2022 | 104,713 | 0.5% |
| 2021 | 104,216 | 8.9% |
| 2020 | 95,740 | 0.2% |
| 2019 | 95,594 | 0.2% |
| 2018 | 95,426 | 0.3% |
| 2017 | 95,161 | 0.4% |
| 2016 | 94,813 | 0.3% |
| 2015 | 94,532 | 0.3% |
| 2014 | 94,267 | 0.4% |
| 2013 | 93,911 | -0.0% |
| 2012 | 93,916 | 0.0% |
| 2011 | 93,916 | 0.1% |
| 2010 | 93,869 | - |
Race / Ethnicity in Brockton
Brockton is:
26.6% White with 27,965 White residents.
37.0% African American with 38,923 African American residents.
0.1% American Indian with 90 American Indian residents.
2.2% Asian with 2,263 Asian residents.
0.1% Hawaiian with 91 Hawaiian residents.
6.8% Other with 7,145 Other residents.
14.3% Two Or More with 15,017 Two Or More residents.
12.9% Hispanic with 13,586 Hispanic residents.
| Race | Brockton | MA | USA |
|---|---|---|---|
| White | 26.6% | 67.8% | 58.2% |
| African American | 37.0% | 6.5% | 12.0% |
| American Indian | 0.1% | 0.1% | 0.5% |
| Asian | 2.2% | 7.0% | 5.7% |
| Hawaiian | 0.1% | 0.0% | 0.2% |
| Other | 6.8% | 1.1% | 0.5% |
| Two Or More | 14.3% | 4.5% | 3.9% |
| Hispanic | 12.9% | 12.9% | 19.0% |
Gender in Brockton
Brockton is 51.4% female with 54,047 female residents.
Brockton is 48.6% male with 51,033 male residents.
| Gender | Brockton | MA | USA |
|---|---|---|---|
| Female | 51.4% | 51.1% | 50.5% |
| Male | 48.6% | 48.9% | 49.5% |
Highest level of educational attainment in Brockton for adults over 25
10.0% of adults in Brockton completed < 9th grade.
7.0% of adults in Brockton completed 9-12th grade.
34.0% of adults in Brockton completed high school / ged.
19.0% of adults in Brockton completed some college.
8.0% of adults in Brockton completed associate's degree.
15.0% of adults in Brockton completed bachelor's degree.
6.0% of adults in Brockton completed master's degree.
1.0% of adults in Brockton completed professional degree.
0.0% of adults in Brockton completed doctorate degree.
| Education | Brockton | MA | USA |
|---|---|---|---|
| < 9th Grade | 10.0% | 5.0% | 5.0% |
| 9-12th Grade | 7.0% | 4.0% | 6.0% |
| High School / GED | 34.0% | 23.0% | 26.0% |
| Some College | 19.0% | 14.0% | 19.0% |
| Associate's Degree | 8.0% | 8.0% | 9.0% |
| Bachelor's Degree | 15.0% | 25.0% | 21.0% |
| Master's Degree | 6.0% | 15.0% | 10.0% |
| Professional Degree | 1.0% | 3.0% | 2.0% |
| Doctorate Degree | 0.0% | 3.0% | 2.0% |
Household Income For Brockton, Massachusetts
4.5% of households in Brockton earn Less than $10,000.
5.0% of households in Brockton earn $10,000 to $14,999.
7.4% of households in Brockton earn $15,000 to $24,999.
6.7% of households in Brockton earn $25,000 to $34,999.
9.3% of households in Brockton earn $35,000 to $49,999.
15.9% of households in Brockton earn $50,000 to $74,999.
12.7% of households in Brockton earn $75,000 to $99,999.
17.0% of households in Brockton earn $100,000 to $149,999.
10.5% of households in Brockton earn $150,000 to $199,999.
11.0% of households in Brockton earn $200,000 or more.
| Income | Brockton | MA | USA |
|---|---|---|---|
| Less than $10,000 | 4.5% | 4.3% | 4.9% |
| $10,000 to $14,999 | 5.0% | 3.5% | 3.6% |
| $15,000 to $24,999 | 7.4% | 5.6% | 6.6% |
| $25,000 to $34,999 | 6.7% | 5.1% | 6.8% |
| $35,000 to $49,999 | 9.3% | 7.7% | 10.4% |
| $50,000 to $74,999 | 15.9% | 12.2% | 15.7% |
| $75,000 to $99,999 | 12.7% | 11.0% | 12.7% |
| $100,000 to $149,999 | 17.0% | 17.7% | 17.4% |
| $150,000 to $199,999 | 10.5% | 11.8% | 9.3% |
| $200,000 or more | 11.0% | 21.1% | 12.6% |


