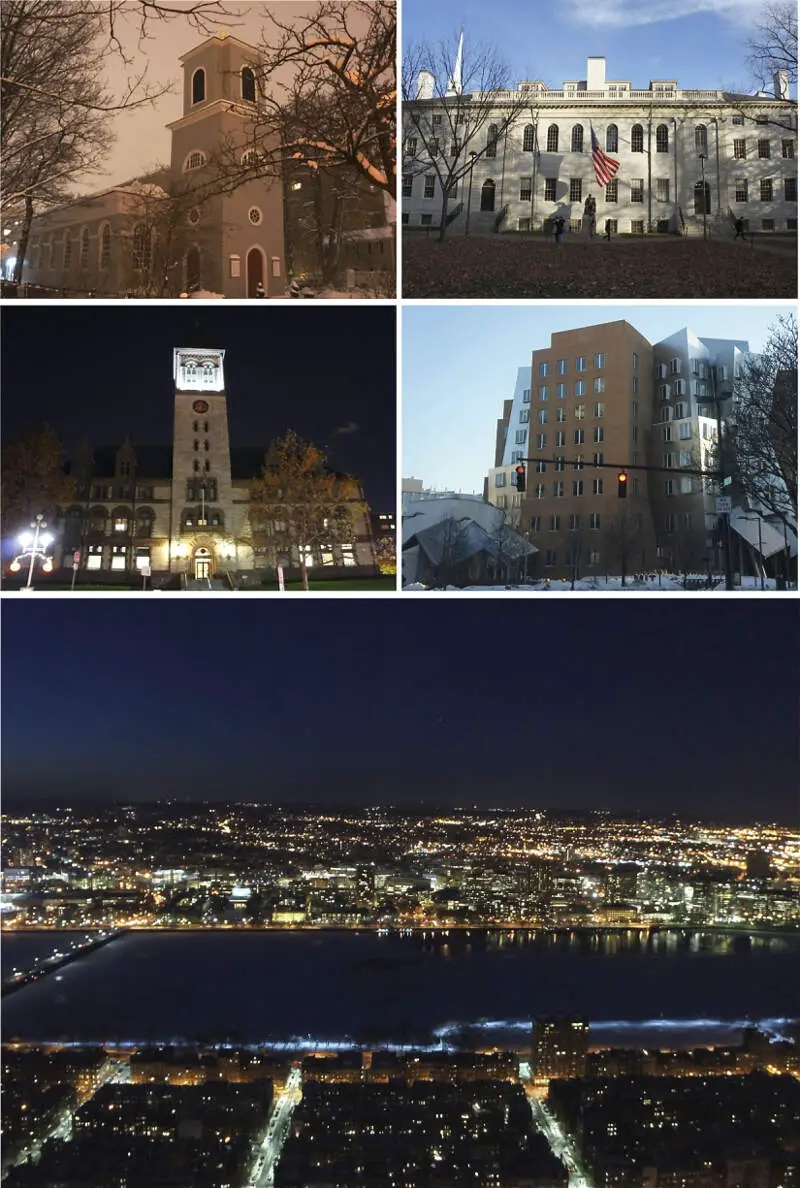
Cambridge, MA
Demographics And Statistics
Living In Cambridge, Massachusetts Summary
Life in Cambridge research summary. HomeSnacks has been using Saturday Night Science to research the quality of life in Cambridge over the past nine years using Census, FBI, Zillow, and other primary data sources. Based on the most recently available data, we found the following about life in Cambridge:
The population in Cambridge is 117,794.
The median home value in Cambridge is $1,039,769.
The median income in Cambridge is $126,469.
The cost of living in Cambridge is 201 which is 2.0x higher than the national average.
The median rent in Cambridge is $2,742.
The unemployment rate in Cambridge is 3.4%.
The poverty rate in Cambridge is 12.4%.
The average high in Cambridge is 59.7° and the average low is 41.0°.
Cambridge SnackAbility
Overall SnackAbility
Cambridge, MA Crime Report
Crime in Cambridge summary. We use data from the FBI to determine the crime rates in Cambridge. Key points include:
There were 3,711 total crimes in Cambridge in the last reporting year.
The overall crime rate per 100,000 people in Cambridge is 3,081.0 / 100k people.
The violent crime rate per 100,000 people in Cambridge is 436.7 / 100k people.
The property crime rate per 100,000 people in Cambridge is 2,644.3 / 100k people.
Overall, crime in Cambridge is 45.38% above the national average.
Total Crimes
Above National Average
Crime In Cambridge Comparison Table
| Statistic | Count Raw |
Cambridge / 100k People |
Massachusetts / 100k People |
National / 100k People |
|---|---|---|---|---|
| Total Crimes Per 100K | 3,711 | 3,081.0 | 1,426.8 | 2,119.2 |
| Violent Crime | 526 | 436.7 | 314.7 | 359.0 |
| Murder | 0 | 0.0 | 1.8 | 5.0 |
| Robbery | 110 | 91.3 | 36.0 | 61.0 |
| Aggravated Assault | 375 | 311.3 | 249.3 | 256.0 |
| Property Crime | 3,185 | 2,644.3 | 1,112.1 | 1,760.0 |
| Burglary | 285 | 236.6 | 130.3 | 229.0 |
| Larceny | 2,798 | 2,323.0 | 876.3 | 1,272.0 |
| Car Theft | 102 | 84.7 | 105.5 | 259.0 |
Cambridge, MA Cost Of Living
Cost of living in Cambridge summary. We use data on the cost of living to determine how expensive it is to live in Cambridge. Real estate prices drive most of the variance in cost of living around Massachusetts. Key points include:
The cost of living in Cambridge is 201 with 100 being average.
The cost of living in Cambridge is 2.0x higher than the national average.
The median home value in Cambridge is $1,039,769.
The median income in Cambridge is $126,469.
Cambridge's Overall Cost Of Living
Higher Than The National Average
Cost Of Living In Cambridge Comparison Table
| Living Expense | Cambridge | Massachusetts | National Average | |
|---|---|---|---|---|
| Overall | 201 | 134 | 100 | |
| Services | 123 | 121 | 100 | |
| Groceries | 105 | 106 | 100 | |
| Health | 112 | 112 | 100 | |
| Housing | 390 | 164 | 100 | |
| Transportation | 116 | 120 | 100 | |
| Utilities | 134 | 136 | 100 | |
Cambridge, MA Weather
The average high in Cambridge is 59.7° and the average low is 41.0°.
There are 76.2 days of precipitation each year.
Expect an average of 49.0 inches of precipitation each year with 52.5 inches of snow.
| Stat | Cambridge |
|---|---|
| Average Annual High | 59.7 |
| Average Annual Low | 41.0 |
| Annual Precipitation Days | 76.2 |
| Average Annual Precipitation | 49.0 |
| Average Annual Snowfall | 52.5 |
Average High
Days of Rain
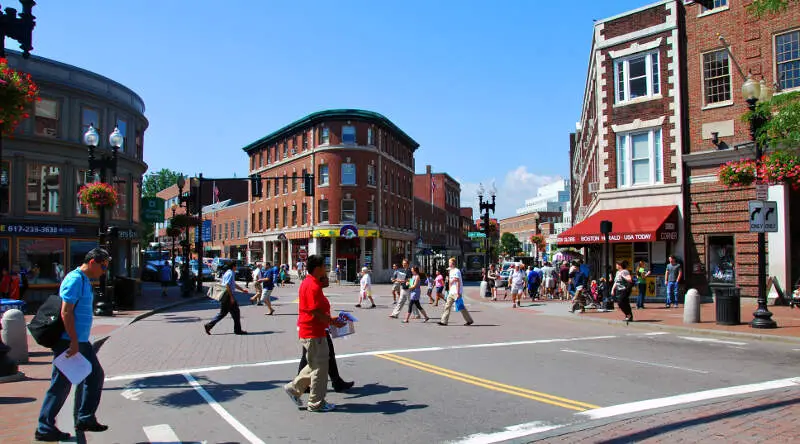
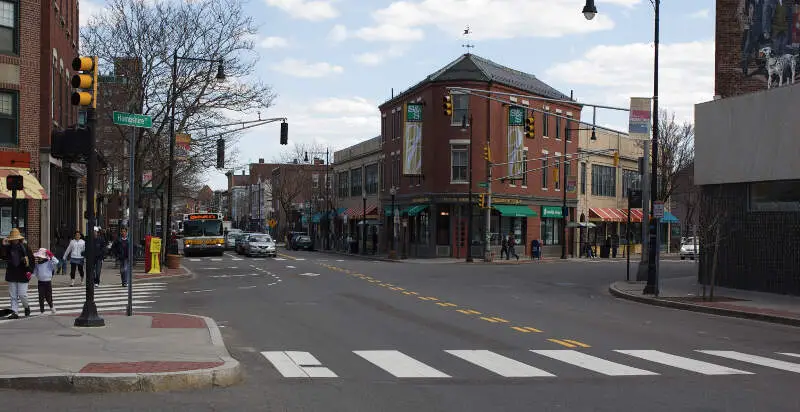
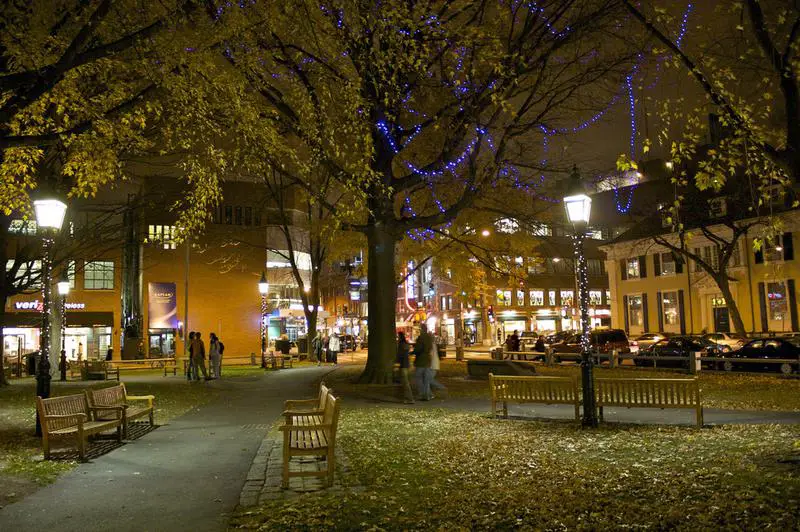
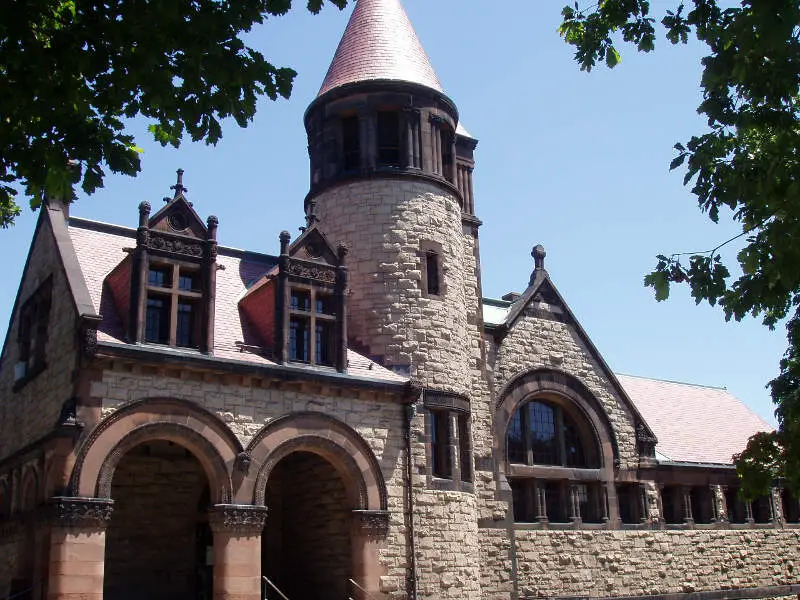
Cambridge, MA Photos


1 Reviews & Comments About Cambridge
/5

HomeSnacks User - 2019-01-08 16:22:45.054302
Crime is low, I believe. The school system is exceptional and unique with the "controlled choice" policies that foster diversity. Lots of quirky and trendy places to eat and hangout.
Lots of young adults because of all the colleges. Also the style is very historic with all the brick.
Rankings for Cambridge in Massachusetts


Locations Around Cambridge
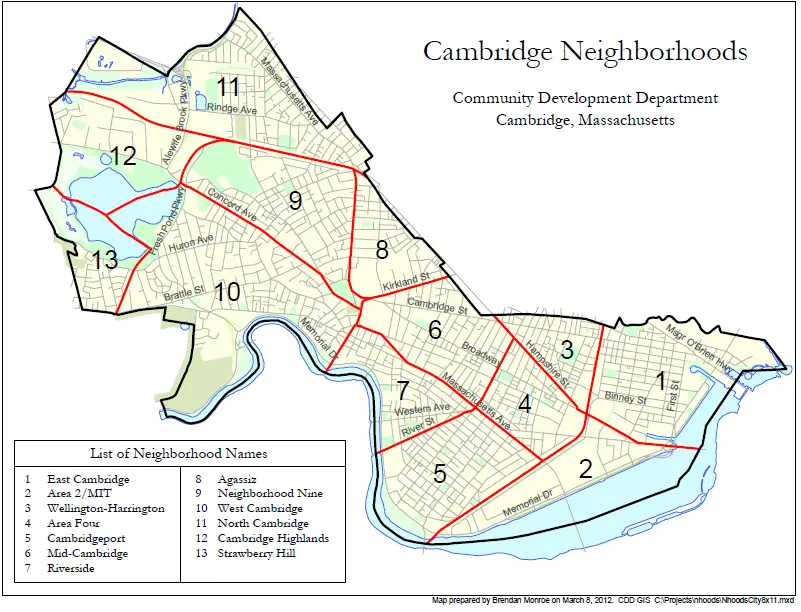
Map Of Cambridge, MA
Best Places Around Cambridge
Lexington, MA
Population 34,085
Wellesley, MA
Population 29,906
Marblehead, MA
Population 20,334
Sharon, MA
Population 6,022
Needham, MA
Population 32,059
Newton, MA
Population 88,504
Winchester, MA
Population 22,862
Reading, MA
Population 25,448
Cochituate, MA
Population 6,688
Brookline, MA
Population 62,822
Cambridge Demographics And Statistics
Population over time in Cambridge
The current population in Cambridge is 117,794. The population has increased 13.8% from 2010.
| Year | Population | % Change |
|---|---|---|
| 2023 | 117,794 | -0.1% |
| 2022 | 117,962 | 0.9% |
| 2021 | 116,892 | -0.8% |
| 2020 | 117,822 | 1.0% |
| 2019 | 116,632 | 0.8% |
| 2018 | 115,665 | 4.3% |
| 2017 | 110,893 | 2.0% |
| 2016 | 108,757 | 0.8% |
| 2015 | 107,916 | 1.0% |
| 2014 | 106,844 | 1.0% |
| 2013 | 105,737 | 0.7% |
| 2012 | 105,026 | 0.7% |
| 2011 | 104,322 | 0.8% |
| 2010 | 103,506 | - |
Race / Ethnicity in Cambridge
Cambridge is:
55.0% White with 64,830 White residents.
10.2% African American with 12,064 African American residents.
0.1% American Indian with 76 American Indian residents.
19.6% Asian with 23,046 Asian residents.
0.0% Hawaiian with 55 Hawaiian residents.
0.7% Other with 823 Other residents.
5.4% Two Or More with 6,357 Two Or More residents.
9.0% Hispanic with 10,543 Hispanic residents.
| Race | Cambridge | MA | USA |
|---|---|---|---|
| White | 55.0% | 67.8% | 58.2% |
| African American | 10.2% | 6.5% | 12.0% |
| American Indian | 0.1% | 0.1% | 0.5% |
| Asian | 19.6% | 7.0% | 5.7% |
| Hawaiian | 0.0% | 0.0% | 0.2% |
| Other | 0.7% | 1.1% | 0.5% |
| Two Or More | 5.4% | 4.5% | 3.9% |
| Hispanic | 9.0% | 12.9% | 19.0% |
Gender in Cambridge
Cambridge is 50.1% female with 59,042 female residents.
Cambridge is 49.9% male with 58,752 male residents.
| Gender | Cambridge | MA | USA |
|---|---|---|---|
| Female | 50.1% | 51.1% | 50.5% |
| Male | 49.9% | 48.9% | 49.5% |
Highest level of educational attainment in Cambridge for adults over 25
2.0% of adults in Cambridge completed < 9th grade.
2.0% of adults in Cambridge completed 9-12th grade.
6.0% of adults in Cambridge completed high school / ged.
7.0% of adults in Cambridge completed some college.
2.0% of adults in Cambridge completed associate's degree.
30.0% of adults in Cambridge completed bachelor's degree.
28.0% of adults in Cambridge completed master's degree.
7.0% of adults in Cambridge completed professional degree.
16.0% of adults in Cambridge completed doctorate degree.
| Education | Cambridge | MA | USA |
|---|---|---|---|
| < 9th Grade | 2.0% | 5.0% | 5.0% |
| 9-12th Grade | 2.0% | 4.0% | 6.0% |
| High School / GED | 6.0% | 23.0% | 26.0% |
| Some College | 7.0% | 14.0% | 19.0% |
| Associate's Degree | 2.0% | 8.0% | 9.0% |
| Bachelor's Degree | 30.0% | 25.0% | 21.0% |
| Master's Degree | 28.0% | 15.0% | 10.0% |
| Professional Degree | 7.0% | 3.0% | 2.0% |
| Doctorate Degree | 16.0% | 3.0% | 2.0% |
Household Income For Cambridge, Massachusetts
5.5% of households in Cambridge earn Less than $10,000.
2.8% of households in Cambridge earn $10,000 to $14,999.
4.7% of households in Cambridge earn $15,000 to $24,999.
2.8% of households in Cambridge earn $25,000 to $34,999.
5.4% of households in Cambridge earn $35,000 to $49,999.
9.5% of households in Cambridge earn $50,000 to $74,999.
10.1% of households in Cambridge earn $75,000 to $99,999.
16.0% of households in Cambridge earn $100,000 to $149,999.
12.9% of households in Cambridge earn $150,000 to $199,999.
30.2% of households in Cambridge earn $200,000 or more.
| Income | Cambridge | MA | USA |
|---|---|---|---|
| Less than $10,000 | 5.5% | 4.3% | 4.9% |
| $10,000 to $14,999 | 2.8% | 3.5% | 3.6% |
| $15,000 to $24,999 | 4.7% | 5.6% | 6.6% |
| $25,000 to $34,999 | 2.8% | 5.1% | 6.8% |
| $35,000 to $49,999 | 5.4% | 7.7% | 10.4% |
| $50,000 to $74,999 | 9.5% | 12.2% | 15.7% |
| $75,000 to $99,999 | 10.1% | 11.0% | 12.7% |
| $100,000 to $149,999 | 16.0% | 17.7% | 17.4% |
| $150,000 to $199,999 | 12.9% | 11.8% | 9.3% |
| $200,000 or more | 30.2% | 21.1% | 12.6% |


