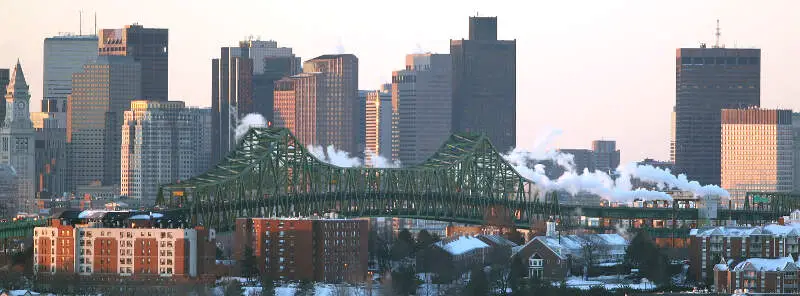
Chelsea, MA
Demographics And Statistics
Living In Chelsea, Massachusetts Summary
Life in Chelsea research summary. HomeSnacks has been using Saturday Night Science to research the quality of life in Chelsea over the past nine years using Census, FBI, Zillow, and other primary data sources. Based on the most recently available data, we found the following about life in Chelsea:
The population in Chelsea is 39,460.
The median home value in Chelsea is $525,717.
The median income in Chelsea is $72,220.
The cost of living in Chelsea is 141 which is 1.4x higher than the national average.
The median rent in Chelsea is $1,859.
The unemployment rate in Chelsea is 8.8%.
The poverty rate in Chelsea is 20.6%.
The average high in Chelsea is 59.0° and the average low is 42.1°.
Chelsea SnackAbility
Overall SnackAbility
Chelsea, MA Crime Report
Crime in Chelsea summary. We use data from the FBI to determine the crime rates in Chelsea. Key points include:
There were 925 total crimes in Chelsea in the last reporting year.
The overall crime rate per 100,000 people in Chelsea is 2,414.7 / 100k people.
The violent crime rate per 100,000 people in Chelsea is 978.9 / 100k people.
The property crime rate per 100,000 people in Chelsea is 1,435.8 / 100k people.
Overall, crime in Chelsea is 13.94% above the national average.
Total Crimes
Above National Average
Crime In Chelsea Comparison Table
| Statistic | Count Raw |
Chelsea / 100k People |
Massachusetts / 100k People |
National / 100k People |
|---|---|---|---|---|
| Total Crimes Per 100K | 925 | 2,414.7 | 1,426.8 | 2,119.2 |
| Violent Crime | 375 | 978.9 | 314.7 | 359.0 |
| Murder | 2 | 5.2 | 1.8 | 5.0 |
| Robbery | 46 | 120.1 | 36.0 | 61.0 |
| Aggravated Assault | 296 | 772.7 | 249.3 | 256.0 |
| Property Crime | 550 | 1,435.8 | 1,112.1 | 1,760.0 |
| Burglary | 57 | 148.8 | 130.3 | 229.0 |
| Larceny | 441 | 1,151.2 | 876.3 | 1,272.0 |
| Car Theft | 52 | 135.7 | 105.5 | 259.0 |
Chelsea, MA Cost Of Living
Cost of living in Chelsea summary. We use data on the cost of living to determine how expensive it is to live in Chelsea. Real estate prices drive most of the variance in cost of living around Massachusetts. Key points include:
The cost of living in Chelsea is 141 with 100 being average.
The cost of living in Chelsea is 1.4x higher than the national average.
The median home value in Chelsea is $525,717.
The median income in Chelsea is $72,220.
Chelsea's Overall Cost Of Living
Higher Than The National Average
Cost Of Living In Chelsea Comparison Table
| Living Expense | Chelsea | Massachusetts | National Average | |
|---|---|---|---|---|
| Overall | 141 | 134 | 100 | |
| Services | 120 | 121 | 100 | |
| Groceries | 106 | 106 | 100 | |
| Health | 113 | 112 | 100 | |
| Housing | 185 | 164 | 100 | |
| Transportation | 119 | 120 | 100 | |
| Utilities | 132 | 136 | 100 | |
Chelsea, MA Weather
The average high in Chelsea is 59.0° and the average low is 42.1°.
There are 76.2 days of precipitation each year.
Expect an average of 47.2 inches of precipitation each year with 45.6 inches of snow.
| Stat | Chelsea |
|---|---|
| Average Annual High | 59.0 |
| Average Annual Low | 42.1 |
| Annual Precipitation Days | 76.2 |
| Average Annual Precipitation | 47.2 |
| Average Annual Snowfall | 45.6 |
Average High
Days of Rain
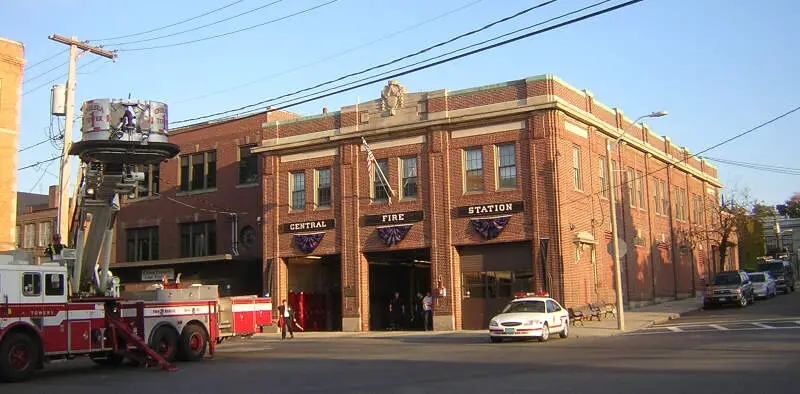
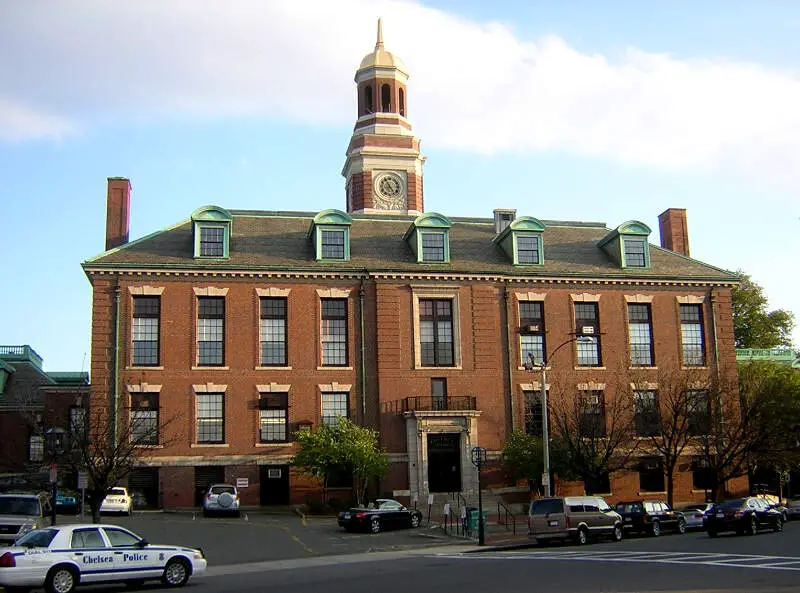
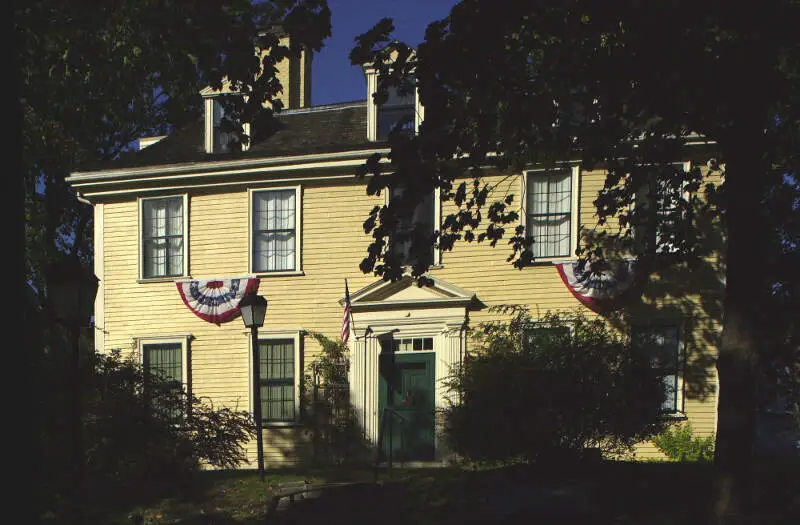
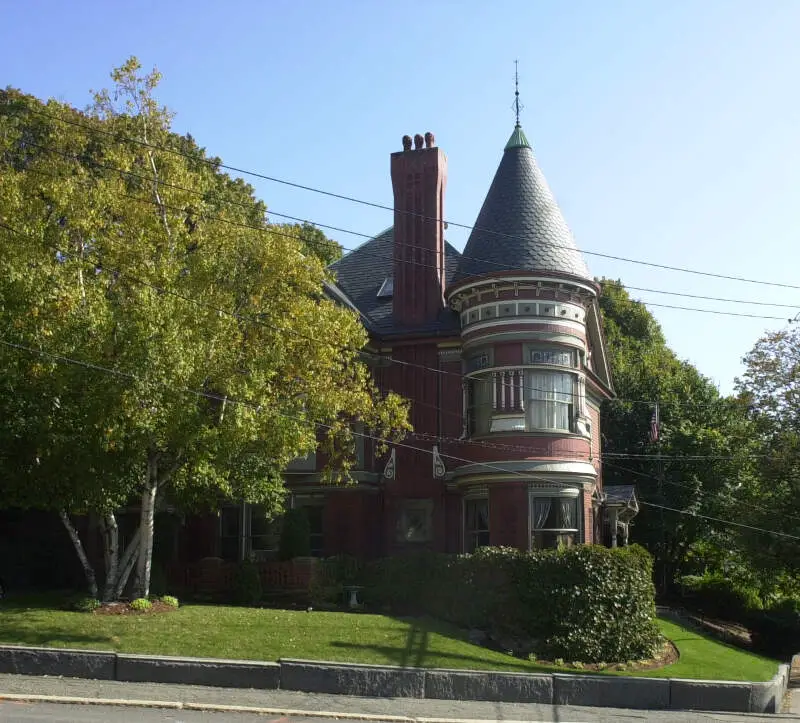
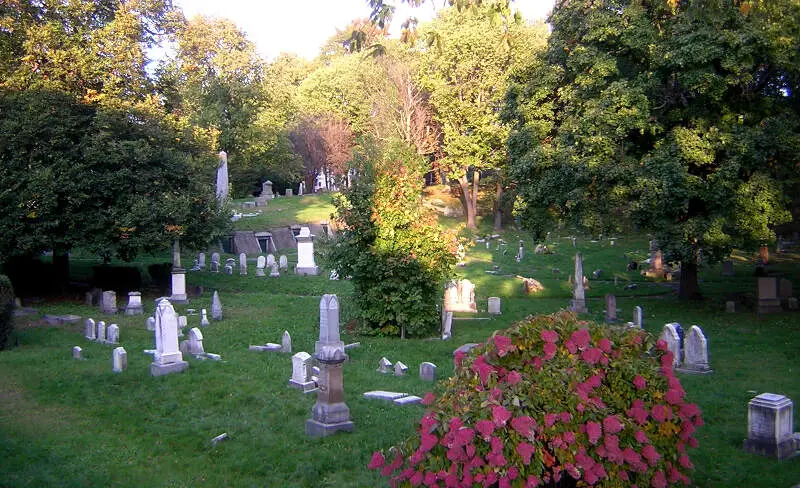
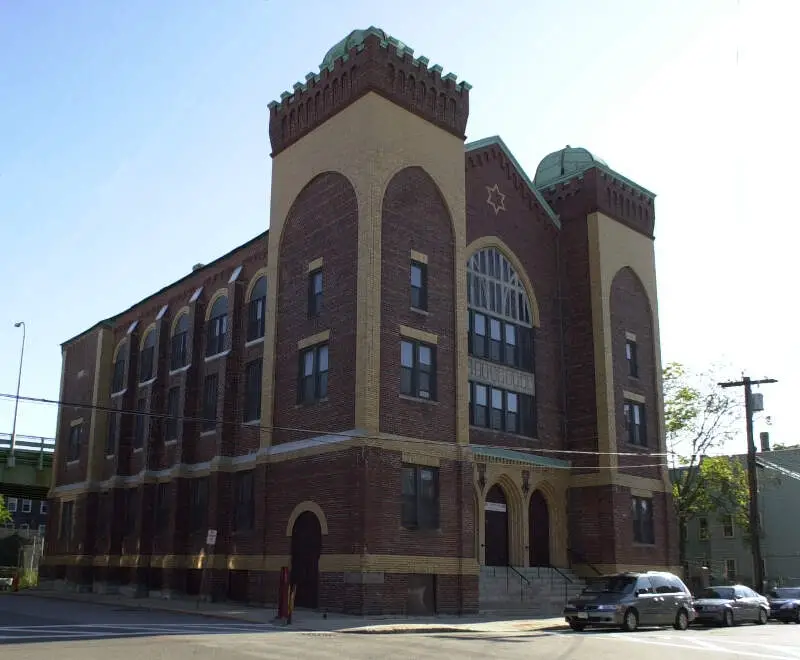
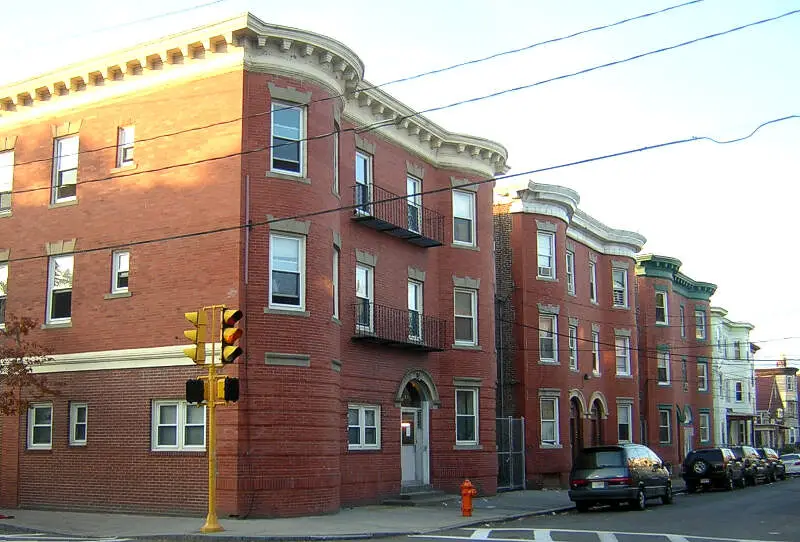
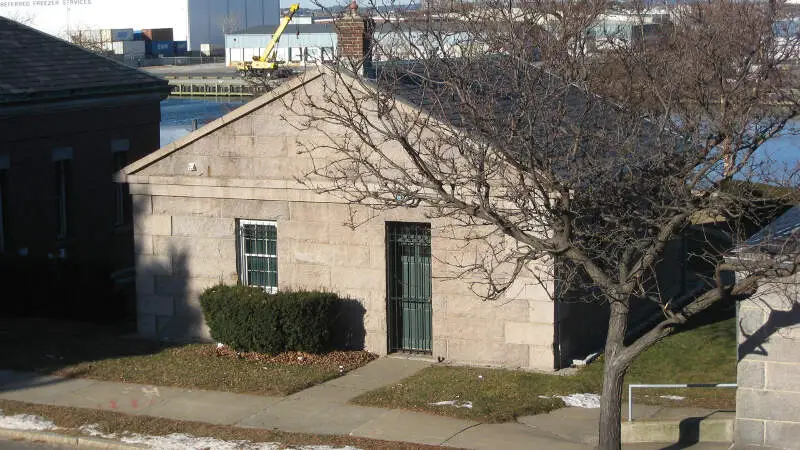
Chelsea, MA Photos
2 Reviews & Comments About Chelsea
/5

lbd sunny - None
I live in Chelsea and grew up in the revere projects one city away I hate this place my boyfriend has lived in Chelsea his whole life and a few summers ago his old friend from high school who lived across the street from him was sitting on his porch with his brother and right in front of him ms-13 came up and shot his brother in the head and then ran they eventually caught both of them and when asked why they killed him they said mistaken identity needless to say his family moved the only reason I'm still here is because I can't find a cheaper apartment
Sarai Rojano - None
I live in Chelsea all my life and it's very calm you don't know just cause you search up in google dont mean it's true Chelsea has grown so much and I disagree
Rankings for Chelsea in Massachusetts


Locations Around Chelsea
Map Of Chelsea, MA
Best Places Around Chelsea
Lexington, MA
Population 34,085
Wellesley, MA
Population 29,906
Marblehead, MA
Population 20,334
Needham, MA
Population 32,059
Newton, MA
Population 88,504
Winchester, MA
Population 22,862
Reading, MA
Population 25,448
Cochituate, MA
Population 6,688
Brookline, MA
Population 62,822
Pinehurst, MA
Population 6,737
Chelsea Demographics And Statistics
Population over time in Chelsea
The current population in Chelsea is 39,460. The population has increased 14.3% from 2010.
| Year | Population | % Change |
|---|---|---|
| 2023 | 39,460 | -1.1% |
| 2022 | 39,890 | -0.3% |
| 2021 | 40,025 | 0.4% |
| 2020 | 39,878 | -0.3% |
| 2019 | 39,992 | 0.4% |
| 2018 | 39,852 | 1.5% |
| 2017 | 39,272 | 2.7% |
| 2016 | 38,244 | 1.8% |
| 2015 | 37,581 | 1.3% |
| 2014 | 37,084 | 2.4% |
| 2013 | 36,222 | 2.0% |
| 2012 | 35,527 | 1.9% |
| 2011 | 34,872 | 1.0% |
| 2010 | 34,532 | - |
Race / Ethnicity in Chelsea
Chelsea is:
19.5% White with 7,710 White residents.
6.2% African American with 2,456 African American residents.
0.0% American Indian with 0 American Indian residents.
2.9% Asian with 1,142 Asian residents.
0.0% Hawaiian with 0 Hawaiian residents.
0.8% Other with 317 Other residents.
5.6% Two Or More with 2,198 Two Or More residents.
65.0% Hispanic with 25,637 Hispanic residents.
| Race | Chelsea | MA | USA |
|---|---|---|---|
| White | 19.5% | 67.8% | 58.2% |
| African American | 6.2% | 6.5% | 12.0% |
| American Indian | 0.0% | 0.1% | 0.5% |
| Asian | 2.9% | 7.0% | 5.7% |
| Hawaiian | 0.0% | 0.0% | 0.2% |
| Other | 0.8% | 1.1% | 0.5% |
| Two Or More | 5.6% | 4.5% | 3.9% |
| Hispanic | 65.0% | 12.9% | 19.0% |
Gender in Chelsea
Chelsea is 49.6% female with 19,568 female residents.
Chelsea is 50.4% male with 19,891 male residents.
| Gender | Chelsea | MA | USA |
|---|---|---|---|
| Female | 49.6% | 51.1% | 50.5% |
| Male | 50.4% | 48.9% | 49.5% |
Highest level of educational attainment in Chelsea for adults over 25
22.0% of adults in Chelsea completed < 9th grade.
10.0% of adults in Chelsea completed 9-12th grade.
31.0% of adults in Chelsea completed high school / ged.
12.0% of adults in Chelsea completed some college.
4.0% of adults in Chelsea completed associate's degree.
14.0% of adults in Chelsea completed bachelor's degree.
5.0% of adults in Chelsea completed master's degree.
1.0% of adults in Chelsea completed professional degree.
1.0% of adults in Chelsea completed doctorate degree.
| Education | Chelsea | MA | USA |
|---|---|---|---|
| < 9th Grade | 22.0% | 5.0% | 5.0% |
| 9-12th Grade | 10.0% | 4.0% | 6.0% |
| High School / GED | 31.0% | 23.0% | 26.0% |
| Some College | 12.0% | 14.0% | 19.0% |
| Associate's Degree | 4.0% | 8.0% | 9.0% |
| Bachelor's Degree | 14.0% | 25.0% | 21.0% |
| Master's Degree | 5.0% | 15.0% | 10.0% |
| Professional Degree | 1.0% | 3.0% | 2.0% |
| Doctorate Degree | 1.0% | 3.0% | 2.0% |
Household Income For Chelsea, Massachusetts
8.5% of households in Chelsea earn Less than $10,000.
6.8% of households in Chelsea earn $10,000 to $14,999.
6.9% of households in Chelsea earn $15,000 to $24,999.
6.5% of households in Chelsea earn $25,000 to $34,999.
9.7% of households in Chelsea earn $35,000 to $49,999.
13.8% of households in Chelsea earn $50,000 to $74,999.
12.8% of households in Chelsea earn $75,000 to $99,999.
17.8% of households in Chelsea earn $100,000 to $149,999.
9.8% of households in Chelsea earn $150,000 to $199,999.
7.3% of households in Chelsea earn $200,000 or more.
| Income | Chelsea | MA | USA |
|---|---|---|---|
| Less than $10,000 | 8.5% | 4.3% | 4.9% |
| $10,000 to $14,999 | 6.8% | 3.5% | 3.6% |
| $15,000 to $24,999 | 6.9% | 5.6% | 6.6% |
| $25,000 to $34,999 | 6.5% | 5.1% | 6.8% |
| $35,000 to $49,999 | 9.7% | 7.7% | 10.4% |
| $50,000 to $74,999 | 13.8% | 12.2% | 15.7% |
| $75,000 to $99,999 | 12.8% | 11.0% | 12.7% |
| $100,000 to $149,999 | 17.8% | 17.7% | 17.4% |
| $150,000 to $199,999 | 9.8% | 11.8% | 9.3% |
| $200,000 or more | 7.3% | 21.1% | 12.6% |


