Lawrence, MA
Demographics And Statistics
Living In Lawrence, Massachusetts Summary
Life in Lawrence research summary. HomeSnacks has been using Saturday Night Science to research the quality of life in Lawrence over the past nine years using Census, FBI, Zillow, and other primary data sources. Based on the most recently available data, we found the following about life in Lawrence:
The population in Lawrence is 88,297.
The median home value in Lawrence is $500,341.
The median income in Lawrence is $57,903.
The cost of living in Lawrence is 129 which is 1.3x higher than the national average.
The median rent in Lawrence is $1,569.
The unemployment rate in Lawrence is 8.7%.
The poverty rate in Lawrence is 18.2%.
The average high in Lawrence is 59.3° and the average low is 38.5°.
Lawrence SnackAbility
Overall SnackAbility
Lawrence, MA Crime Report
Crime in Lawrence summary. We use data from the FBI to determine the crime rates in Lawrence. Key points include:
There were 1,289 total crimes in Lawrence in the last reporting year.
The overall crime rate per 100,000 people in Lawrence is 1,438.6 / 100k people.
The violent crime rate per 100,000 people in Lawrence is 439.7 / 100k people.
The property crime rate per 100,000 people in Lawrence is 998.9 / 100k people.
Overall, crime in Lawrence is -32.12% below the national average.
Total Crimes
Below National Average
Crime In Lawrence Comparison Table
| Statistic | Count Raw |
Lawrence / 100k People |
Massachusetts / 100k People |
National / 100k People |
|---|---|---|---|---|
| Total Crimes Per 100K | 1,289 | 1,438.6 | 1,426.8 | 2,119.2 |
| Violent Crime | 394 | 439.7 | 314.7 | 359.0 |
| Murder | 7 | 7.8 | 1.8 | 5.0 |
| Robbery | 47 | 52.5 | 36.0 | 61.0 |
| Aggravated Assault | 312 | 348.2 | 249.3 | 256.0 |
| Property Crime | 895 | 998.9 | 1,112.1 | 1,760.0 |
| Burglary | 65 | 72.5 | 130.3 | 229.0 |
| Larceny | 763 | 851.6 | 876.3 | 1,272.0 |
| Car Theft | 67 | 74.8 | 105.5 | 259.0 |
Lawrence, MA Cost Of Living
Cost of living in Lawrence summary. We use data on the cost of living to determine how expensive it is to live in Lawrence. Real estate prices drive most of the variance in cost of living around Massachusetts. Key points include:
The cost of living in Lawrence is 129 with 100 being average.
The cost of living in Lawrence is 1.3x higher than the national average.
The median home value in Lawrence is $500,341.
The median income in Lawrence is $57,903.
Lawrence's Overall Cost Of Living
Higher Than The National Average
Cost Of Living In Lawrence Comparison Table
| Living Expense | Lawrence | Massachusetts | National Average | |
|---|---|---|---|---|
| Overall | 129 | 134 | 100 | |
| Services | 121 | 121 | 100 | |
| Groceries | 103 | 106 | 100 | |
| Health | 112 | 112 | 100 | |
| Housing | 143 | 164 | 100 | |
| Transportation | 117 | 120 | 100 | |
| Utilities | 136 | 136 | 100 | |
Lawrence, MA Weather
The average high in Lawrence is 59.3° and the average low is 38.5°.
There are 82.5 days of precipitation each year.
Expect an average of 47.0 inches of precipitation each year with 54.3 inches of snow.
| Stat | Lawrence |
|---|---|
| Average Annual High | 59.3 |
| Average Annual Low | 38.5 |
| Annual Precipitation Days | 82.5 |
| Average Annual Precipitation | 47.0 |
| Average Annual Snowfall | 54.3 |
Average High
Days of Rain
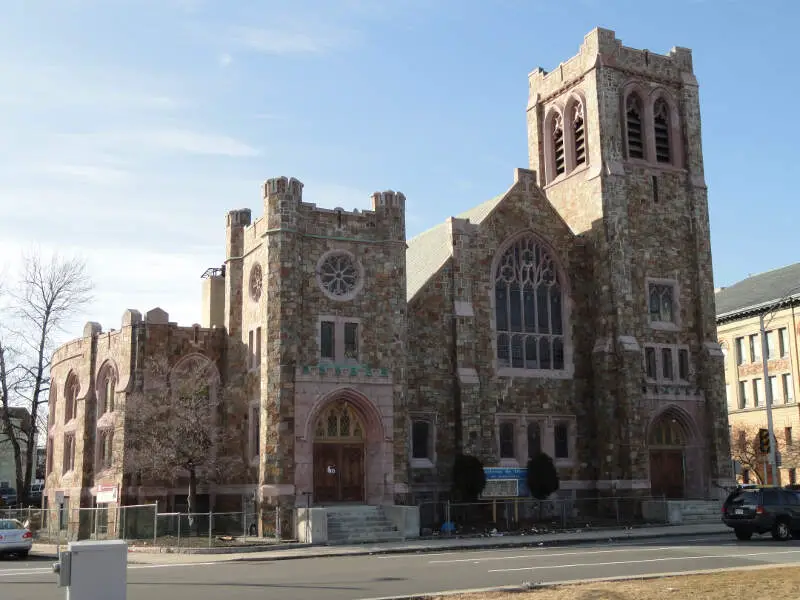
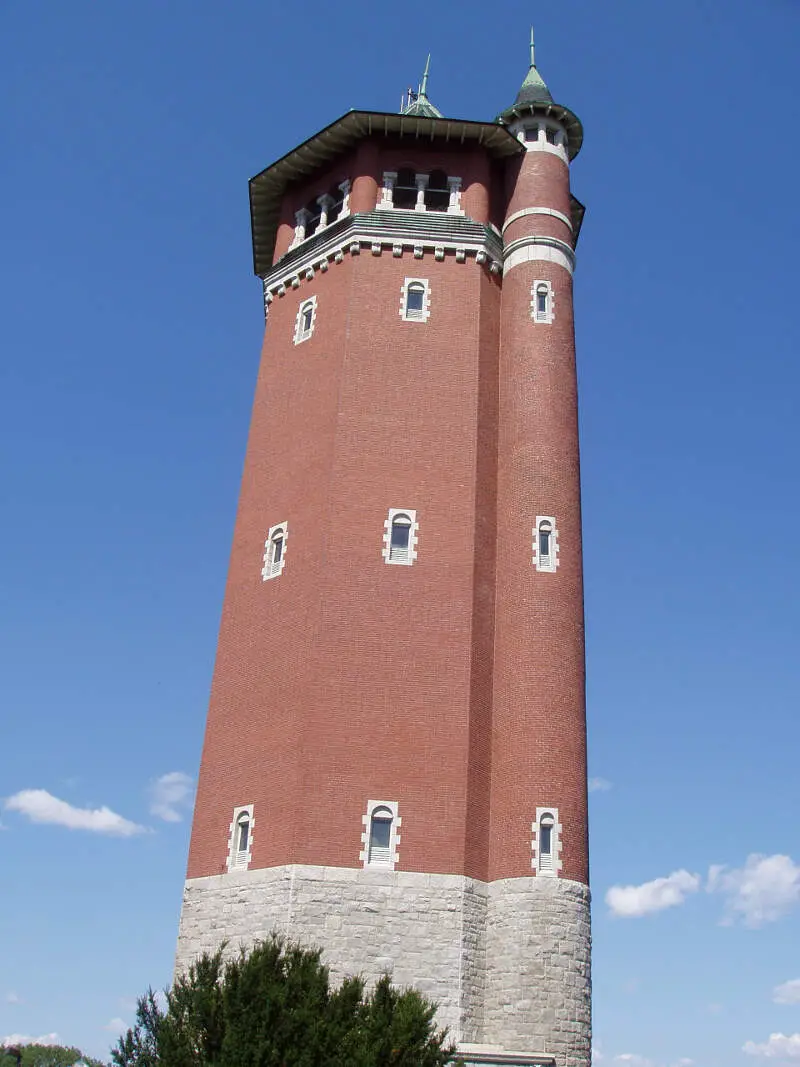
Lawrence, MA Photos
3 Reviews & Comments About Lawrence
/5

Im Back - None
I've lived in Lawrence since 1989 and by no means do I feel unsafe or too scare to walk anywhere. I am a father and a husband. Own my own house and well aducated. Yes a few diplomas and a well paying job.
I can honestly say that Lawrence is not the best city but the way people talk about Lawrence makes me sick. Every day I wake up and tune in to local news. Doesn't matter what channel I have on, there's always a minimum of 2 to 3 shooting or stabbings in Boston. In most cases there are a few killed, LIKE EVERY DAY!!!!
In Lawrence on the other hand we might hear of a murder maybe once every 2 months or 3.
Yes I know that welfare is off the chart and this certainly needs to be addressed. But over all Lawrence IS NOT AS BAD AS PEOPLE PAINT IT.... if so I would not have lived here for 28 years. And by no means would I raise my kids in this city.
My kids attend one of the highest ranked schools in the state and is by far one of the best in education and nurturing kids for a bright future.
evog35viii - None
I lived in Lawrence majority of my life and all I got to say is: what about Lowell and Lynn- They're just as bad. Haverhill's getting up there too really fast.
Bambo491 - None
I live in lawrence and it not that bad. Im still alive
Rankings for Lawrence in Massachusetts


Locations Around Lawrence
Map Of Lawrence, MA
Best Places Around Lawrence
Lexington, MA
Population 34,085
Winchester, MA
Population 22,862
Reading, MA
Population 25,448
Pinehurst, MA
Population 6,737
Arlington, MA
Population 46,015
Melrose, MA
Population 29,488
Andover, MA
Population 9,261
Newburyport, MA
Population 18,444
Burlington, MA
Population 26,223
Wakefield, MA
Population 27,284
Lawrence Demographics And Statistics
Population over time in Lawrence
The current population in Lawrence is 88,297. The population has increased 17.5% from 2010.
| Year | Population | % Change |
|---|---|---|
| 2023 | 88,297 | 0.3% |
| 2022 | 88,067 | 0.3% |
| 2021 | 87,798 | 9.7% |
| 2020 | 80,022 | 0.1% |
| 2019 | 79,942 | 0.1% |
| 2018 | 79,841 | 0.4% |
| 2017 | 79,497 | 0.2% |
| 2016 | 79,337 | 0.7% |
| 2015 | 78,804 | 1.9% |
| 2014 | 77,364 | 0.7% |
| 2013 | 76,820 | 0.6% |
| 2012 | 76,331 | 0.8% |
| 2011 | 75,761 | 0.8% |
| 2010 | 75,177 | - |
Race / Ethnicity in Lawrence
Lawrence is:
12.6% White with 11,094 White residents.
2.1% African American with 1,838 African American residents.
0.0% American Indian with 16 American Indian residents.
1.7% Asian with 1,486 Asian residents.
0.0% Hawaiian with 0 Hawaiian residents.
0.6% Other with 512 Other residents.
0.8% Two Or More with 723 Two Or More residents.
82.3% Hispanic with 72,628 Hispanic residents.
| Race | Lawrence | MA | USA |
|---|---|---|---|
| White | 12.6% | 67.8% | 58.2% |
| African American | 2.1% | 6.5% | 12.0% |
| American Indian | 0.0% | 0.1% | 0.5% |
| Asian | 1.7% | 7.0% | 5.7% |
| Hawaiian | 0.0% | 0.0% | 0.2% |
| Other | 0.6% | 1.1% | 0.5% |
| Two Or More | 0.8% | 4.5% | 3.9% |
| Hispanic | 82.3% | 12.9% | 19.0% |
Gender in Lawrence
Lawrence is 50.7% female with 44,808 female residents.
Lawrence is 49.3% male with 43,489 male residents.
| Gender | Lawrence | MA | USA |
|---|---|---|---|
| Female | 50.7% | 51.1% | 50.5% |
| Male | 49.3% | 48.9% | 49.5% |
Highest level of educational attainment in Lawrence for adults over 25
14.0% of adults in Lawrence completed < 9th grade.
12.0% of adults in Lawrence completed 9-12th grade.
35.0% of adults in Lawrence completed high school / ged.
17.0% of adults in Lawrence completed some college.
5.0% of adults in Lawrence completed associate's degree.
12.0% of adults in Lawrence completed bachelor's degree.
4.0% of adults in Lawrence completed master's degree.
1.0% of adults in Lawrence completed professional degree.
0.0% of adults in Lawrence completed doctorate degree.
| Education | Lawrence | MA | USA |
|---|---|---|---|
| < 9th Grade | 14.0% | 5.0% | 5.0% |
| 9-12th Grade | 12.0% | 4.0% | 6.0% |
| High School / GED | 35.0% | 23.0% | 26.0% |
| Some College | 17.0% | 14.0% | 19.0% |
| Associate's Degree | 5.0% | 8.0% | 9.0% |
| Bachelor's Degree | 12.0% | 25.0% | 21.0% |
| Master's Degree | 4.0% | 15.0% | 10.0% |
| Professional Degree | 1.0% | 3.0% | 2.0% |
| Doctorate Degree | 0.0% | 3.0% | 2.0% |
Household Income For Lawrence, Massachusetts
4.9% of households in Lawrence earn Less than $10,000.
8.6% of households in Lawrence earn $10,000 to $14,999.
8.9% of households in Lawrence earn $15,000 to $24,999.
8.1% of households in Lawrence earn $25,000 to $34,999.
12.7% of households in Lawrence earn $35,000 to $49,999.
18.4% of households in Lawrence earn $50,000 to $74,999.
12.3% of households in Lawrence earn $75,000 to $99,999.
14.9% of households in Lawrence earn $100,000 to $149,999.
6.2% of households in Lawrence earn $150,000 to $199,999.
5.0% of households in Lawrence earn $200,000 or more.
| Income | Lawrence | MA | USA |
|---|---|---|---|
| Less than $10,000 | 4.9% | 4.3% | 4.9% |
| $10,000 to $14,999 | 8.6% | 3.5% | 3.6% |
| $15,000 to $24,999 | 8.9% | 5.6% | 6.6% |
| $25,000 to $34,999 | 8.1% | 5.1% | 6.8% |
| $35,000 to $49,999 | 12.7% | 7.7% | 10.4% |
| $50,000 to $74,999 | 18.4% | 12.2% | 15.7% |
| $75,000 to $99,999 | 12.3% | 11.0% | 12.7% |
| $100,000 to $149,999 | 14.9% | 17.7% | 17.4% |
| $150,000 to $199,999 | 6.2% | 11.8% | 9.3% |
| $200,000 or more | 5.0% | 21.1% | 12.6% |


