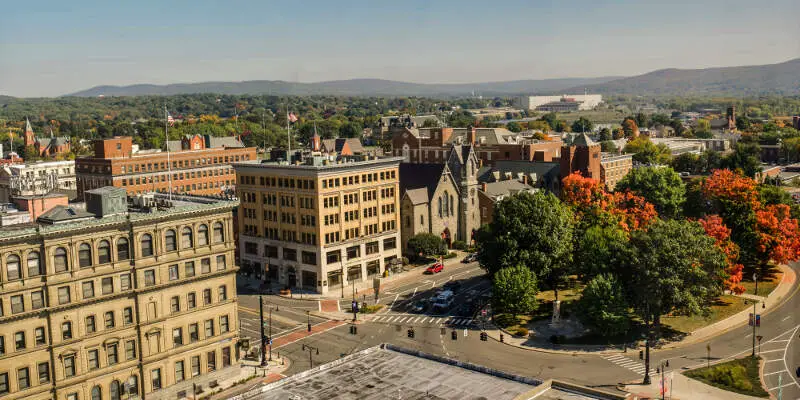
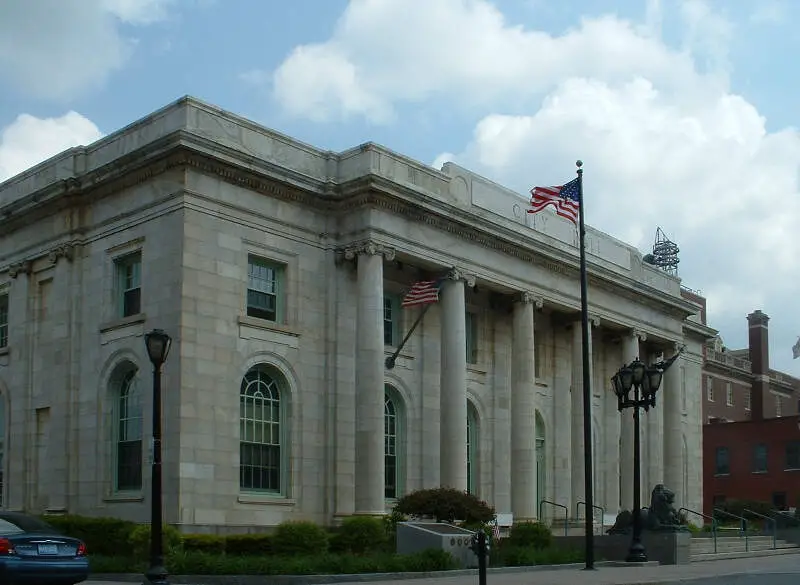
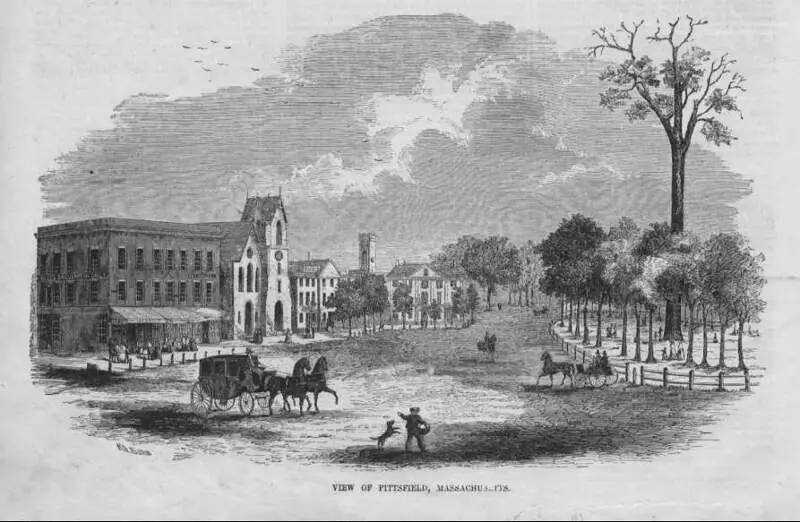
Pittsfield, MA
Demographics And Statistics
Living In Pittsfield, Massachusetts Summary
Life in Pittsfield research summary. HomeSnacks has been using Saturday Night Science to research the quality of life in Pittsfield over the past nine years using Census, FBI, Zillow, and other primary data sources. Based on the most recently available data, we found the following about life in Pittsfield:
The population in Pittsfield is 43,559.
The median home value in Pittsfield is $305,778.
The median income in Pittsfield is $68,386.
The cost of living in Pittsfield is 102 which is 1.0x higher than the national average.
The median rent in Pittsfield is $1,094.
The unemployment rate in Pittsfield is 7.6%.
The poverty rate in Pittsfield is 13.6%.
The average high in Pittsfield is 56.7° and the average low is 34.8°.
Pittsfield SnackAbility
Overall SnackAbility
Pittsfield, MA Crime Report
Crime in Pittsfield summary. We use data from the FBI to determine the crime rates in Pittsfield. Key points include:
There were 750 total crimes in Pittsfield in the last reporting year.
The overall crime rate per 100,000 people in Pittsfield is 1,750.9 / 100k people.
The violent crime rate per 100,000 people in Pittsfield is 511.3 / 100k people.
The property crime rate per 100,000 people in Pittsfield is 1,239.6 / 100k people.
Overall, crime in Pittsfield is -17.38% below the national average.
Total Crimes
Below National Average
Crime In Pittsfield Comparison Table
| Statistic | Count Raw |
Pittsfield / 100k People |
Massachusetts / 100k People |
National / 100k People |
|---|---|---|---|---|
| Total Crimes Per 100K | 750 | 1,750.9 | 1,426.8 | 2,119.2 |
| Violent Crime | 219 | 511.3 | 314.7 | 359.0 |
| Murder | 2 | 4.7 | 1.8 | 5.0 |
| Robbery | 12 | 28.0 | 36.0 | 61.0 |
| Aggravated Assault | 163 | 380.5 | 249.3 | 256.0 |
| Property Crime | 531 | 1,239.6 | 1,112.1 | 1,760.0 |
| Burglary | 165 | 385.2 | 130.3 | 229.0 |
| Larceny | 324 | 756.4 | 876.3 | 1,272.0 |
| Car Theft | 42 | 98.1 | 105.5 | 259.0 |
Pittsfield, MA Cost Of Living
Cost of living in Pittsfield summary. We use data on the cost of living to determine how expensive it is to live in Pittsfield. Real estate prices drive most of the variance in cost of living around Massachusetts. Key points include:
The cost of living in Pittsfield is 102 with 100 being average.
The cost of living in Pittsfield is 1.0x higher than the national average.
The median home value in Pittsfield is $305,778.
The median income in Pittsfield is $68,386.
Pittsfield's Overall Cost Of Living
Higher Than The National Average
Cost Of Living In Pittsfield Comparison Table
| Living Expense | Pittsfield | Massachusetts | National Average | |
|---|---|---|---|---|
| Overall | 102 | 134 | 100 | |
| Services | 108 | 121 | 100 | |
| Groceries | 104 | 106 | 100 | |
| Health | 94 | 112 | 100 | |
| Housing | 95 | 164 | 100 | |
| Transportation | 95 | 120 | 100 | |
| Utilities | 104 | 136 | 100 | |
Pittsfield, MA Weather
The average high in Pittsfield is 56.7° and the average low is 34.8°.
There are 85.5 days of precipitation each year.
Expect an average of 44.4 inches of precipitation each year with 64.6 inches of snow.
| Stat | Pittsfield |
|---|---|
| Average Annual High | 56.7 |
| Average Annual Low | 34.8 |
| Annual Precipitation Days | 85.5 |
| Average Annual Precipitation | 44.4 |
| Average Annual Snowfall | 64.6 |
Average High
Days of Rain
Pittsfield, MA Photos
1 Reviews & Comments About Pittsfield
/5

HomeSnacks User - 2019-05-30 18:51:36.825012
Pittsfield used to be a booming place at one point in time! That was before General Electric closed its doors and put thousands of people without jobs. Then KB Toys closed their headquarters in Pittsfield again putting thousands of people without a job, Rices Silk Mill again the same thing!!! Now Pittsfield has turned into a Drug Dealers Paradise.. Pittsfield has become the centerpiece for Gangs and Drug Dealers!! They built all those "Low income" Housing buildings instead of bringing in job and companies to build the city up they built low income housing, 3 suboxone clinics, 2 Methadone clinics, and who can forget about the fact that there is a Bars and/or Bank pretty much on every single corner!! Got to have those kinds of places for people to deposit their welfare checks, SSI checks and Drug money right.. Got to have a bar on every corner so that the dealers have a place to deal!! Gee even One of Zen Pubs Bartenders will even sniff coke with you in the bathroom!!! Pittsfield has gone down hill so bad it is not a place to raise a family anymore and that is to bad because it used to be a beautiful place to live! Now it's like the Walking Dead at night, people overdosing on H****n every single day!! Drunks, Hookers and Drug Dealers up and down North St and First St it is a crying shame how bad that have let Pittsfield go.. and very sad!! WAKE UP CITY OFFICIALS CLEAN THE CITY UP IT IS TURNING IN TO A C**P HOLE!!!!!
There is a bar or a bank on every corner!! Drunks, hookers, and Drug Dealers everywhere! Looking to score walk up and down North St, First St. Cumberland Farms Parking like, All Town Parking Lot ect. Go on Tyler St to Zens Pub! There a bartender or two in there that will even do a line of coke or two in the bathroom with you.. If you're a guy you might even get more than that.. It is sad and disgusting how bad Pittsfield has gotten! Definitely getting out of here SOON!!!!
Rankings for Pittsfield in Massachusetts


Locations Around Pittsfield
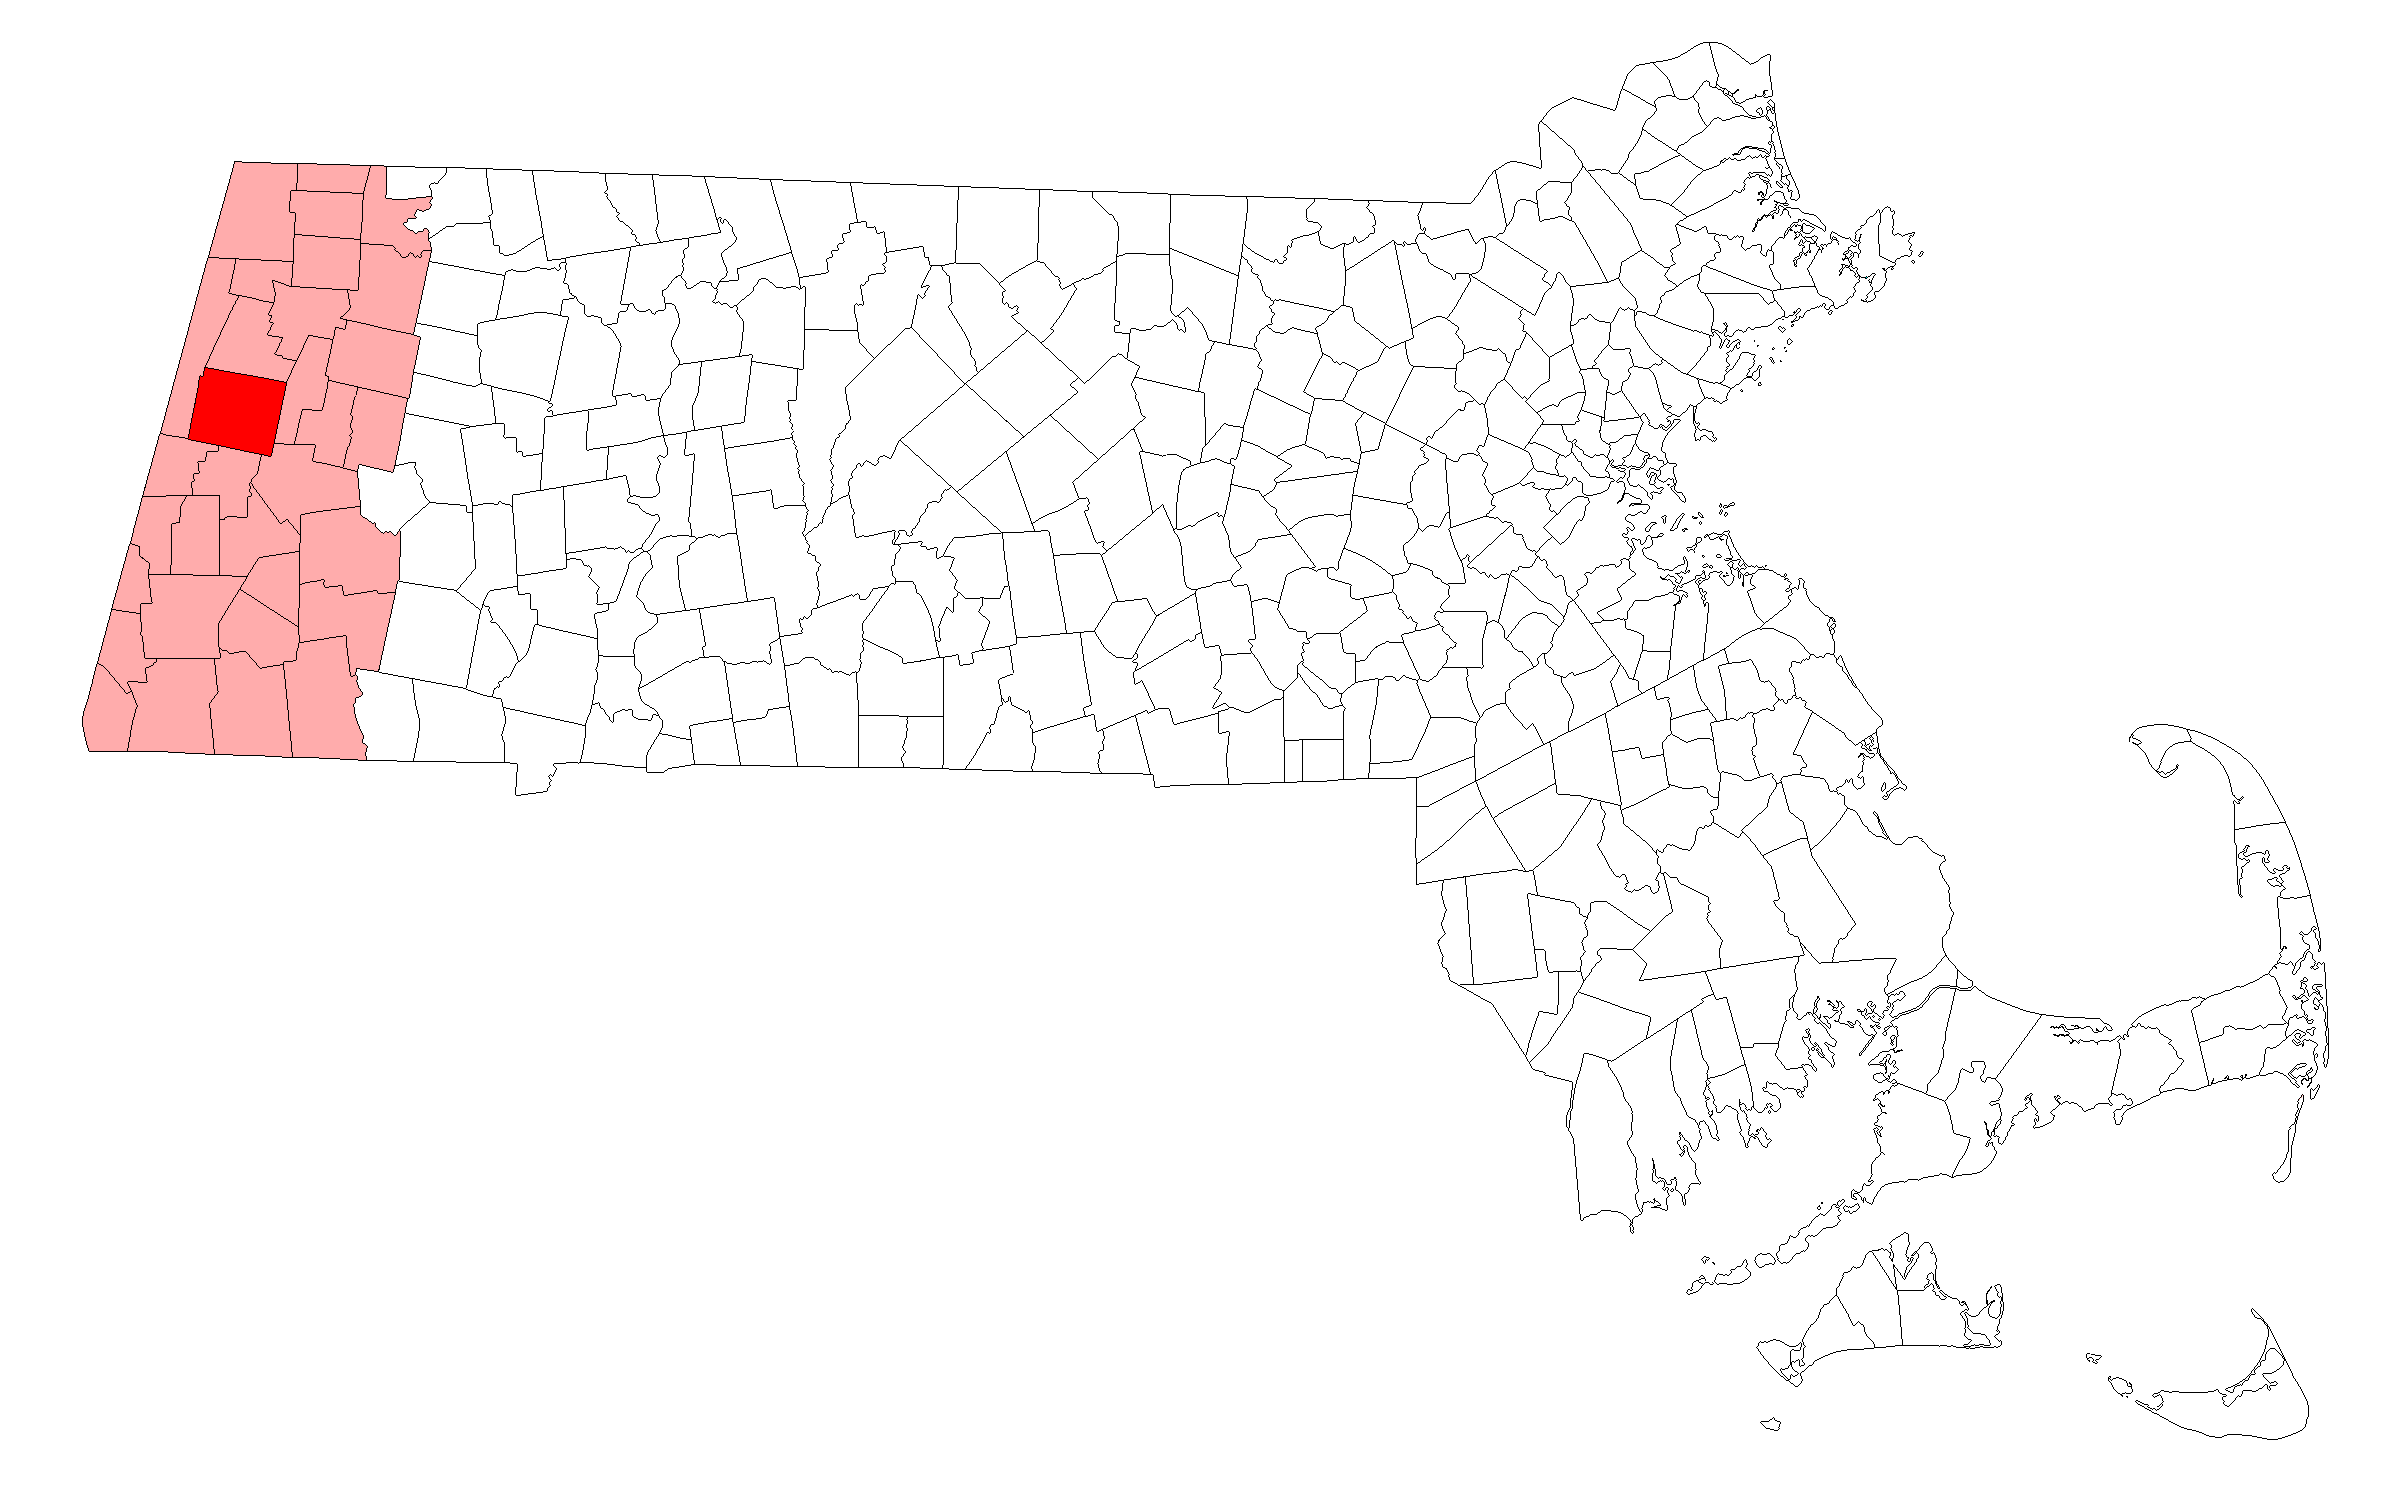
Map Of Pittsfield, MA
Best Places Around Pittsfield
Colonie, NY
Population 7,705
Niskayuna, NY
Population 20,774
Westmere, NY
Population 7,616
Sherwood Manor, CT
Population 5,781
Southwood Acres, CT
Population 8,154
Windsor Locks, CT
Population 12,555
Cohoes, NY
Population 18,043
Greenville, OH
Population 12,748
Hazardville, CT
Population 6,482
Pittsfield Demographics And Statistics
Population over time in Pittsfield
The current population in Pittsfield is 43,559. The population has decreased -2.7% from 2010.
| Year | Population | % Change |
|---|---|---|
| 2023 | 43,559 | -0.4% |
| 2022 | 43,730 | -0.4% |
| 2021 | 43,890 | 3.2% |
| 2020 | 42,514 | -0.6% |
| 2019 | 42,766 | -0.7% |
| 2018 | 43,058 | -0.5% |
| 2017 | 43,289 | -0.8% |
| 2016 | 43,632 | -0.7% |
| 2015 | 43,926 | -0.7% |
| 2014 | 44,226 | -0.5% |
| 2013 | 44,431 | -0.2% |
| 2012 | 44,542 | -0.3% |
| 2011 | 44,691 | -0.2% |
| 2010 | 44,788 | - |
Race / Ethnicity in Pittsfield
Pittsfield is:
77.4% White with 33,723 White residents.
4.8% African American with 2,109 African American residents.
0.0% American Indian with 13 American Indian residents.
1.4% Asian with 612 Asian residents.
0.0% Hawaiian with 0 Hawaiian residents.
0.4% Other with 163 Other residents.
6.9% Two Or More with 3,024 Two Or More residents.
9.0% Hispanic with 3,915 Hispanic residents.
| Race | Pittsfield | MA | USA |
|---|---|---|---|
| White | 77.4% | 67.8% | 58.2% |
| African American | 4.8% | 6.5% | 12.0% |
| American Indian | 0.0% | 0.1% | 0.5% |
| Asian | 1.4% | 7.0% | 5.7% |
| Hawaiian | 0.0% | 0.0% | 0.2% |
| Other | 0.4% | 1.1% | 0.5% |
| Two Or More | 6.9% | 4.5% | 3.9% |
| Hispanic | 9.0% | 12.9% | 19.0% |
Gender in Pittsfield
Pittsfield is 50.1% female with 21,835 female residents.
Pittsfield is 49.9% male with 21,724 male residents.
| Gender | Pittsfield | MA | USA |
|---|---|---|---|
| Female | 50.1% | 51.1% | 50.5% |
| Male | 49.9% | 48.9% | 49.5% |
Highest level of educational attainment in Pittsfield for adults over 25
3.0% of adults in Pittsfield completed < 9th grade.
5.0% of adults in Pittsfield completed 9-12th grade.
29.0% of adults in Pittsfield completed high school / ged.
19.0% of adults in Pittsfield completed some college.
10.0% of adults in Pittsfield completed associate's degree.
20.0% of adults in Pittsfield completed bachelor's degree.
10.0% of adults in Pittsfield completed master's degree.
3.0% of adults in Pittsfield completed professional degree.
1.0% of adults in Pittsfield completed doctorate degree.
| Education | Pittsfield | MA | USA |
|---|---|---|---|
| < 9th Grade | 3.0% | 5.0% | 5.0% |
| 9-12th Grade | 5.0% | 4.0% | 6.0% |
| High School / GED | 29.0% | 23.0% | 26.0% |
| Some College | 19.0% | 14.0% | 19.0% |
| Associate's Degree | 10.0% | 8.0% | 9.0% |
| Bachelor's Degree | 20.0% | 25.0% | 21.0% |
| Master's Degree | 10.0% | 15.0% | 10.0% |
| Professional Degree | 3.0% | 3.0% | 2.0% |
| Doctorate Degree | 1.0% | 3.0% | 2.0% |
Household Income For Pittsfield, Massachusetts
4.7% of households in Pittsfield earn Less than $10,000.
4.2% of households in Pittsfield earn $10,000 to $14,999.
9.4% of households in Pittsfield earn $15,000 to $24,999.
7.6% of households in Pittsfield earn $25,000 to $34,999.
11.7% of households in Pittsfield earn $35,000 to $49,999.
17.2% of households in Pittsfield earn $50,000 to $74,999.
14.3% of households in Pittsfield earn $75,000 to $99,999.
17.3% of households in Pittsfield earn $100,000 to $149,999.
5.9% of households in Pittsfield earn $150,000 to $199,999.
7.7% of households in Pittsfield earn $200,000 or more.
| Income | Pittsfield | MA | USA |
|---|---|---|---|
| Less than $10,000 | 4.7% | 4.3% | 4.9% |
| $10,000 to $14,999 | 4.2% | 3.5% | 3.6% |
| $15,000 to $24,999 | 9.4% | 5.6% | 6.6% |
| $25,000 to $34,999 | 7.6% | 5.1% | 6.8% |
| $35,000 to $49,999 | 11.7% | 7.7% | 10.4% |
| $50,000 to $74,999 | 17.2% | 12.2% | 15.7% |
| $75,000 to $99,999 | 14.3% | 11.0% | 12.7% |
| $100,000 to $149,999 | 17.3% | 17.7% | 17.4% |
| $150,000 to $199,999 | 5.9% | 11.8% | 9.3% |
| $200,000 or more | 7.7% | 21.1% | 12.6% |


