Compare Detroit to…
Detroit SnackAbility
Overall SnackAbility
Crime in Detroit summary. We use data from the FBI to determine the crime rates in Detroit. Key points include:
There were 39,634 total crimes in Detroit in the last reporting year.
The overall crime rate per 100,000 people in Detroit is 6,086.6 / 100k people.
The violent crime rate per 100,000 people in Detroit is 1,781.3 / 100k people.
The property crime rate per 100,000 people in Detroit is 4,305.3 / 100k people.
Overall, crime in Detroit is 187.21% above the national average.
Total Crimes
Above National Average
Crime In Detroit Comparison Table
| Statistic | Count Raw |
Detroit / 100k People |
Michigan / 100k People |
National / 100k People |
|---|---|---|---|---|
| Total Crimes Per 100K | 39,634 | 6,086.6 | 1,813.2 | 2,119.2 |
| Violent Crime | 11,599 | 1,781.3 | 434.3 | 359.0 |
| Murder | 203 | 31.2 | 5.2 | 5.0 |
| Robbery | 1,195 | 183.5 | 31.3 | 61.0 |
| Aggravated Assault | 9,596 | 1,473.7 | 341.3 | 256.0 |
| Property Crime | 28,035 | 4,305.3 | 1,378.9 | 1,760.0 |
| Burglary | 4,578 | 703.0 | 184.2 | 229.0 |
| Larceny | 15,263 | 2,343.9 | 963.6 | 1,272.0 |
| Car Theft | 8,194 | 1,258.3 | 231.0 | 259.0 |
Source: FBI Uniform Crime Reporting (2024)
Cost of living in Detroit summary. We use data on the cost of living to determine how expensive it is to live in Detroit. Real estate prices drive most of the variance in cost of living around Michigan. Key points include:
The cost of living in Detroit is 83 with 100 being average.
The cost of living in Detroit is 0.8x lower than the national average.
The median home value in Detroit is $75,357.
The median income in Detroit is $39,938.
Detroit's Overall Cost Of Living
Lower Than The National Average
Cost Of Living In Detroit Comparison Table
| Living Expense | Detroit | Michigan | National Average |
|---|---|---|---|
| Overall | 83 | 91 | 100 |
| Services | 100 | 97 | 100 |
| Groceries | 98 | 98 | 100 |
| Health | 45 | 75 | 100 |
| Housing | 94 | 98 | 100 |
| Transportation | 102 | 101 | 100 |
| Utilities | 99 | 98 | 100 |
Source: Cost of living index, normalized to US average = 100
Detroit, MI Weather
The average high in Detroit is 58.8° and the average low is 41.3°.
There are 75.8 days of precipitation each year.
Expect an average of 33.4 inches of precipitation each year with 32.5 inches of snow.
| Stat | Detroit |
|---|---|
| Average Annual High | 58.8 |
| Average Annual Low | 41.3 |
| Annual Precipitation Days | 75.8 |
| Average Annual Precipitation | 33.4 |
| Average Annual Snowfall | 32.5 |
Average High
Days of Rain
Source: NOAA climate normals (30-year)
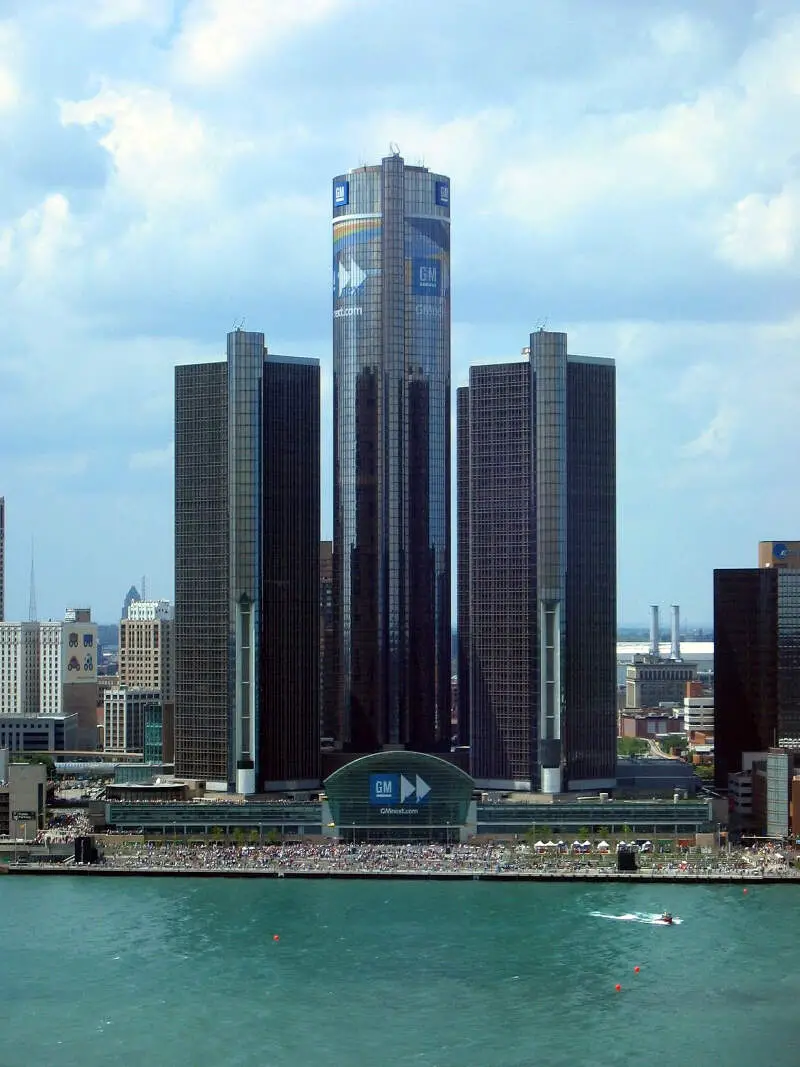
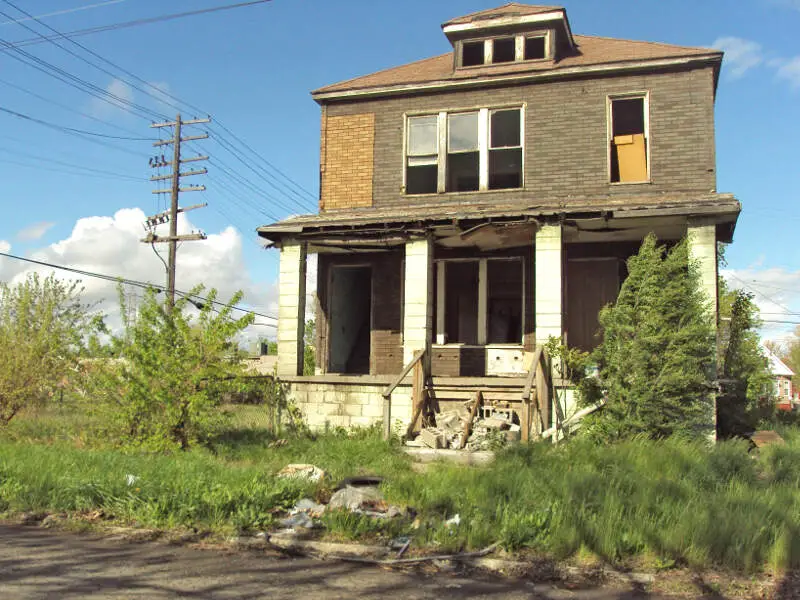
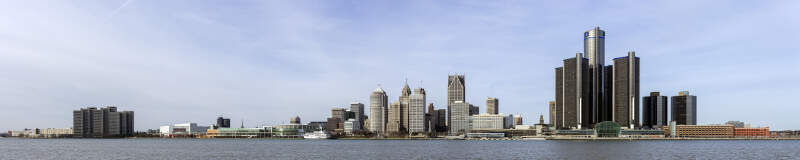
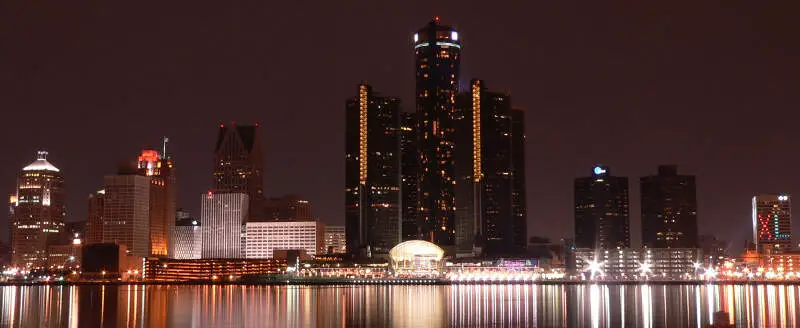
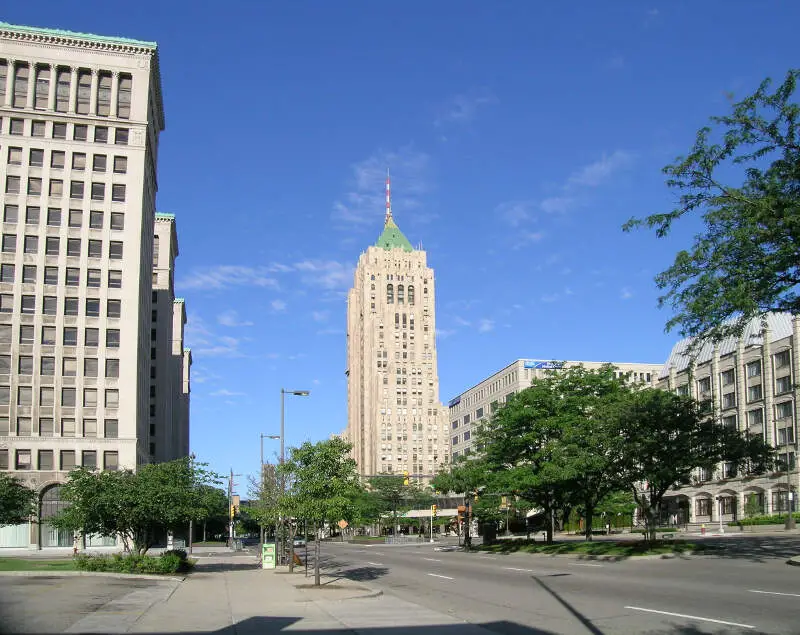
Detroit, MI Photos


9 Reviews & Comments About Detroit

I was Born and raised in the inner city of Detroit...and yes,its a shithole. Even more so because I'm not black.
Y'all I live in Detroit and all the c**p is SO TRUE.
MICHIGAN IS A VERY GOOD STATE IN THE GREAT LAKES. IN THIS CITY HAS A POPULATION OF ABOUT 10 MILLION.
YOU'VE BEEN ON A MICHIGAN FALL COLORS TOUR OR TAKEN A DRIVE THROUGH THE COUNTRY IN THE FALL JUST TO SEE THE LEAVES CHANGING.
I an 63 years old and grew up in detroit in the 1950s and 1960s. i no longer live there but have visited it several times in recent years.
Favorite places! The Detroit Institue of Art--too much time spent there is never enough. Plenty of art of all varieties to look at. Beautiful, provocative, awe-inspiring.
Princess Cruises- will take you on a ride up and down the Detroit River on both the Detroit side and the Canadian side. Scenic and restful.
Motown Museum-or as Paul McCartney put it "the Holy Grail". must see for all music fans.
Any sports venue-Detroiters are enthusiastic sports fans and that makes for a lot of fun. The same for music concerts. Have seen McCartney and Eminem and Jay-Z-there-the crowd is entertaining as the show
What has always been a downside-problematic school system and poverty. Like to feel Detroit is on its way back but a lot of improvement needed in these areas.
The crime rate is being reduced. I love that it's up and coming. More money is being put into the city which is bringing it back to how lively it used to be, especially downtown.
The coney island are great! They are every where and I love the music that comes from the city.
A new statue unveiled by the Satanic Temple in Detroit. When I was driving around Detroit and I saw this horrible statue there, I was like what's going on with this legislators and the government that allowed a thing like that. I hate it a lot and left town that day.
The satan statue is a disgusting thing that is there in Detroit. The statue is backed by an inverted pentagram and flanked by statues of two young children gazing up at the creature, which has horns, hooves, wings and a beard.
The crime rate is high although not as bad as it was some years ago.
the midtown area is vibrant and growing with new businesses and lofts and shops and restaurants opening.
Despite the downfalls the city has/is facing it is still a place full of culture and history. I LOVE the fact that they are so sports orientated. I grew up being a huge fan of sports and there is no bigger sports town than Detroit. Redwings, Pistons, Tigers and Lions are all supported with large amounts of pride!
Joe Louis Arena, Comerica Park, the new football and hockey arenas. The hockeytown cafe all the casinos and the theater. There is so much history and so much pride in the historical places still!
The crime is horrible there. The schools are some of the worst I have ever seen. Everything is run down there because the people do not take care of themselves or the places around them. It's like a 3 world country!
There's nothing there I would say is good. It's all bad. I feel like that place should be completely bulldozed and rebuilt.
Rankings & Articles For Detroit


Locations Around Detroit
Map Of Detroit, MI
Best Places Around Detroit
Royal Oak, MI
Population 57,950
Birmingham, MI
Population 21,763
Plymouth, MI
Population 9,214
Berkley, MI
Population 15,149
Huntington Woods, MI
Population 6,328
Troy, MI
Population 87,898
Clawson, MI
Population 11,374
Rochester Hills, MI
Population 77,089
Grosse Pointe, MI
Population 5,541
Livonia, MI
Population 93,851
Detroit Demographics And Statistics
Population over time in Detroit
The current population in Detroit is 638,530. The population has decreased 15.9% from 2010.
| Year | Population | % Change |
|---|---|---|
| 2024 | 638,530 | 0.3% |
| 2023 | 636,644 | -0.0% |
| 2022 | 636,787 | -1.4% |
| 2021 | 645,658 | -4.0% |
| 2020 | 672,351 | -0.4% |
| 2019 | 674,841 | -0.3% |
| 2018 | 677,155 | -0.4% |
| 2017 | 679,865 | -0.5% |
| 2016 | 683,443 | -1.0% |
| 2015 | 690,074 | -0.8% |
| 2014 | 695,437 | -1.6% |
| 2013 | 706,663 | -2.1% |
| 2012 | 721,459 | -2.3% |
| 2011 | 738,223 | -2.8% |
| 2010 | 759,340 | - |
Race / Ethnicity in Detroit
See the full breakdown
Detroit is:
10.8% White with 69,268 White residents.
75.0% African American with 478,586 African American residents.
0.2% American Indian with 1,069 American Indian residents.
1.7% Asian with 11,074 Asian residents.
0.0% Hawaiian with 101 Hawaiian residents.
0.6% Other with 3,733 Other residents.
3.4% Two Or More with 21,437 Two Or More residents.
8.3% Hispanic with 53,262 Hispanic residents.
| Race | Detroit | MI | USA |
|---|---|---|---|
| White | 10.8% | 72.4% | 57.4% |
| African American | 75.0% | 13.1% | 11.9% |
| American Indian | 0.2% | 0.3% | 0.5% |
| Asian | 1.7% | 3.4% | 5.9% |
| Hawaiian | 0.0% | 0.0% | 0.2% |
| Other | 0.6% | 0.5% | 0.6% |
| Two Or More | 3.4% | 4.5% | 4.3% |
| Hispanic | 8.3% | 5.9% | 19.3% |
Gender in Detroit
See the full breakdown
Detroit is 52.6% female with 335,762 female residents.
Detroit is 47.4% male with 302,768 male residents.
| Gender | Detroit | MI | USA |
|---|---|---|---|
| Female | 52.6% | 50.4% | 50.5% |
| Male | 47.4% | 49.6% | 49.5% |
Highest level of educational attainment in Detroit for adults over 25
See the full breakdown
4.0% of adults in Detroit completed < 9th grade.
12.0% of adults in Detroit completed 9-12th grade.
33.0% of adults in Detroit completed high school / ged.
25.0% of adults in Detroit completed some college.
7.0% of adults in Detroit completed associate's degree.
11.0% of adults in Detroit completed bachelor's degree.
6.0% of adults in Detroit completed master's degree.
1.0% of adults in Detroit completed professional degree.
1.0% of adults in Detroit completed doctorate degree.
| Education | Detroit | MI | USA |
|---|---|---|---|
| < 9th Grade | 4.0% | 3.0% | 4.0% |
| 9-12th Grade | 12.0% | 5.0% | 6.0% |
| High School / GED | 33.0% | 28.0% | 26.0% |
| Some College | 25.0% | 22.0% | 19.0% |
| Associate's Degree | 7.0% | 10.0% | 9.0% |
| Bachelor's Degree | 11.0% | 20.0% | 22.0% |
| Master's Degree | 6.0% | 9.0% | 10.0% |
| Professional Degree | 1.0% | 2.0% | 2.0% |
| Doctorate Degree | 1.0% | 1.0% | 2.0% |
Household Income For Detroit, Michigan
See the full breakdown
13.2% of households in Detroit earn Less than $10,000.
10.0% of households in Detroit earn $10,000 to $14,999.
12.0% of households in Detroit earn $15,000 to $24,999.
9.9% of households in Detroit earn $25,000 to $34,999.
14.8% of households in Detroit earn $35,000 to $49,999.
15.1% of households in Detroit earn $50,000 to $74,999.
9.2% of households in Detroit earn $75,000 to $99,999.
9.7% of households in Detroit earn $100,000 to $149,999.
3.3% of households in Detroit earn $150,000 to $199,999.
2.8% of households in Detroit earn $200,000 or more.
| Income | Detroit | MI | USA |
|---|---|---|---|
| Less than $10,000 | 13.2% | 5.2% | 5.0% |
| $10,000 to $14,999 | 10.0% | 3.8% | 3.4% |
| $15,000 to $24,999 | 12.0% | 6.8% | 6.3% |
| $25,000 to $34,999 | 9.9% | 7.3% | 6.6% |
| $35,000 to $49,999 | 14.8% | 11.4% | 10.1% |
| $50,000 to $74,999 | 15.1% | 16.8% | 15.5% |
| $75,000 to $99,999 | 9.2% | 13.2% | 12.6% |
| $100,000 to $149,999 | 9.7% | 17.3% | 17.5% |
| $150,000 to $199,999 | 3.3% | 8.6% | 9.6% |
| $200,000 or more | 2.8% | 9.5% | 13.4% |
Source: U.S. Census ACS 5-year estimates (2024)


