
Most Asian cities in New Jersey research summary. We analyzed New Jersey’s most recent Census data to determine the most Asian cities in New Jersey based on the percentage of Asian residents. Here are the results of our analysis:
The most Asian city in New Jersey is Heathcote based on the most recent Census data.
Heathcote is 62.19% Asian.
The least Asian city in New Jersey is Clementon.
Clementon is 0.0% Asian.
New Jersey is 10.0% Asian.
New Jersey is the 3rd most Asian state in the United States.
Table Of Contents: Top Ten | Methodology | Summary | Table
Here are the cities in New Jersey with the largest Asian population in 2026:
Which city in New Jersey had the largest Asian population? Heathcote took the number one overall spot for the largest Asian in New Jersey for 2026. 62.19% of Heathcote identify as Asian.
Read below to see how we crunched the numbers and how your town ranked.
To see where New Jersey ranked as a state on diversity, we have a ranking of the most diverse states in America.
And if you already knew these places were Asian, check out the best places to live in New Jersey or the most diverse places in New Jersey.
The 10 Most Asian Cities In New Jersey For 2026

/10
Population: 7,717
% Asian: 62.19%
# Of Asian Residents: 4,799
More on Heathcote: Data | Cost Of Living | Movers

/10
Population: 15,561
% Asian: 61.38%
# Of Asian Residents: 9,551
More on Princeton Meadows: Data | Cost Of Living | Movers

/10
Population: 20,290
% Asian: 54.52%
# Of Asian Residents: 11,062
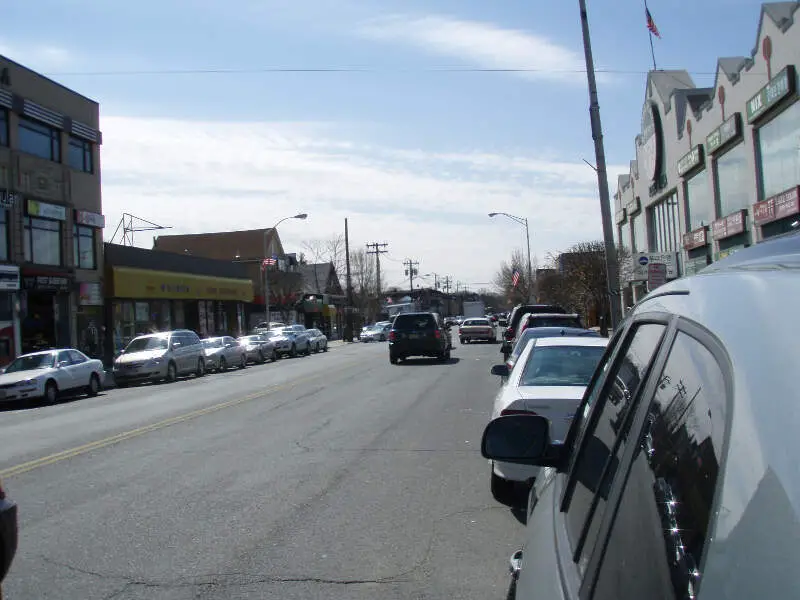
More on Palisades Park: Data | Crime | Cost Of Living | Movers

/10
Population: 7,952
% Asian: 50.87%
# Of Asian Residents: 4,045
More on Dayton: Data | Cost Of Living | Movers

/10
Population: 19,551
% Asian: 48.3%
# Of Asian Residents: 9,444
More on Iselin: Data | Cost Of Living | Movers

/10
Population: 5,362
% Asian: 47.3%
# Of Asian Residents: 2,536
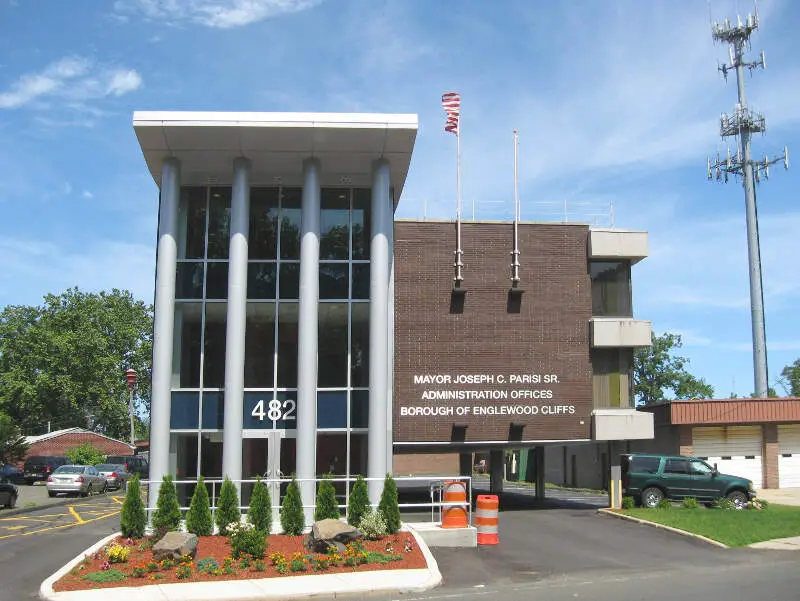
More on Englewood Cliffs: Data | Crime | Cost Of Living | Movers

/10
Population: 40,067
% Asian: 43.59%
# Of Asian Residents: 17,464
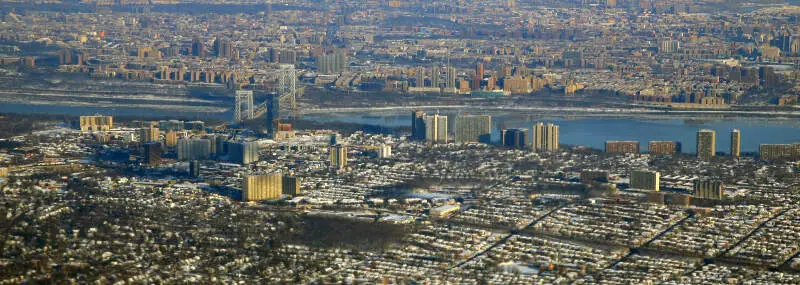
More on Fort Lee: Data | Crime | Cost Of Living | Movers

/10
Population: 6,008
% Asian: 41.1%
# Of Asian Residents: 2,469
More on Old Tappan: Data | Crime | Cost Of Living | Movers

/10
Population: 14,923
% Asian: 40.31%
# Of Asian Residents: 6,016
More on Short Hills: Data | Cost Of Living | Movers

/10
Population: 13,211
% Asian: 40.28%
# Of Asian Residents: 5,321
More on Franklin Park: Data | Cost Of Living | Movers
Methodology: How We Determined The Cities In New Jersey With The Largest Asian Population For 2026
We used Saturday Night Science to compare Census data on race across every place in New Jersey.
The Census’s most recently available data comes from the 2020-2024 American Community Survey.
Specifically, we looked at table B03002: Hispanic OR LATINO ORIGIN BY RACE. Here are the category names as defined by the Census:
- Hispanic or Latino
- White alone*
- Black or African American alone*
- American Indian and Alaska Native alone*
- Asian alone*
- Native Hawaiian and Other Pacific Islander alone*
- Some other race alone*
- Two or more races*
Our particular column of interest here was the number of people who identified as Asian alone.
We limited our analysis to cities with a population greater than 5,000 people. That left us with 251 cities.
We then calculated the percentage of residents that are Asian. The percentages ranked from 62.2% to 0.0%.
Finally, we ranked each city based on the percentage of Asian population, with a higher score being more Asian than a lower score. Heathcote took the distinction of being the most Asian, while Clementon was the least Asian city.
We updated this article for 2026. This report reflects our eleventh time ranking the cities in New Jersey with the largest Asian population.
Read on for more information on how the cities in New Jersey ranked by population of Asian residents or, for a more general take on diversity in America, head over to our ranking of the most diverse cities in America.
Summary: Asian Populations Across New Jersey
If you’re looking for a breakdown of Asian populations across New Jersey according to the most recent data, this is an accurate list.
The most Asian cities in New Jersey are Heathcote, Princeton Meadows, Palisades Park, Dayton, Iselin, Englewood Cliffs, Fort Lee, Old Tappan, Short Hills, and Franklin Park.
If you’re curious enough, here are the least Asian places in New Jersey:
- Clementon
- Villas
- Bridgeton
For more New Jersey reading, check out:
Table: Asian Population By City In New Jersey
| Rank | City | Population | Asian Population | % Asian |
|---|---|---|---|---|
| 1 | Heathcote | 7,717 | 4,799 | 62.19% |
| 2 | Princeton Meadows | 15,561 | 9,551 | 61.38% |
| 3 | Palisades Park | 20,290 | 11,062 | 54.52% |
| 4 | Dayton | 7,952 | 4,045 | 50.87% |
| 5 | Iselin | 19,551 | 9,444 | 48.3% |
| 6 | Englewood Cliffs | 5,362 | 2,536 | 47.3% |
| 7 | Fort Lee | 40,067 | 17,464 | 43.59% |
| 8 | Old Tappan | 6,008 | 2,469 | 41.1% |
| 9 | Short Hills | 14,923 | 6,016 | 40.31% |
| 10 | Franklin Park | 13,211 | 5,321 | 40.28% |
| 11 | Edgewater | 14,759 | 5,718 | 38.74% |
| 12 | Bradley Gardens | 14,165 | 5,421 | 38.27% |
| 13 | Leonia | 9,336 | 3,490 | 37.38% |
| 14 | Secaucus | 21,778 | 7,867 | 36.12% |
| 15 | Tenafly | 15,319 | 5,520 | 36.03% |
| 16 | Kendall Park | 10,011 | 3,534 | 35.3% |
| 17 | Closter | 8,606 | 2,672 | 31.05% |
| 18 | Norwood | 5,724 | 1,736 | 30.33% |
| 19 | River Edge | 12,091 | 3,599 | 29.77% |
| 20 | Cresskill | 9,174 | 2,671 | 29.11% |
| 21 | Jersey City | 294,078 | 77,831 | 26.47% |
| 22 | Pomona | 7,995 | 2,090 | 26.14% |
| 23 | Carteret | 25,496 | 6,556 | 25.71% |
| 24 | Paramus | 26,568 | 6,821 | 25.67% |
| 25 | Echelon | 13,284 | 3,384 | 25.47% |
| 26 | Woodbridge | 20,756 | 5,228 | 25.19% |
| 27 | Bergenfield | 28,450 | 7,017 | 24.66% |
| 28 | Somerset | 22,720 | 5,249 | 23.1% |
| 29 | Ridgefield | 11,498 | 2,532 | 22.02% |
| 30 | Harrison | 20,369 | 4,473 | 21.96% |
| 31 | Wood-Ridge | 10,218 | 2,239 | 21.91% |
| 32 | Raritan | 8,368 | 1,818 | 21.73% |
| 33 | Green Knoll | 6,789 | 1,471 | 21.67% |
| 34 | South Plainfield | 24,473 | 5,217 | 21.32% |
| 35 | Highland Park | 15,121 | 3,188 | 21.08% |
| 36 | Little Ferry | 10,996 | 2,254 | 20.5% |
| 37 | New Milford | 16,995 | 3,447 | 20.28% |
| 38 | Kingston Estates | 6,668 | 1,319 | 19.78% |
| 39 | Greentree | 11,537 | 2,241 | 19.42% |
| 40 | Madison Park | 9,124 | 1,764 | 19.33% |
| 41 | Finderne | 6,489 | 1,204 | 18.55% |
| 42 | Dumont | 18,279 | 3,340 | 18.27% |
| 43 | Allendale | 6,865 | 1,244 | 18.12% |
| 44 | Metuchen | 15,144 | 2,706 | 17.87% |
| 45 | East Rutherford | 10,313 | 1,809 | 17.54% |
| 46 | Maywood | 10,093 | 1,727 | 17.11% |
| 47 | Fords | 12,771 | 2,149 | 16.83% |
| 48 | Martinsville | 11,559 | 1,940 | 16.78% |
| 49 | Avenel | 17,121 | 2,772 | 16.19% |
| 50 | Sayreville | 45,838 | 7,376 | 16.09% |
| 51 | Ridgewood | 26,308 | 4,162 | 15.82% |
| 52 | Colonia | 18,587 | 2,891 | 15.55% |
| 53 | Emerson | 7,305 | 1,136 | 15.55% |
| 54 | Atlantic City | 38,632 | 5,964 | 15.44% |
| 55 | Glen Rock | 12,154 | 1,819 | 14.97% |
| 56 | Englewood | 29,638 | 4,402 | 14.85% |
| 57 | New Providence | 13,727 | 2,033 | 14.81% |
| 58 | Carlstadt | 6,378 | 939 | 14.72% |
| 59 | Eato | 13,575 | 1,970 | 14.51% |
| 60 | Cliffside Park | 25,781 | 3,706 | 14.37% |
| 61 | Upper Saddle River | 8,439 | 1,210 | 14.34% |
| 62 | Fair Lawn | 35,610 | 5,083 | 14.27% |
| 63 | Springdale | 15,173 | 2,145 | 14.14% |
| 64 | Roseland | 6,268 | 882 | 14.07% |
| 65 | Roselle Park | 14,093 | 1,971 | 13.99% |
| 66 | Robertsville | 12,035 | 1,673 | 13.9% |
| 67 | Caldwell | 9,003 | 1,251 | 13.9% |
| 68 | Middlesex | 14,645 | 2,028 | 13.85% |
| 69 | Hackensack | 46,057 | 6,375 | 13.84% |
| 70 | Montvale | 8,901 | 1,228 | 13.8% |
| 71 | Old Bridge | 28,236 | 3,687 | 13.06% |
| 72 | Oradell | 8,235 | 1,061 | 12.88% |
| 73 | Franklin Lakes | 11,084 | 1,410 | 12.72% |
| 74 | Hoboken | 58,668 | 7,368 | 12.56% |
| 75 | Rutherford | 18,894 | 2,321 | 12.28% |
| 76 | Watchung | 6,485 | 781 | 12.04% |
| 77 | Brookdale | 9,960 | 1,185 | 11.9% |
| 78 | Chatham | 9,407 | 1,095 | 11.64% |
| 79 | Mountainside | 7,049 | 804 | 11.41% |
| 80 | Florham Park | 13,564 | 1,497 | 11.04% |
| 81 | Cherry Hill Mall | 14,541 | 1,576 | 10.84% |
| 82 | Somerville | 13,410 | 1,449 | 10.81% |
| 83 | Bogota | 9,360 | 929 | 9.93% |
| 84 | Hasbrouck Heights | 12,115 | 1,165 | 9.62% |
| 85 | North Caldwell | 6,656 | 626 | 9.41% |
| 86 | Woodcliff Lake | 6,152 | 573 | 9.31% |
| 87 | Elmwood Park | 21,412 | 1,994 | 9.31% |
| 88 | Bayonne | 71,553 | 6,509 | 9.1% |
| 89 | Northfield | 8,456 | 758 | 8.96% |
| 90 | Westfield | 31,111 | 2,740 | 8.81% |
| 91 | North Arlington | 16,461 | 1,440 | 8.75% |
| 92 | Jamesburg | 5,770 | 502 | 8.7% |
| 93 | Ramsey | 14,805 | 1,288 | 8.7% |
| 94 | Clifton | 89,379 | 7,412 | 8.29% |
| 95 | New Brunswick | 56,345 | 4,453 | 7.9% |
| 96 | West New York | 52,004 | 4,087 | 7.86% |
| 97 | Hillsdale | 10,144 | 795 | 7.84% |
| 98 | Westwood | 11,283 | 842 | 7.46% |
| 99 | Budd Lake | 10,650 | 792 | 7.44% |
| 100 | Guttenberg | 11,754 | 871 | 7.41% |
| 101 | Totowa | 10,959 | 810 | 7.39% |
| 102 | Morris Plains | 6,315 | 466 | 7.38% |
| 103 | Summit | 22,705 | 1,649 | 7.26% |
| 104 | Ashland | 9,320 | 669 | 7.18% |
| 105 | Bellmawr | 11,737 | 825 | 7.03% |
| 106 | Waldwick | 10,164 | 703 | 6.92% |
| 107 | Twin Rivers | 8,382 | 577 | 6.88% |
| 108 | Fanwood | 7,799 | 536 | 6.87% |
| 109 | Marlton | 10,922 | 742 | 6.79% |
| 110 | Ridgefield Park | 13,235 | 897 | 6.78% |
| 111 | Glassboro | 23,717 | 1,600 | 6.75% |
| 112 | Lodi | 26,082 | 1,750 | 6.71% |
| 113 | Spotswood | 8,171 | 540 | 6.61% |
| 114 | Hight | 5,920 | 384 | 6.49% |
| 115 | Boonton | 8,854 | 572 | 6.46% |
| 116 | Woodland Park | 13,355 | 846 | 6.33% |
| 117 | Madison | 16,447 | 1,040 | 6.32% |
| 118 | Lincoln Park | 10,957 | 683 | 6.23% |
| 119 | Brigantine | 7,674 | 475 | 6.19% |
| 120 | Absecon | 9,170 | 566 | 6.17% |
| 121 | Dunellen | 7,911 | 486 | 6.14% |
| 122 | Wanaque | 11,206 | 683 | 6.09% |
| 123 | Ventnor City | 9,265 | 562 | 6.07% |
| 124 | Hackett | 10,140 | 603 | 5.95% |
| 125 | Laurence Harbor | 6,191 | 368 | 5.94% |
| 126 | Kinnelon | 10,013 | 592 | 5.91% |
| 127 | Prospect Park | 6,319 | 369 | 5.84% |
| 128 | North Haledon | 8,778 | 508 | 5.79% |
| 129 | Rahway | 30,109 | 1,716 | 5.7% |
| 130 | Lincroft | 6,939 | 393 | 5.66% |
| 131 | Strathmore | 6,708 | 369 | 5.5% |
| 132 | Browns Mills | 9,672 | 529 | 5.47% |
| 133 | Glen Ridge | 7,943 | 431 | 5.43% |
| 134 | Hamilton Square | 11,622 | 586 | 5.04% |
| 135 | Rockaway | 6,613 | 325 | 4.91% |
| 136 | West Freehold | 14,883 | 700 | 4.7% |
| 137 | Pompton Lakes | 11,047 | 511 | 4.63% |
| 138 | White Meadow Lake | 8,842 | 405 | 4.58% |
| 139 | Oakland | 12,768 | 570 | 4.46% |
| 140 | Passaic | 70,002 | 3,093 | 4.42% |
| 141 | Smithville | 9,545 | 421 | 4.41% |
| 142 | Kearny | 40,614 | 1,751 | 4.31% |
| 143 | Upper Montclair | 12,457 | 530 | 4.25% |
| 144 | Lake Mohawk | 9,508 | 401 | 4.22% |
| 145 | Succasunna | 9,799 | 412 | 4.2% |
| 146 | Morristown | 20,453 | 858 | 4.19% |
| 147 | Moorestown-Lenola | 14,625 | 613 | 4.19% |
| 148 | Fairview | 15,099 | 627 | 4.15% |
| 149 | Mercerville | 13,535 | 562 | 4.15% |
| 150 | North Plainfield | 22,809 | 937 | 4.11% |
| 151 | Paterson | 158,735 | 6,515 | 4.1% |
| 152 | Palmyra | 7,485 | 305 | 4.07% |
| 153 | Tinton Falls | 19,361 | 780 | 4.03% |
| 154 | Toms River | 94,956 | 3,787 | 3.99% |
| 155 | South River | 16,124 | 638 | 3.96% |
| 156 | Wallington | 11,889 | 469 | 3.94% |
| 157 | Linwood | 6,992 | 274 | 3.92% |
| 158 | Somerdale | 5,581 | 218 | 3.91% |
| 159 | Linden | 44,192 | 1,711 | 3.87% |
| 160 | Ramblewood | 6,611 | 252 | 3.81% |
| 161 | East Franklin | 11,070 | 415 | 3.75% |
| 162 | Barrington | 7,076 | 265 | 3.75% |
| 163 | Garfield | 32,783 | 1,223 | 3.73% |
| 164 | Mil | 7,059 | 254 | 3.6% |
| 165 | South Amboy | 9,989 | 359 | 3.59% |
| 166 | Butler | 8,133 | 286 | 3.52% |
| 167 | Kenilworth | 8,401 | 295 | 3.51% |
| 168 | Haledon | 8,980 | 312 | 3.47% |
| 169 | Freehold | 12,507 | 430 | 3.44% |
| 170 | Somers Point | 10,515 | 360 | 3.42% |
| 171 | Gloucester City | 11,509 | 390 | 3.39% |
| 172 | Pine Lake Park | 9,795 | 326 | 3.33% |
| 173 | Union City | 66,463 | 2,197 | 3.31% |
| 174 | Lindenwold | 21,719 | 712 | 3.28% |
| 175 | Ramtown | 6,203 | 199 | 3.21% |
| 176 | Cape May Court House | 5,628 | 175 | 3.11% |
| 177 | Bloomingdale | 7,716 | 239 | 3.1% |
| 178 | Park Ridge | 9,406 | 282 | 3.0% |
| 179 | Paulsboro | 6,248 | 177 | 2.83% |
| 180 | Carneys Point | 8,050 | 226 | 2.81% |
| 181 | Manville | 10,921 | 301 | 2.76% |
| 182 | Long Branch | 32,530 | 882 | 2.71% |
| 183 | Midland Park | 7,019 | 188 | 2.68% |
| 184 | Runnemede | 8,355 | 219 | 2.62% |
| 185 | Keyport | 7,171 | 175 | 2.44% |
| 186 | Bound Brook | 12,219 | 298 | 2.44% |
| 187 | Fort Dix | 7,984 | 190 | 2.38% |
| 188 | Hopatcong | 14,565 | 342 | 2.35% |
| 189 | Stratford | 7,018 | 164 | 2.34% |
| 190 | Washington | 7,334 | 170 | 2.32% |
| 191 | Yardville | 6,301 | 141 | 2.24% |
| 192 | Pine Hill | 10,802 | 234 | 2.17% |
| 193 | Asbury Park | 15,295 | 331 | 2.16% |
| 194 | Dover | 18,563 | 396 | 2.13% |
| 195 | Vineland | 61,006 | 1,297 | 2.13% |
| 196 | Haddonfield | 12,595 | 257 | 2.04% |
| 197 | East Freehold | 5,096 | 103 | 2.02% |
| 198 | Ringwood | 11,657 | 230 | 1.97% |
| 199 | Pleasantville | 20,712 | 407 | 1.97% |
| 200 | Newark | 310,178 | 6,093 | 1.96% |
| 201 | Keansburg | 9,719 | 178 | 1.83% |
| 202 | Hawthorne | 19,628 | 359 | 1.83% |
| 203 | Crestwood Village | 7,830 | 136 | 1.74% |
| 204 | Elizabeth | 137,302 | 2,366 | 1.72% |
| 205 | Berlin | 7,539 | 128 | 1.7% |
| 206 | Camden | 71,496 | 1,196 | 1.67% |
| 207 | Pitman | 8,856 | 148 | 1.67% |
| 208 | Haddon Heights | 7,516 | 121 | 1.61% |
| 209 | Red Bank | 12,862 | 203 | 1.58% |
| 210 | Newton | 8,369 | 121 | 1.45% |
| 211 | Roselle | 22,646 | 313 | 1.38% |
| 212 | White Horse | 10,507 | 145 | 1.38% |
| 213 | Margate City | 5,234 | 69 | 1.32% |
| 214 | Holiday City-Berkeley | 12,995 | 171 | 1.32% |
| 215 | Ocean Acres | 19,204 | 249 | 1.3% |
| 216 | West Long Branch | 8,586 | 111 | 1.29% |
| 217 | Collingswood | 14,205 | 181 | 1.27% |
| 218 | Matawan | 9,710 | 122 | 1.26% |
| 219 | Woodbury | 10,042 | 126 | 1.25% |
| 220 | Perth Amboy | 55,855 | 696 | 1.25% |
| 221 | East Orange | 70,090 | 870 | 1.24% |
| 222 | Burlington | 9,993 | 115 | 1.15% |
| 223 | Beachwood | 11,088 | 125 | 1.13% |
| 224 | Williamstown | 14,705 | 155 | 1.05% |
| 225 | Oceanport | 6,195 | 64 | 1.03% |
| 226 | Yorketown | 7,261 | 70 | 0.96% |
| 227 | Belmar | 5,869 | 56 | 0.95% |
| 228 | Clayton | 8,921 | 84 | 0.94% |
| 229 | Phillipsburg | 15,299 | 141 | 0.92% |
| 230 | Salem | 5,322 | 47 | 0.88% |
| 231 | Mystic Island | 8,259 | 70 | 0.85% |
| 232 | Wildwood | 5,130 | 42 | 0.82% |
| 233 | Point Pleasant | 19,334 | 158 | 0.82% |
| 234 | Manasquan | 5,922 | 46 | 0.78% |
| 235 | Plainfield | 55,236 | 428 | 0.77% |
| 236 | Union Beach | 5,707 | 44 | 0.77% |
| 237 | Hammonton | 14,840 | 106 | 0.71% |
| 238 | Millville | 27,511 | 191 | 0.69% |
| 239 | Audubon | 8,730 | 57 | 0.65% |
| 240 | Wharton | 7,318 | 43 | 0.59% |
| 241 | Bernardsville | 7,916 | 46 | 0.58% |
| 242 | Rumson | 7,241 | 41 | 0.57% |
| 243 | Little Silver | 6,105 | 33 | 0.54% |
| 244 | Trenton | 90,338 | 386 | 0.43% |
| 245 | Lakewood | 69,585 | 285 | 0.41% |
| 246 | Fair Haven | 6,170 | 25 | 0.41% |
| 247 | Pennsville | 12,233 | 44 | 0.36% |
| 248 | Ocean City | 11,261 | 24 | 0.21% |
| 249 | Bridgeton | 27,001 | 50 | 0.19% |
| 250 | Villas | 9,735 | 6 | 0.06% |
| 251 | Clementon | 5,410 | 0 | 0.0% |