There’s no denying it: there are plenty of places in Illinois that are downright beautiful and full of excitement.
Unfortunately, not all towns and cities in Prairie State are so lucky.
Just like in all U.S. States, there are definitely some boring places within Illinois’s’ borders. You know the places where everyone has an AARP card and the most exciting thing they do all day is post a picture of their grandchild on Facebook.
Like Johnsburg, for instance. In our latest analysis, we found that this city was the most boring city in all of Illinois according to Saturday Night Science. But don’t feel bad if you’re a resident of Johnsburg. There are plenty of other boring, lackluster places in Illinois as well.
Here they are. Try not to jump out of your seat with excitement.
49.1 median age · 45.0% married households · #18 oldest in Illinois
Johnsburg is a northwest suburban village in McHenry County, Illinois, United States. The population was 6,337 at the 2010 census.
Data | Crime | Cost of living | Movers
49.2 median age · 36.0% married households · #16 oldest in Illinois
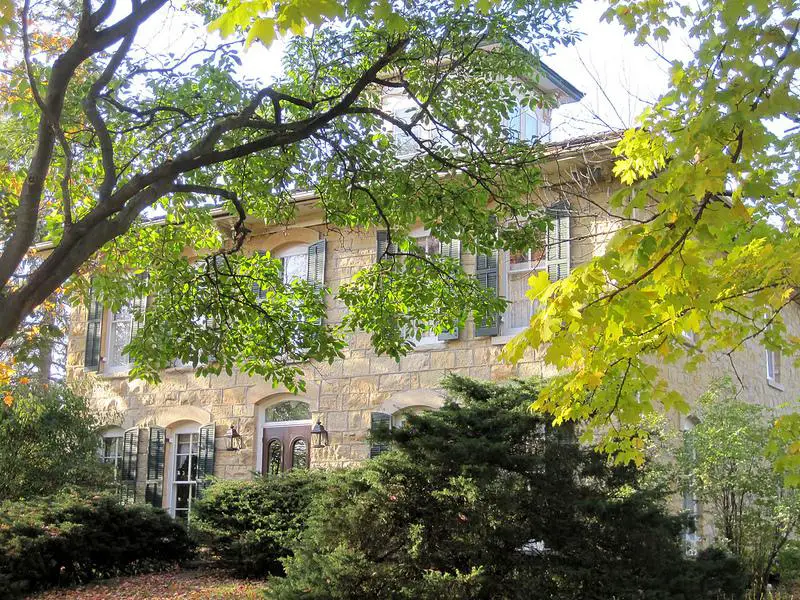
Long Grove is an affluent village in Lake County, Illinois, United States, approximately 35 miles northwest of Chicago. As of the 2010 census, the village had a population of 8,043. The village has strict building ordinances to preserve its “country atmosphere”.
Data | Crime | Cost of living | Movers
45.4 median age · 41.0% married households · #39 oldest in Illinois
Data | Crime | Cost of living | Movers
50.1 median age · 30.0% married households · #10 oldest in Illinois
Data | Crime | Cost of living | Movers
48.4 median age · 40.0% married households · #20 oldest in Illinois
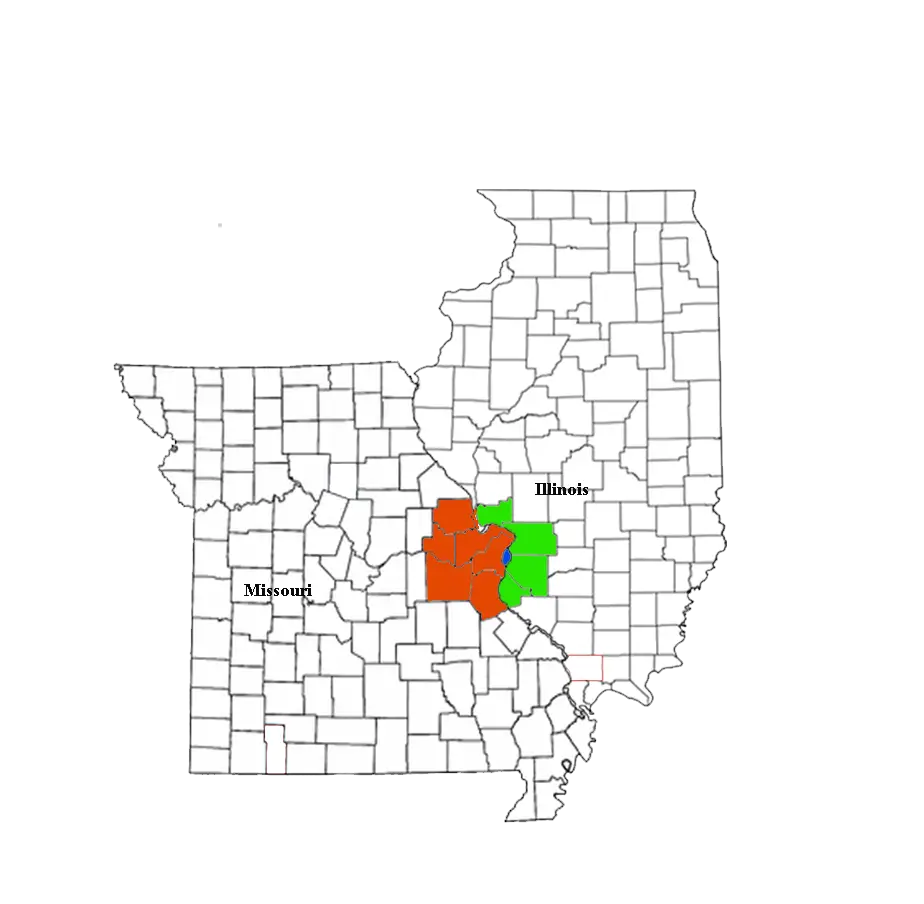
Godfrey is a village in Madison County, Illinois, United States. The population was 17,982 at the 2010 census. Godfrey is located within the Greater St. Louis metropolitan area.
Data | Crime | Cost of living | Movers
42.6 median age · 43.0% married households · #83 oldest in Illinois
Homer Glen is a village, located 32 miles southwest of downtown Chicago, in Homer Township, Will County, Illinois. The village was incorporated on April 17, 2001.
Homer Glen is part of the Chicago metropolitan area media market for television, radio, and newspaper coverage. The Chicago Tribune and the Chicago Sun-Times, and also the Joliet Herald are widely available.
Data | Crime | Cost of living | Movers
45.7 median age · 44.0% married households · #35 oldest in Illinois
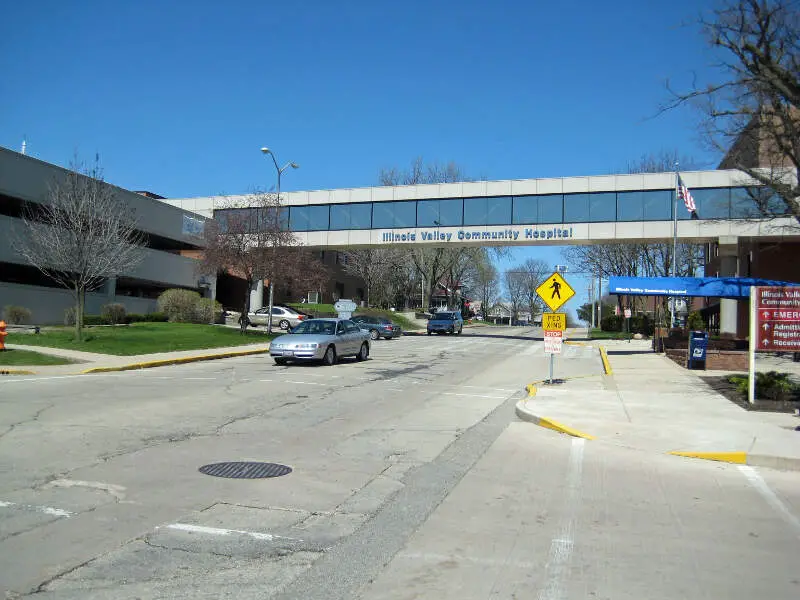
Peru is a city in LaSalle County, Illinois, United States. The population was 10,295 at the 2010 census. It is part of the Ottawa-Peru, IL Micropolitan Statistical Area. Peru and its twin city, LaSalle, make up the core of Illinois Valley.
Data | Crime | Cost of living | Movers
41.9 median age · 42.0% married households · #104 oldest in Illinois
Data | Crime | Cost of living | Movers
44.7 median age · 42.0% married households · #46 oldest in Illinois
Geneseo is a city in Henry County, Illinois, United States. The population was 6,586 at the 2010 census, up from 6,480 in 2000. Geneseo is 20 miles east of the Quad Cities, at the intersection of Interstate 80, U.S. Route 6 and Illinois Route 82.
Data | Crime | Cost of living | Movers

42.4 median age · 32.0% married households · #87 oldest in Illinois
Columbia is a city in Monroe and St. Clair counties in the U.S. state of Illinois, about 12 miles south of St. Louis, Missouri. The population was 9,707 at the 2010 census.
Data | Crime | Cost of living | Movers
The receipts
Compare the top ten
Pick a metric. The bars rescale. The red line is Illinois’s statewide median.
On the map
Where the quiet settles in Illinois
Saturday Night Science
Methodology: How we determined the boring cities in the Prairie State
You would present the following case to your friends if you were argueing with them at a bar about the most boring place to live in Illinois. And that’s why we call it Saturday Night Science.
Because our data speaks more truth than feelings.
To figure out how boring a place is, we factored in things we generally think make people exciting, and then we figure out which cities have the least number of those exciting people.
We used the U.S. American Community Census data to gather the information presented here. Some of the things people tend to think of as making a city’s population boring include:
- % of Population Over 25 (higher is more boring)
- % of Married Household (higher is more boring)
- Average Age (higher is more boring)
- % of Households With Kids (higher is more boring)
- Population density (lower is more boring)
Then, our algorithm generates a ranking for each place in these categories. After crunching the numbers, all of the cities ranked from most boring to most exciting.
For this ranking, we used every Illinois city with at least 5,000 residents. This keeps us from prejudicing our rankings by including very small pockets of retired people.
Grab your rocker and hold on.
We updated this article for 2026, and it’s our eleventh time ranking the most boring cities in Illinois.
The full plate
Detailed List Of The Most Boring Cities In Illinois For 2026
Click any column to sort. Search by city name.
| Rank | City | Boring Score | Population | Average Age | % Married | % Kids |
|---|---|---|---|---|---|---|
| 1 | Johnsburg | 64.20 | 6,386 | 49.1 | 45.0% | 27.9% |
| 2 | Long Grove | 66.70 | 8,305 | 49.2 | 36.0% | 30.8% |
| 3 | Sugar Grove | 67.80 | 9,240 | 45.4 | 41.0% | 32.5% |
| 4 | South Barrington | 68.80 | 5,021 | 50.1 | 30.0% | 36.9% |
| 5 | Godfrey | 68.90 | 17,712 | 48.4 | 40.0% | 25.6% |
| 6 | Homer Glen | 71.70 | 24,529 | 42.6 | 43.0% | 33.9% |
| 7 | Peru | 74.40 | 9,775 | 45.7 | 44.0% | 27.6% |
| 8 | Bartonville | 74.90 | 5,841 | 41.9 | 42.0% | 28.4% |
| 9 | Geneseo | 77.10 | 6,673 | 44.7 | 42.0% | 29.9% |
| 10 | Columbia | 78.20 | 11,127 | 42.4 | 32.0% | 34.7% |
| 11 | Campton Hills | 78.60 | 10,877 | 43.6 | 45.0% | 37.3% |
| 12 | East Alton | 83.30 | 5,689 | 45.2 | 32.0% | 28.5% |
| 13 | Monee | 85.30 | 5,108 | 39.6 | 38.0% | 30.2% |
| 14 | Flossmoor | 86.10 | 9,391 | 47.6 | 43.0% | 30.1% |
| 15 | Mokena | 88.00 | 20,021 | 46.2 | 49.0% | 30.7% |
| 16 | Litchfield | 89.40 | 6,834 | 43.7 | 41.0% | 23.0% |
| 17 | Spring Grove | 89.50 | 5,917 | 39.3 | 53.0% | 43.5% |
| 18 | Monticello | 89.60 | 6,304 | 43.8 | 44.0% | 24.4% |
| 19 | Morton | 89.60 | 16,595 | 41.4 | 43.0% | 32.2% |
| 20 | Braidwood | 90.60 | 6,062 | 46.3 | 43.0% | 24.7% |
| 21 | Crete | 91.40 | 8,386 | 48.9 | 33.0% | 24.6% |
| 22 | Shorewood | 92.30 | 18,343 | 44.2 | 43.0% | 29.8% |
| 23 | Chillicothe | 92.40 | 5,900 | 51.2 | 35.0% | 18.1% |
| 24 | Frankfort | 92.70 | 20,651 | 42.2 | 43.0% | 42.6% |
| 25 | Winthrop Harbor | 93.20 | 6,559 | 53.4 | 38.0% | 19.8% |
| 26 | Hawthorn Woods | 93.30 | 9,143 | 40.9 | 40.0% | 47.9% |
| 27 | Inverness | 93.50 | 7,275 | 56.4 | 31.0% | 23.6% |
| 28 | Jerseyville | 93.50 | 7,445 | 44.9 | 34.0% | 30.4% |
| 29 | Gilberts | 94.40 | 8,606 | 40.6 | 37.0% | 43.8% |
| 30 | Lake Bluff | 95.70 | 6,041 | 46.3 | 27.0% | 39.6% |
| 31 | Marion | 96.80 | 16,836 | 42.2 | 33.0% | 27.2% |
| 32 | Maryville | 97.40 | 8,316 | 51.7 | 33.0% | 19.7% |
| 33 | Huntley | 98.00 | 28,005 | 49.7 | 37.0% | 24.5% |
| 34 | Princeton | 98.10 | 7,975 | 46.0 | 33.0% | 21.8% |
| 35 | Waterloo | 98.20 | 11,129 | 41.5 | 32.0% | 32.8% |
| 36 | Manteno | 99.10 | 9,030 | 45.6 | 46.0% | 26.3% |
| 37 | Mount Zion | 99.20 | 5,660 | 40.7 | 50.0% | 38.0% |
| 38 | Burr Ridge | 100.70 | 11,141 | 56.9 | 31.0% | 23.1% |
| 39 | East Peoria | 100.80 | 22,324 | 42.6 | 39.0% | 23.2% |
| 40 | Lemont | 101.00 | 17,820 | 43.7 | 35.0% | 36.7% |
| 41 | Lake Barrington | 101.30 | 5,442 | 54.9 | 28.0% | 24.7% |
| 42 | Highland Park | 105.70 | 30,398 | 45.0 | 35.0% | 31.1% |
| 43 | Oak Brook | 107.20 | 8,056 | 55.2 | 24.0% | 24.9% |
| 44 | Highland | 108.10 | 10,262 | 41.8 | 34.0% | 26.5% |
| 45 | Winfield | 109.00 | 10,095 | 44.0 | 40.0% | 28.4% |
| 46 | Barrington | 110.00 | 11,077 | 43.9 | 32.0% | 40.8% |
| 47 | Du Quoin | 110.80 | 5,726 | 41.1 | 35.0% | 33.2% |
| 48 | Geneva | 110.80 | 21,258 | 43.2 | 37.0% | 30.5% |
| 49 | Lake Villa | 111.00 | 8,683 | 40.4 | 34.0% | 43.5% |
| 50 | Benton | 111.40 | 6,863 | 42.6 | 32.0% | 26.7% |
| 51 | Chester | 111.60 | 6,797 | 43.5 | 25.0% | 28.3% |
| 52 | Canton | 111.70 | 13,144 | 45.9 | 34.0% | 20.5% |
| 53 | Lincolnshire | 111.90 | 7,980 | 49.4 | 21.0% | 30.9% |
| 54 | Spring Valley | 112.30 | 5,476 | 41.7 | 36.0% | 27.5% |
| 55 | Itasca | 112.60 | 9,355 | 43.1 | 30.0% | 28.3% |
| 56 | Orland Park | 112.70 | 57,916 | 46.3 | 38.0% | 26.9% |
| 57 | Deerfield | 113.60 | 19,518 | 44.5 | 37.0% | 35.4% |
| 58 | Palos Heights | 113.90 | 12,152 | 50.2 | 47.0% | 20.8% |
| 59 | Willow Springs | 115.00 | 5,868 | 42.7 | 32.0% | 22.4% |
| 60 | McHenry | 115.00 | 28,074 | 43.9 | 33.0% | 24.9% |
| 61 | Herrin | 115.90 | 12,226 | 41.2 | 34.0% | 26.4% |
| 62 | Kewanee | 116.60 | 11,913 | 46.3 | 33.0% | 24.2% |
| 63 | Morris | 116.60 | 14,898 | 40.2 | 39.0% | 28.5% |
| 64 | Matteson | 117.00 | 18,645 | 44.5 | 29.0% | 28.8% |
| 65 | Fox Lake | 117.20 | 11,131 | 42.9 | 32.0% | 21.2% |
| 66 | Algonquin | 117.30 | 30,067 | 41.4 | 37.0% | 31.3% |
| 67 | Glencoe | 117.40 | 8,701 | 44.8 | 35.0% | 40.3% |
| 68 | Silvis | 117.60 | 7,955 | 47.1 | 30.0% | 20.8% |
| 69 | Batavia | 119.30 | 27,151 | 42.0 | 38.0% | 33.6% |
| 70 | Taylorville | 119.40 | 10,646 | 39.6 | 34.0% | 30.2% |
| 71 | Vandalia | 119.70 | 5,796 | 43.9 | 23.0% | 23.9% |
| 72 | Northfield | 120.40 | 5,487 | 49.2 | 27.0% | 28.3% |
| 73 | Robinson | 120.40 | 7,084 | 42.4 | 22.0% | 31.2% |
| 74 | Glenview | 122.60 | 47,752 | 46.5 | 27.0% | 32.6% |
| 75 | Pingree Grove | 123.50 | 10,914 | 38.0 | 37.0% | 44.7% |
| 76 | Glen Carbon | 123.80 | 13,977 | 40.4 | 29.0% | 31.1% |
| 77 | Mahomet | 124.20 | 10,049 | 37.7 | 39.0% | 42.1% |
| 78 | Lake Forest | 124.60 | 19,416 | 46.1 | 27.0% | 28.6% |
| 79 | Libertyville | 124.90 | 20,525 | 42.1 | 29.0% | 35.6% |
| 80 | Northbrook | 125.10 | 34,585 | 49.6 | 28.0% | 27.6% |
| 81 | Channahon | 125.40 | 13,927 | 37.2 | 45.0% | 36.1% |
| 82 | Yorkville | 125.80 | 23,617 | 35.8 | 36.0% | 39.2% |
| 83 | Bartlett | 126.30 | 40,501 | 41.0 | 31.0% | 35.6% |
| 84 | Sandwich | 126.60 | 7,219 | 39.3 | 37.0% | 35.2% |
| 85 | Pontiac | 128.20 | 11,294 | 42.8 | 28.0% | 24.3% |
| 86 | Downers Grove | 128.20 | 50,054 | 43.6 | 34.0% | 28.1% |
| 87 | La Grange Park | 128.50 | 13,447 | 44.0 | 39.0% | 31.6% |
| 88 | St. Charles | 128.60 | 32,854 | 41.5 | 33.0% | 29.4% |
| 89 | Rockton | 129.00 | 7,974 | 39.4 | 35.0% | 37.9% |
| 90 | Riverside | 129.30 | 9,039 | 42.0 | 38.0% | 31.9% |
| 91 | Colona | 129.50 | 5,139 | 38.7 | 28.0% | 38.9% |
| 92 | Tinley Park | 129.50 | 54,842 | 43.2 | 40.0% | 26.3% |
| 93 | Ottawa | 130.20 | 18,447 | 39.8 | 33.0% | 33.0% |
| 94 | Manhattan | 130.60 | 11,026 | 32.8 | 47.0% | 52.6% |
| 95 | Bethalto | 131.30 | 9,239 | 40.8 | 42.0% | 25.6% |
| 96 | Park Ridge | 131.70 | 38,667 | 44.4 | 37.0% | 32.5% |
| 97 | Pinckneyville | 132.20 | 5,018 | 38.8 | 26.0% | 28.6% |
| 98 | Olney | 132.20 | 8,577 | 41.0 | 30.0% | 29.8% |
| 99 | New Lenox | 132.40 | 28,006 | 36.8 | 53.0% | 45.2% |
| 100 | Dixon | 132.60 | 14,910 | 41.9 | 27.0% | 27.8% |
Source: U.S. Census ACS 2020-2024. 323 cities with more than 5,000 residents.
Summary
There You Have It – Now That You’re Asleep
On a ranking like this, there are usually no winners, but since Illinois isn’t necessarily the most boring state in the United States, the cities on this ranking can at least take solace that there are, in fact, more boring cities in the country.
The most boring cities in Illinois are Johnsburg, Long Grove, Sugar Grove, South Barrington, Godfrey, Homer Glen, Peru, Bartonville, Geneseo, and Columbia.
If you’re also curious enough, here are the most exciting places in Illinois, according to science.