Now that we’re headed towards the next big election, we wanted to get a better sense of what parts of Kentucky would be the most likely to back Donald Trump again.
Specifically, which cities have the highest number of conservative voters in the Bluegrass State?
To do so, we used Saturday Night Science to measure how each city in Kentucky with populations greater than 5,000 voted in past elections. The cities with the highest percentage of voters who voted Republican were named the most conservative cities in the state.
83.0% Republican vote · #1 most conservative in Kentucky
Corbin is a home rule-class city in Whitley and Knox counties in the southeastern portion of the U.S. state of Kentucky. The urbanized area around Corbin extends into Laurel County; this area is not incorporated into the city limits due to a state law prohibiting cities from being in more than two counties. However, this area is served by some of the city’s public services. As of the 2010 census, the city population was 7,304, with 21,132 living in the “urban cluster” that includes Corbin and North Corbin.
Data | Crime | Cost of living | Movers
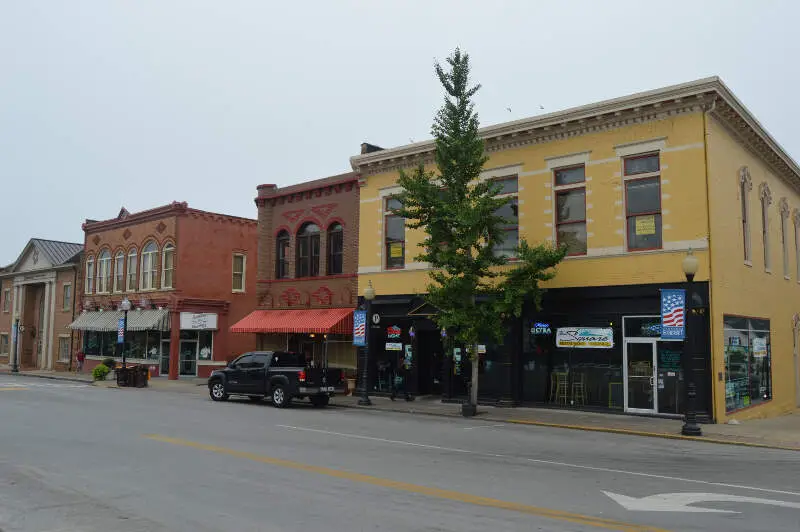
82.7% Republican vote · #2 most conservative in Kentucky
London is a home rule-class city in Laurel County, Kentucky, in the United States. It is the seat of its county. The population was 7,993 at the time of the 2010 U.S. census. London, Kentucky, is the second-largest city named London in the United States and the fourth-largest in the world. It is part of the London, Kentucky micropolitan area. Of the seventeen micropolitan areas in Kentucky, London is the largest; the London micropolitan area’s 2010 Census population was 126,369. London is also home to the annual World Chicken Festival that celebrates the life of Colonel Sanders and features the world’s largest skillet.
Data | Crime | Cost of living | Movers
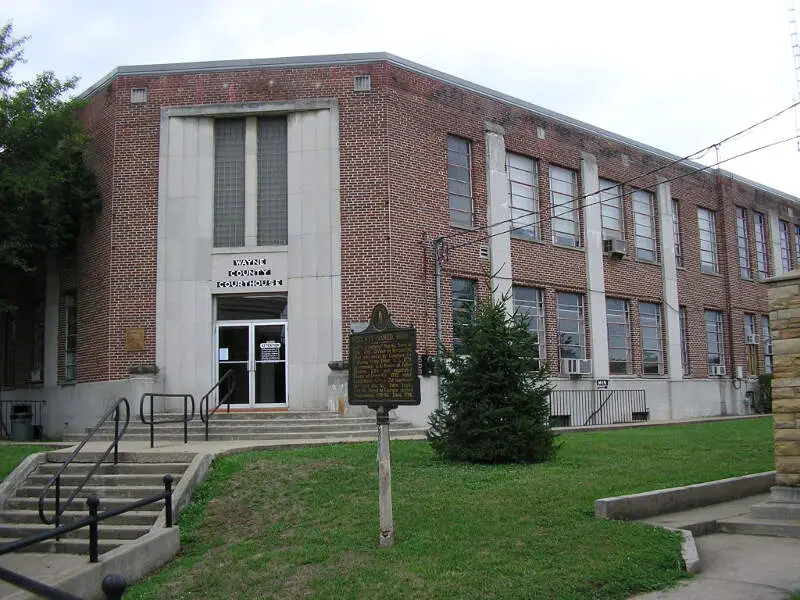
81.9% Republican vote · #4 most conservative in Kentucky
Williamsburg is a home rule-class city in and the county seat of Whitley County, Kentucky, United States. The population was 5,245 at the 2010 census. The city was founded in 1818 and named after William Whitley. The Cumberland River flows through the city.
Data | Crime | Cost of living | Movers
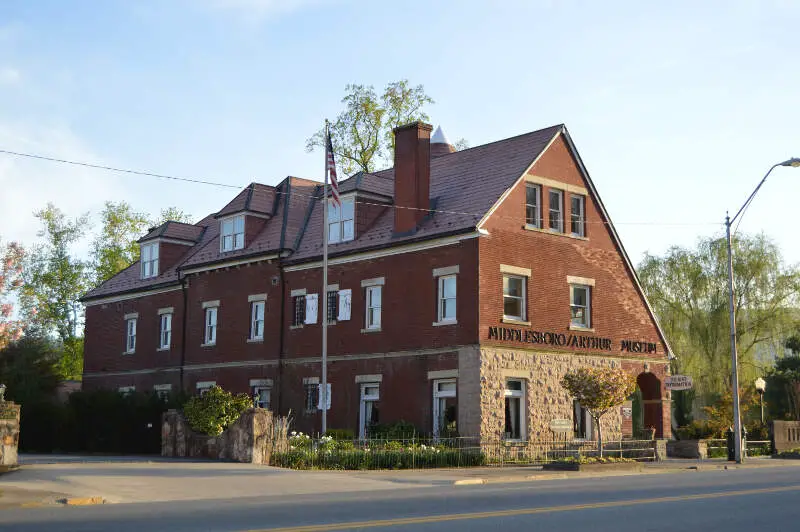
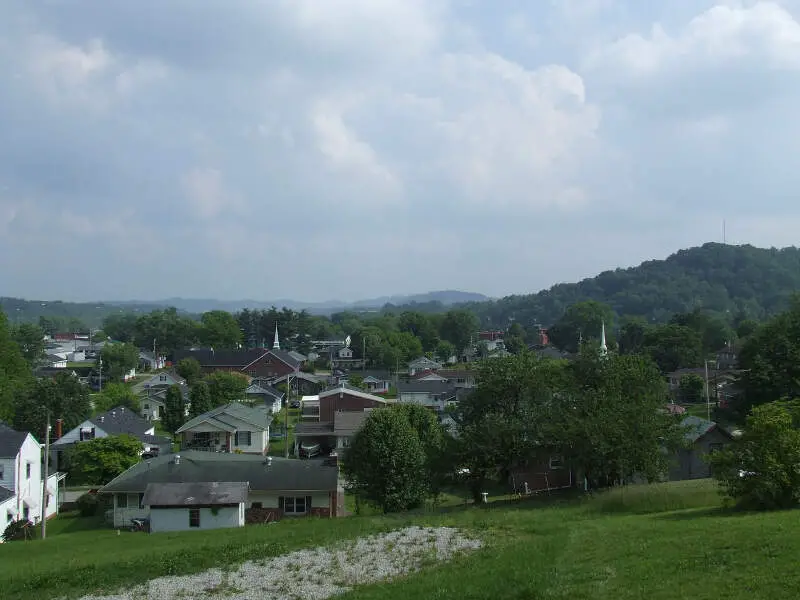
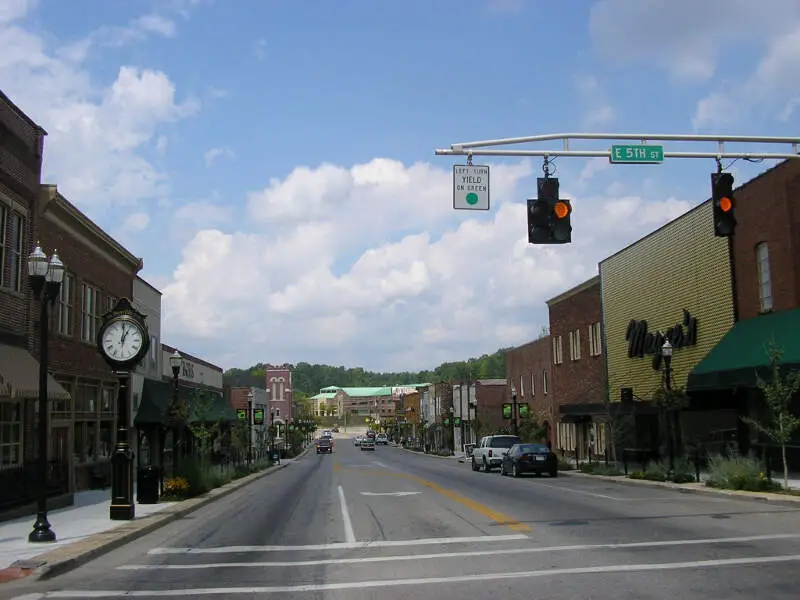
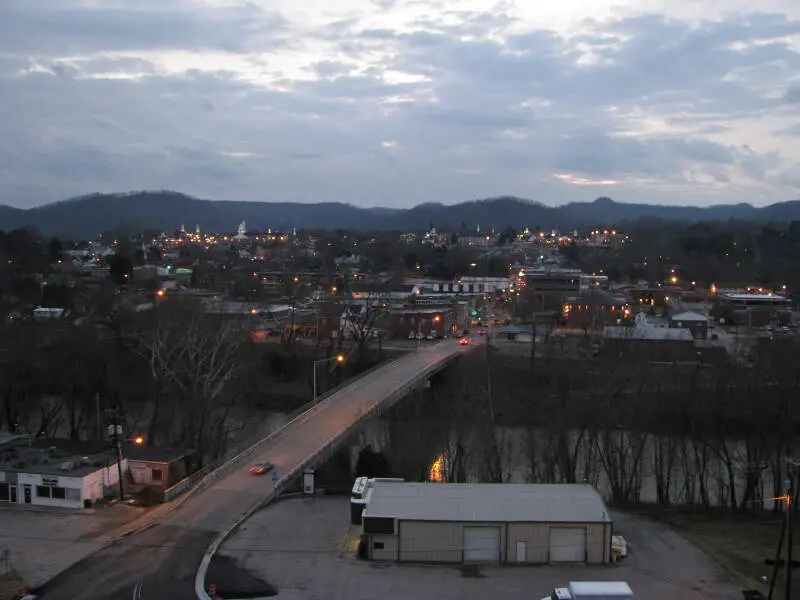
81.0% Republican vote · #6 most conservative in Kentucky
Middlesboro is a home rule-class city in Bell County, Kentucky, United States. The population was 10,334 at the 2010 U.S. census, while its micropolitan area had a population of 69,060.
Data | Crime | Cost of living | Movers
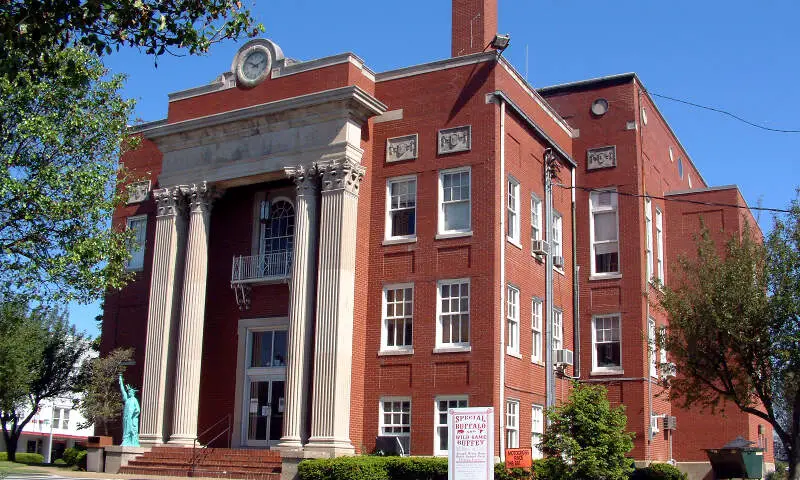
80.7% Republican vote · #7 most conservative in Kentucky
Somerset is a home rule-class city in Pulaski County, Kentucky, United States. The city population was 11,196 according to the 2010 census.
Data | Crime | Cost of living | Movers
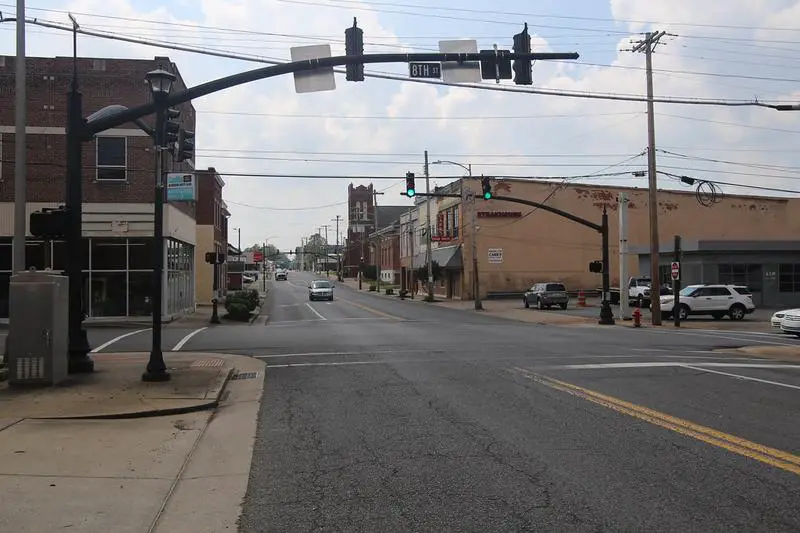
80.4% Republican vote · #8 most conservative in Kentucky
Data | Crime | Cost of living | Movers
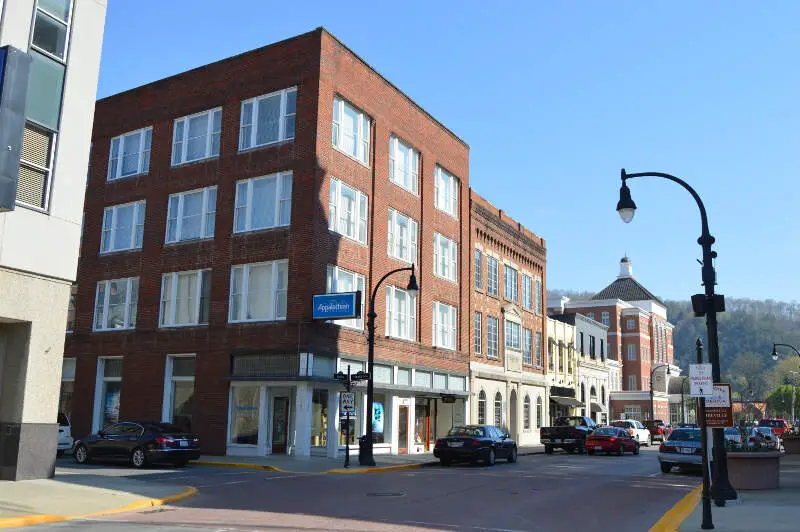
79.9% Republican vote · #9 most conservative in Kentucky
Pikeville is a city in and the county seat of Pike County, Kentucky, United States. During the 2010 U.S. Census, the population within Pikeville’s city limits was 6,903. In Kentucky’s current city classification system, Pikeville is a home rule-class city, a category that includes all of the state’s more than 400 cities except for the two largest, Louisville and Lexington.
Data | Crime | Cost of living | Movers
78.9% Republican vote · #10 most conservative in Kentucky
Leitchfield is the county seat of Grayson County, Kentucky, United States. Leitchfield is a home rule-class city with a population of 6,699 as of the 2010 census.
Data | Crime | Cost of living | Movers
77.6% Republican vote · #11 most conservative in Kentucky
Mayfield is a home rule-class city in Graves County, Kentucky, in the United States. It is the seat of its county. The population was 10,024 as of the 2010 U.S. census.
Data | Crime | Cost of living | Movers
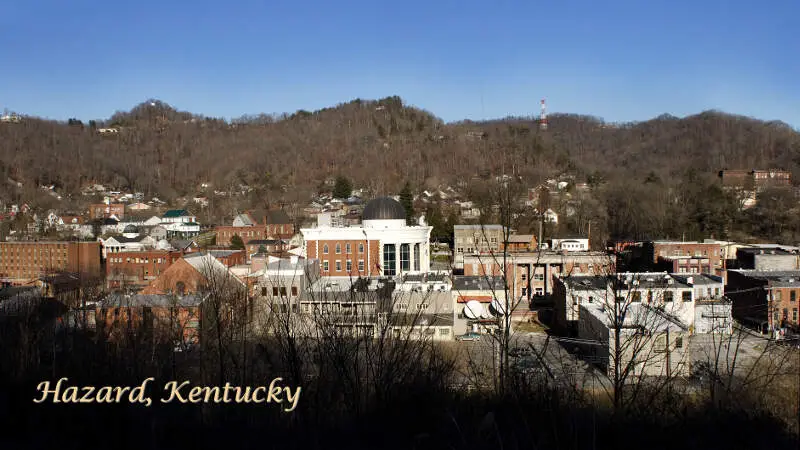
76.5% Republican vote · #12 most conservative in Kentucky
Hazard is a home rule-class city in and the county seat of Perry County, Kentucky, United States. The population was estimated to be 5,346 in 2014.
Data | Movers
The receipts
Compare the top ten
Pick a metric. The bars rescale. The red line is Kentucky’s statewide median.
On the map
Mapping the conservative strongholds in Kentucky
Saturday Night Science
How we determined the most conservative cities in Kentucky for 2026
To find the most conservative places in Kentucky, we used Saturday Night Science – the argument you’d make at a bar – to find the cities with the most conservatives.
We started by making a list of every city in Kentucky over 5,000 people based on the 2020-2024 American Community Survey. That left us with 80 cities and towns.
We then measured the voting record and MIT election data to determine which places rock the most rightward in their allegiances by:
- Percentage Of Votes For The Republican President In 2020
Because no voting data exists at the city level, we used county-level election results from the 2020 election. We assigned every city in a county the percentage of votes that went to the Republicans, effectively extending the county’s results to the city level. In cases where larger cities encompassed an entire county, the election outcomes accurately reflected the city’s political landscape.
Next, we ranked each city from 1 to 80 for each criterion, where number one was the most conservative.
The winner, Corbin, is “The Most Conservative City in Kentucky For 2026”. The most liberal place in Kentucky was Lexington-Fayette urban county.
We updated this article for 2026. This report is our eleventh time ranking the most conservative places to live in Kentucky.
The full plate
Most Conservative Places In Kentucky
Click any column to sort. Search by city name.
| Rank | City | Conservative Score | Population | % Conservative |
|---|---|---|---|---|
| 1 | Corbin | 1.00 | 8,246 | 83.0% |
| 2 | London | 2.50 | 7,561 | 82.7% |
| 3 | Williamsburg | 4.50 | 5,270 | 81.9% |
| 4 | Middlesborough | 6.00 | 9,123 | 81.0% |
| 5 | Somerset | 7.00 | 12,216 | 80.7% |
| 6 | Monticello | 8.00 | 5,753 | 80.4% |
| 7 | Pikeville | 9.00 | 7,490 | 79.9% |
| 8 | Leitchfield | 10.00 | 6,819 | 78.9% |
| 9 | Mayfield | 11.00 | 9,868 | 77.6% |
| 10 | Hazard | 12.00 | 5,008 | 76.5% |
| 11 | Princeton | 13.00 | 6,241 | 76.3% |
| 12 | Campbellsville | 14.00 | 11,622 | 74.9% |
| 13 | Central City | 15.00 | 5,707 | 73.8% |
| 14 | Russellville | 16.00 | 7,316 | 73.4% |
| 15 | Madisonville | 17.00 | 19,515 | 73.3% |
| 17 | Hillview | 19.00 | 8,797 | 73.2% |
| 17 | Mount Washington | 19.00 | 18,480 | 73.2% |
| 17 | Shepherdsville | 19.00 | 14,533 | 73.2% |
| 19 | Glasgow | 21.00 | 15,197 | 73.1% |
| 20 | Lawrenceburg | 22.00 | 11,943 | 72.9% |
| 21 | Harrodsburg | 23.00 | 9,313 | 72.5% |
| 22 | Flatwoods | 24.00 | 7,269 | 71.9% |
| 23 | Cynthiana | 25.00 | 6,458 | 71.5% |
| 24 | Mount Sterling | 26.00 | 7,551 | 70.1% |
| 25 | Maysville | 27.00 | 8,737 | 68.8% |
| 26 | Lebanon | 28.00 | 6,430 | 68.5% |
| 27 | Bardstown | 29.00 | 13,804 | 67.6% |
| 28 | Franklin | 30.00 | 10,360 | 67.4% |
| 30 | Union | 32.00 | 7,642 | 66.9% |
| 30 | Florence | 32.00 | 32,803 | 66.9% |
| 30 | Walton | 32.00 | 5,730 | 66.9% |
| 32 | Ashland | 34.00 | 21,295 | 65.8% |
| 33 | Winchester | 35.00 | 19,213 | 65.2% |
| 34 | Nicholasville | 36.50 | 32,197 | 65.1% |
| 34 | Wilmore | 36.50 | 6,057 | 65.1% |
| 36 | Paducah | 38.00 | 26,845 | 65.1% |
| 37 | Murray | 39.00 | 18,080 | 65.1% |
| 38 | Paris | 40.00 | 10,160 | 64.2% |
| 39 | Shelbyville | 41.00 | 17,668 | 63.9% |
| 40 | Hopkinsville | 42.50 | 30,906 | 63.2% |
| 40 | Oak Grove | 42.50 | 7,962 | 63.2% |
| 42 | Owensboro | 44.00 | 60,302 | 63.0% |
| 43 | Berea | 45.50 | 15,786 | 62.3% |
| 43 | Richmond | 45.50 | 37,111 | 62.3% |
| 45 | Henderson | 47.00 | 27,852 | 61.5% |
| 46 | Georgetown | 48.00 | 39,117 | 61.4% |
| 47 | Danville | 49.00 | 17,327 | 61.3% |
| 49 | Vine Grove | 51.00 | 6,830 | 61.0% |
| 49 | Elizabethtown | 51.00 | 32,576 | 61.0% |
| 49 | Radcliff | 51.00 | 22,864 | 61.0% |
| 51 | Crestwood | 53.50 | 6,356 | 59.7% |
| 51 | La Grange | 53.50 | 10,311 | 59.7% |
| 53 | Morehead | 55.00 | 6,870 | 59.6% |
| 58 | Edgewood | 60.50 | 8,447 | 58.6% |
| 58 | Taylor Mill | 60.50 | 6,937 | 58.6% |
| 58 | Fort Mitchell | 60.50 | 8,713 | 58.6% |
| 58 | Villa Hills | 60.50 | 7,480 | 58.6% |
| 58 | Covington | 60.50 | 41,110 | 58.6% |
| 58 | Elsmere | 60.50 | 9,205 | 58.6% |
| 58 | Independence | 60.50 | 29,392 | 58.6% |
| 58 | Fort Wright | 60.50 | 5,887 | 58.6% |
| 58 | Erlanger | 60.50 | 19,875 | 58.6% |
| 66 | Highland Heights | 69.00 | 6,444 | 58.3% |
| 66 | Fort Thomas | 69.00 | 17,169 | 58.3% |
| 66 | Bellevue | 69.00 | 5,636 | 58.3% |
| 66 | Alexandria | 69.00 | 10,562 | 58.3% |
| 66 | Cold Spring | 69.00 | 6,341 | 58.3% |
| 66 | Newport | 69.00 | 13,967 | 58.3% |
| 66 | Dayton | 69.00 | 5,743 | 58.3% |
| 70 | Bowling Green | 73.00 | 75,388 | 57.4% |
| 71 | Versailles | 74.00 | 10,492 | 55.0% |
| 72 | Frankfort | 75.00 | 28,503 | 49.5% |
| 76 | Lyndon | 79.00 | 11,030 | 39.0% |
| 76 | Louisville/Jefferson County metro government (balance) | 79.00 | 631,818 | 39.0% |
| 76 | Jeffersontown | 79.00 | 29,199 | 39.0% |
| 76 | Douglass Hills | 79.00 | 5,474 | 39.0% |
| 76 | Shively | 79.00 | 15,638 | 39.0% |
| 76 | St. Matthews | 79.00 | 17,577 | 39.0% |
| 76 | Middletown | 79.00 | 9,763 | 39.0% |
| 80 | Lexington-Fayette urban county | 83.00 | 323,725 | 38.5% |
Source: county-level 2020 election results, U.S. Census ACS 2020-2024. 80 cities with more than 5,000 residents.
Summary
Summing Up The Conservative Strongholds in Kentucky
Well, there you have it, the places in Kentucky that have the highest number of conservatives per capita, with Corbin ranking as the most conservative in the entire state.
The most conservative cities in Kentucky are Corbin, London, Williamsburg, Middlesborough, Somerset, Monticello, Pikeville, Leitchfield, Mayfield, and Hazard.
If you’re curious, here are the least conservative cities in Kentucky. Not sold on Kentucky? Take the two-minute Find Your Place quiz and see which state actually fits you.


