Racial diversity in New Hampshire is a mixed bag.
There are parts of New Hampshire where there’s a high level of diversity. But where will you find the most diverse places in New Hampshire?
To answer that question, we went to the US Census data. Using Saturday Night Science, we measured the Gini coefficient for all 26 cities in New Hampshire to rank them from most to least diverse.
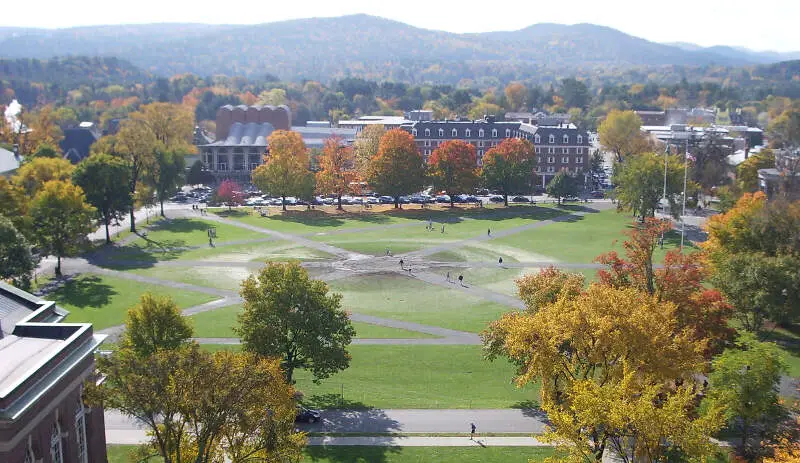
#1 most diverse in New Hampshire
Hanover is a town along the Connecticut River in Grafton County, New Hampshire, United States. The population was 11,260 at the 2010 census. CNN and Money magazine rated Hanover the sixth best place to live in America in 2011, and the second best in 2007. “This just might be the best college town,” read the headline of a story in the January-February 2017 issue of Yankee.
Data | Crime | Cost of living | Movers
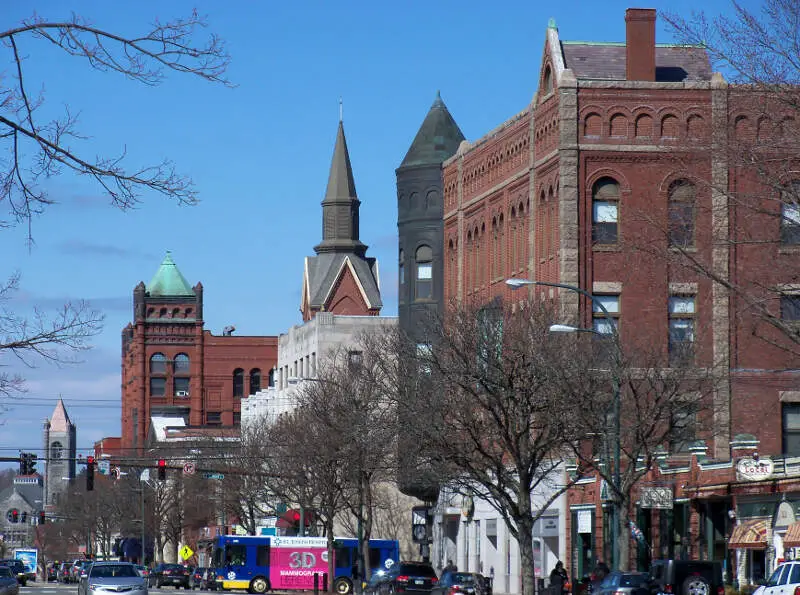
#2 most diverse in New Hampshire
Nashua is a city in Hillsborough County, New Hampshire, United States. As of the 2010 census, Nashua had a total population of 86,494, making it the second-largest city in the state after Manchester. As of 2016 the population had risen to an estimated 87,882.
Data | Crime | Cost of living | Movers
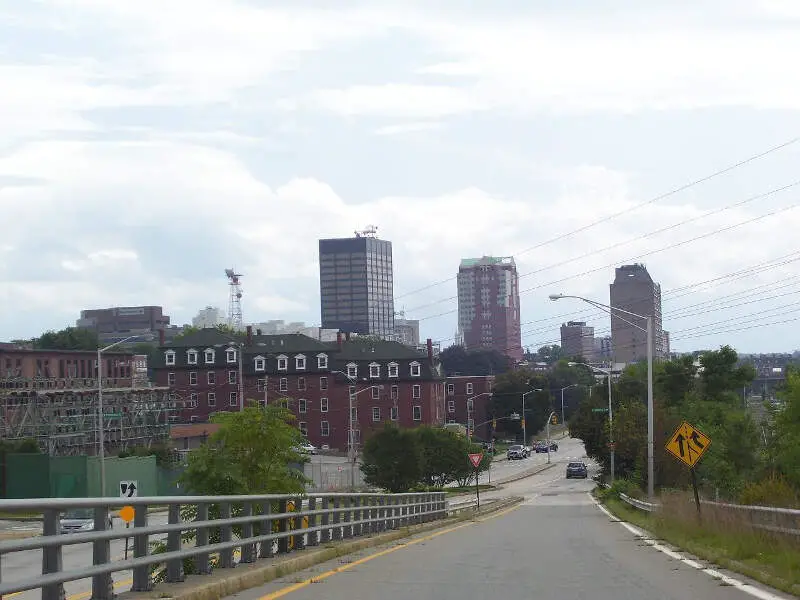
#3 most diverse in New Hampshire
Manchester is the most populous city in the U.S. state of New Hampshire and the largest city in northern New England, an area comprising the states of Maine, New Hampshire, and Vermont. As of the 2010 census, the city had a population of 109,565, and its estimated 2016 population was 110,506. It is one of two seats of Hillsborough County, the state of New Hampshire’s most populous county. Manchester is located near the northern end of the Northeast megalopolis, along the banks of the Merrimack River-which divides the city into eastern and western sections. It was first named by the merchant and inventor Samuel Blodgett. Blodget’s vision was to create a great industrial center similar to that of the original Manchester in England, which was the world’s first industrialized city.
Data | Crime | Cost of living | Movers
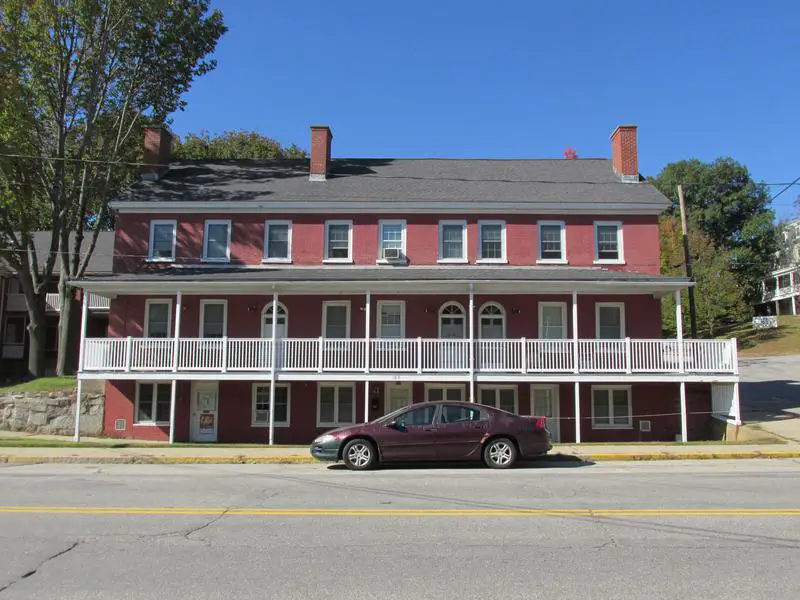
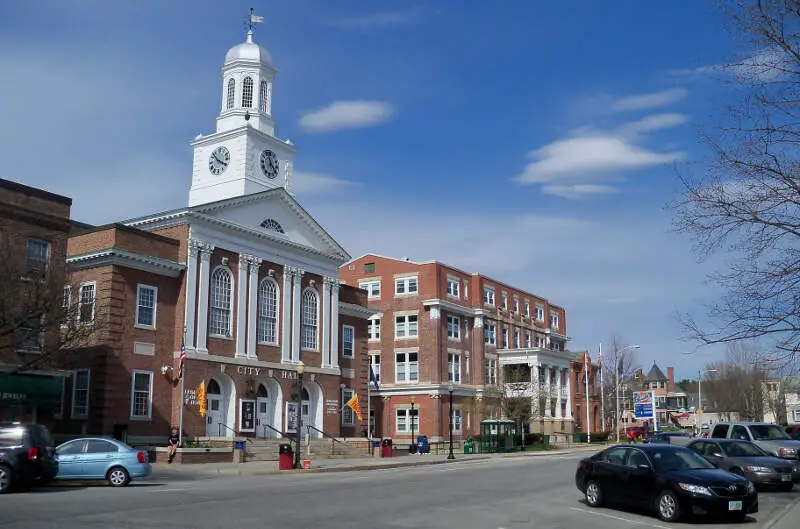
#4 most diverse in New Hampshire
Somersworth is a city in Strafford County, New Hampshire, United States. The population was 11,766 at the 2010 census. Somersworth has the smallest area and third-lowest population of New Hampshire’s 13 cities.
Data | Crime | Cost of living | Movers
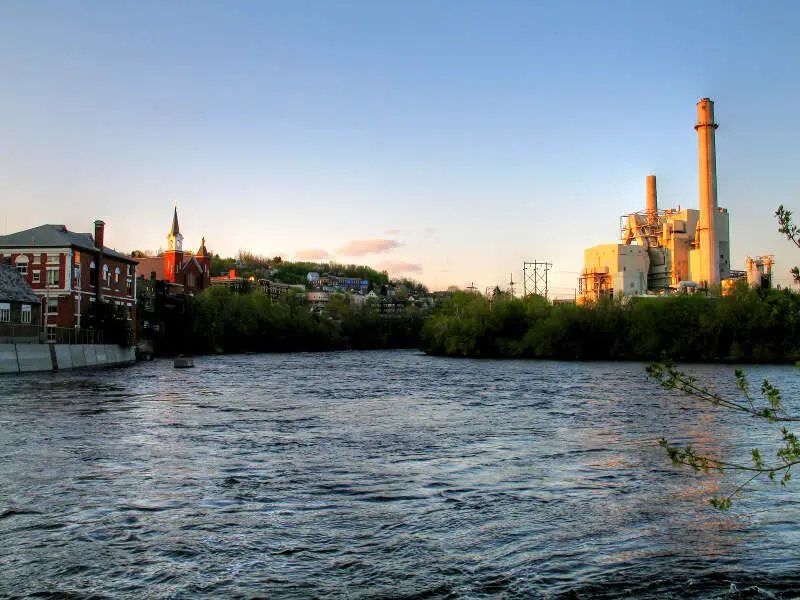
#5 most diverse in New Hampshire
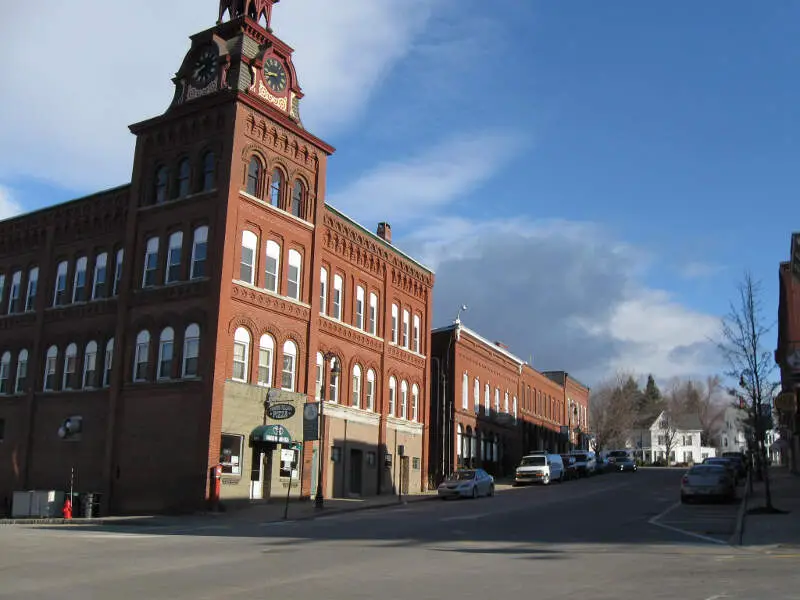
Berlin is a city along the Androscoggin River in Cos County in northern New Hampshire, United States. The population was 10,051 at the 2010 census. It includes the village of Cascade. Located on the edge of the White Mountains, the city’s boundaries extend into the White Mountain National Forest. Berlin is home to the Berlin and Cos County Historical Society’s Moffett House Museum & Genealogy Center, Service Credit Union Heritage Park, the Berlin Fish Hatchery, and the White Mountains Community College, member of the Community College System of New Hampshire.
Data | Crime | Cost of living | Movers
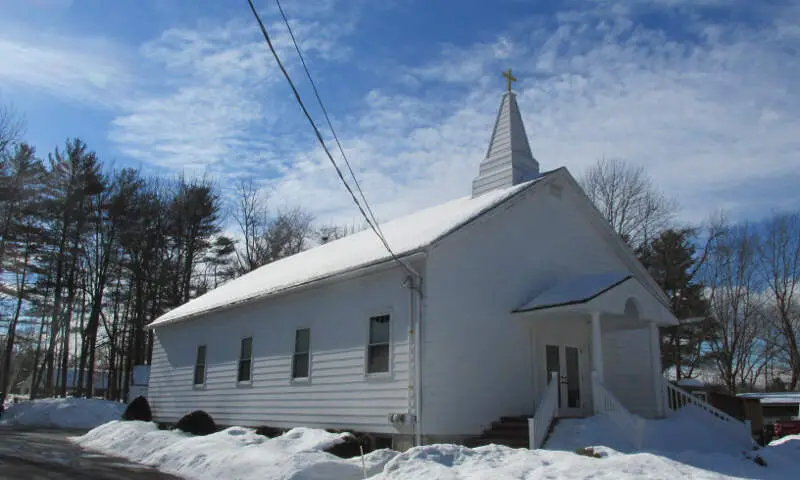
#6 most diverse in New Hampshire
Lebanon locally is a city in Grafton County, New Hampshire, United States. The population was 13,151 at the 2010 census and an estimated 13,513 as of 2016. Lebanon is located in western New Hampshire, south of Hanover, near the Connecticut River. It is the home to Dartmouth-Hitchcock Medical Center and Dartmouth Medical School, together comprising the largest medical facility between Boston, Massachusetts and Burlington, Vermont.
Data | Crime | Cost of living | Movers
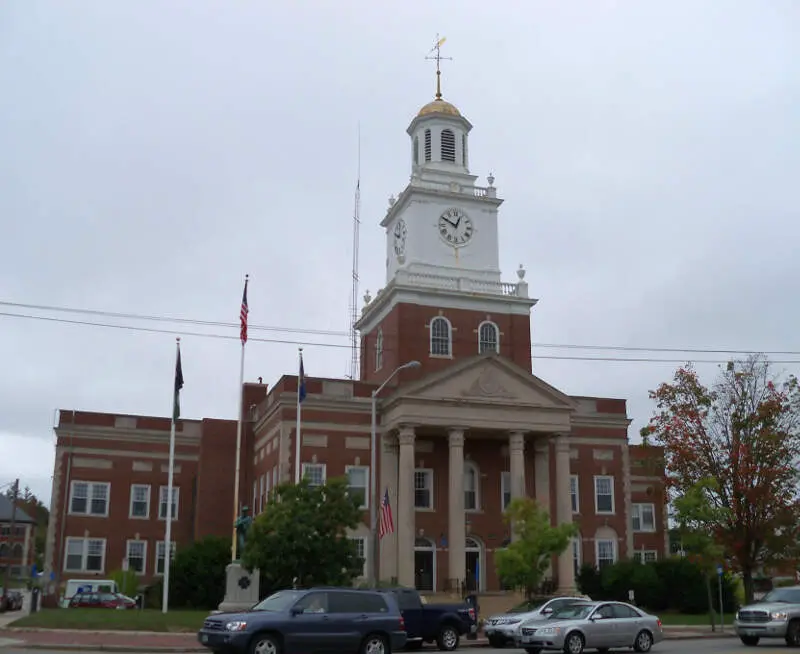
#7 most diverse in New Hampshire
Dover is a city in Strafford County, New Hampshire, United States. The population was 29,987 at the 2010 census, the largest in the New Hampshire Seacoast region. The population was estimated at 31,153 in 2016. It is the county seat of Strafford County, and home to Wentworth-Douglass Hospital, the Woodman Institute Museum, and the Children’s Museum of New Hampshire.
Data | Crime | Cost of living | Movers
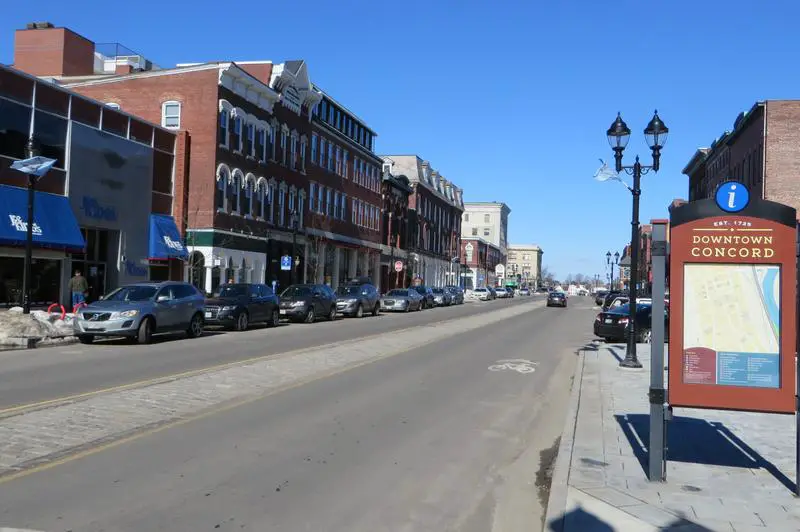
#8 most diverse in New Hampshire
Concord is the capital city of the U.S. state of New Hampshire and the county seat of Merrimack County. As of the 2010 census, its population was 42,695.
Data | Crime | Cost of living | Movers
#9 most diverse in New Hampshire
Data | Movers
#10 most diverse in New Hampshire
Data | Crime | Cost of living | Movers
The receipts
Compare the top ten
Pick a metric. The bars rescale. The red line is New Hampshire’s statewide median.
On the map
Where diversity lives in New Hampshire
Saturday Night Science
Methodology: How we determined the most diverse cities in New Hampshire for 2026
We still believe in the accuracy of data — especially from the Census — and Saturday Night Science. So that’s where we went to get the race breakdown across New Hampshire.
That leads us to the Census’s most recently available data, the 2020-2024 American Community Survey data from the US Census.
Specifically, we looked at table B03002: HISPANIC OR LATINO ORIGIN BY RACE. Here are the category names as defined by the Census:
- White alone*
- Black or African American alone*
- American Indian and Alaska Native alone*
- Asian alone*
- Native Hawaiian and Other Pacific Islander alone*
- Some other race alone*
- Two or more races*
- Hispanic or Latino
We limited our analysis to non-CDPs with a population greater than 5,000 people. That left us with 26 cities.
We then calculated the HHI for each city by finding the racial breakdown of a city in percent terms, squaring them, and then adding the squares together. This left us with scores ranging from 5,034 (Hanover) to 8,970 (Franklin).
Finally, we ranked each city based on the HHI, with a lower score being more diverse than a high score. Hanover took the distinction of being the most diverse, while Franklin was the least diverse city.
We updated this article for 2026. This report is our eleventh time ranking the most diverse places in New Hampshire.
The full plate
Race By City In New Hampshire For 2026
Click any column to sort. Search by city name.
| Rank | City | Population | HHI | % White | % Black | % Hispanic | % Asian |
|---|---|---|---|---|---|---|---|
| 1 | Hanover | 8,479 | 5,034 | 69.0% | 3.3% | 6.7% | 13.6% |
| 2 | Nashua | 91,294 | 5,144 | 69.5% | 2.8% | 14.7% | 8.3% |
| 3 | Manchester | 115,643 | 5,479 | 72.3% | 4.2% | 13.8% | 4.1% |
| 4 | Somersworth | 12,111 | 7,005 | 83.2% | 2.2% | 6.0% | 2.6% |
| 5 | Berlin | 9,383 | 7,094 | 83.8% | 6.3% | 4.7% | 0.1% |
| 6 | Lebanon | 14,999 | 7,189 | 84.3% | 0.7% | 3.1% | 6.7% |
| 7 | Dover | 33,364 | 7,328 | 85.3% | 1.2% | 3.5% | 4.8% |
| 8 | Concord | 44,375 | 7,355 | 85.5% | 3.7% | 3.7% | 2.9% |
| 9 | Suncook | 5,432 | 7,384 | 85.5% | 2.7% | 7.2% | 0.9% |
| 10 | South Hooksett | 5,902 | 7,464 | 86.1% | 1.5% | 3.7% | 2.3% |
| 11 | Portsmouth | 22,545 | 7,478 | 86.2% | 0.2% | 3.8% | 4.1% |
| 12 | Durham | 10,681 | 7,495 | 86.2% | 0.2% | 5.4% | 4.5% |
| 13 | Exeter | 9,964 | 7,569 | 86.7% | 1.1% | 3.4% | 5.1% |
| 14 | East Merrimack | 5,081 | 7,802 | 88.1% | 0.9% | 3.2% | 2.9% |
| 15 | Hooksett | 5,876 | 7,889 | 88.5% | 0.2% | 2.1% | 3.5% |
| 16 | Claremont | 13,078 | 7,941 | 88.9% | 1.8% | 4.1% | 0.2% |
| 17 | Derry | 21,339 | 8,032 | 89.4% | 0.1% | 4.5% | 2.8% |
| 18 | Newmarket | 5,679 | 8,059 | 89.5% | 0.9% | 1.5% | 1.9% |
| 19 | Milford | 8,956 | 8,066 | 89.6% | 0.8% | 3.3% | 1.9% |
| 20 | Laconia | 17,085 | 8,084 | 89.8% | 0.2% | 3.5% | 1.5% |
| 21 | Rochester | 33,144 | 8,329 | 91.1% | 1.1% | 2.2% | 1.4% |
| 22 | Keene | 22,939 | 8,373 | 91.4% | 1.7% | 1.9% | 0.7% |
| 23 | Londonderry | 12,225 | 8,397 | 91.5% | 0.4% | 5.3% | 0.4% |
| 24 | Hudson | 7,469 | 8,451 | 91.8% | 4.8% | 1.2% | 0.1% |
| 25 | Hampton | 10,101 | 8,914 | 94.4% | 0.0% | 2.0% | 1.4% |
| 26 | Franklin | 8,799 | 8,970 | 94.6% | 0.3% | 0.2% | 0.3% |
Source: U.S. Census ACS 2020-2024. 26 cities with more than 5,000 residents.
Summary
Summary: Diversity Across New Hampshire
If you’re looking for a scientific breakdown of diversity across New Hampshire, this is an accurate list.
The most diverse cities in New Hampshire are Hanover, Nashua, Manchester, Somersworth, Berlin, Lebanon, Dover, Concord, Suncook, and South Hooksett. Not sold on New Hampshire? Take the two-minute Find Your Place quiz and see which state actually fits you.
Questions and answers
Most Diverse Cities In New Hampshire FAQs
What is the most diverse city in New Hampshire?
Hanover is the most diverse city in New Hampshire for 2026, posting the lowest diversity index (5,034) of the 26 places we measured. Nashua and Manchester are next.
What are the 10 most diverse cities in New Hampshire?
The ten most diverse cities in New Hampshire are Hanover, Nashua, Manchester, Somersworth, Berlin, Lebanon, Dover, Concord, Suncook, and South Hooksett. We ranked all 26 places with more than 5,000 residents by their racial-diversity HHI.
How do you measure diversity?
We use a Herfindahl-Hirschman Index (HHI) across each city’s White, Black, Hispanic, and Asian population shares from the Census American Community Survey. A lower score means the mix is more even, so the lowest HHI wins.
What is the least diverse city in New Hampshire?
Franklin is the least diverse city in New Hampshire, with a diversity index of 8,970. That means one group makes up most of its population.
Where does this data come from?
All population shares come from the Census Bureau’s American Community Survey (2020-2024). Diversity scores in New Hampshire range from 5,034 in Hanover to 8,970 in Franklin.


