Racial diversity in Oklahoma is a mixed bag.
There are parts of Oklahoma where there’s a high level of diversity. But where will you find the most diverse places in Oklahoma?
To answer that question, we went to the US Census data. Using Saturday Night Science, we measured the Gini coefficient for all 74 cities in Oklahoma to rank them from most to least diverse.
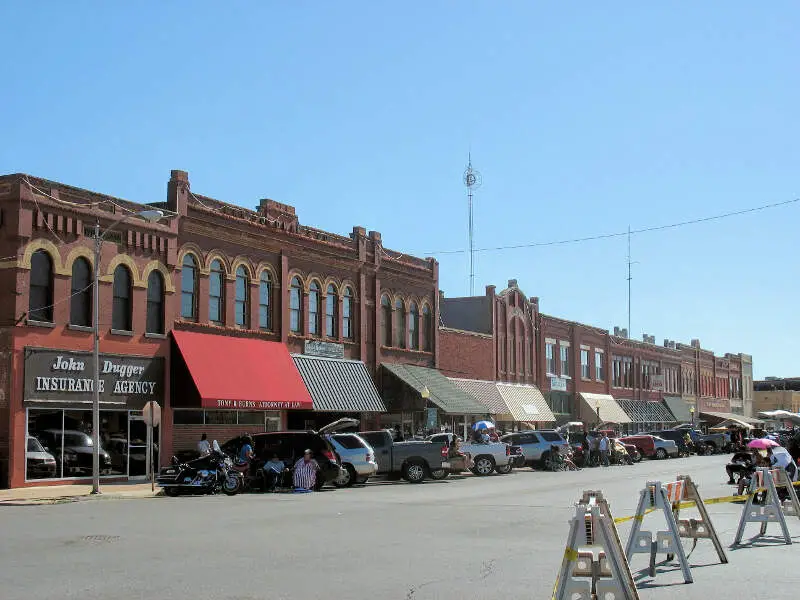
#1 most diverse in Oklahoma
Anadarko is a city in Caddo County, Oklahoma, United States. This city is fifty miles southwest of Oklahoma City. The population was 6,762 at the 2010 census, a 1.8 percent gain from 6,645 at the 2000 census. It is the county seat of Caddo County.
Data | Crime | Cost of living | Movers
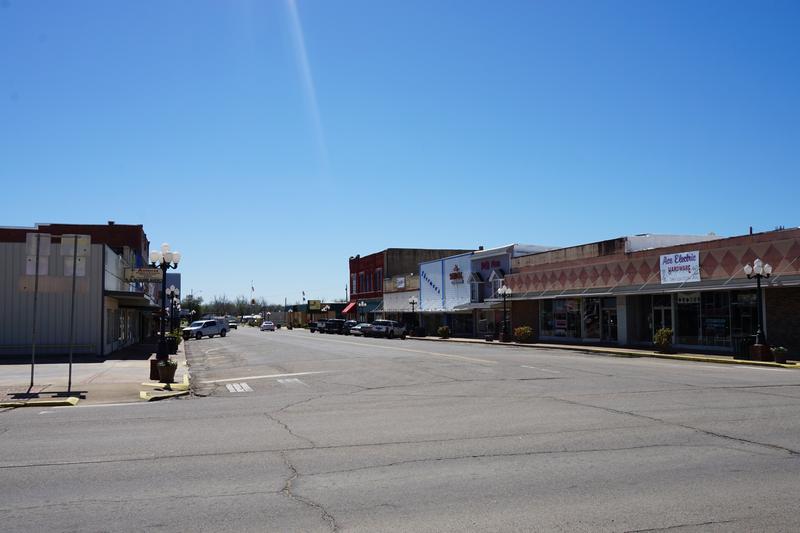
#2 most diverse in Oklahoma
Hugo is a city and county seat of Choctaw County, Oklahoma, United States. It is located in southeastern Oklahoma about 9 miles north of the Texas state line. As of the 2010 census, the city population was 5,310.
Data | Crime | Cost of living | Movers
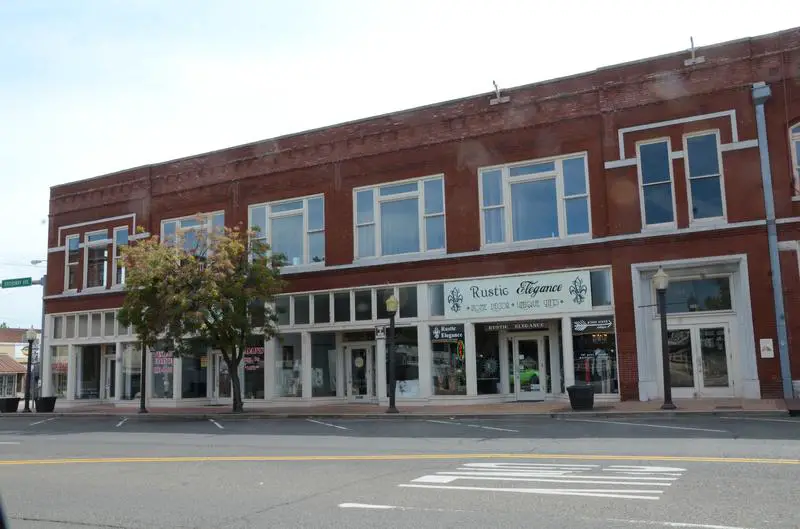
#3 most diverse in Oklahoma
Muskogee is a city in and the county seat of Muskogee County, Oklahoma, United States. Home to Bacone College, it lies approximately 48 miles southeast of Tulsa. The population of the city was 39,223 as of the 2010 census, a 2.4 percent increase from 38,310 at the 2000 census, making it the eleventh-largest city in Oklahoma.
Data | Crime | Cost of living | Movers
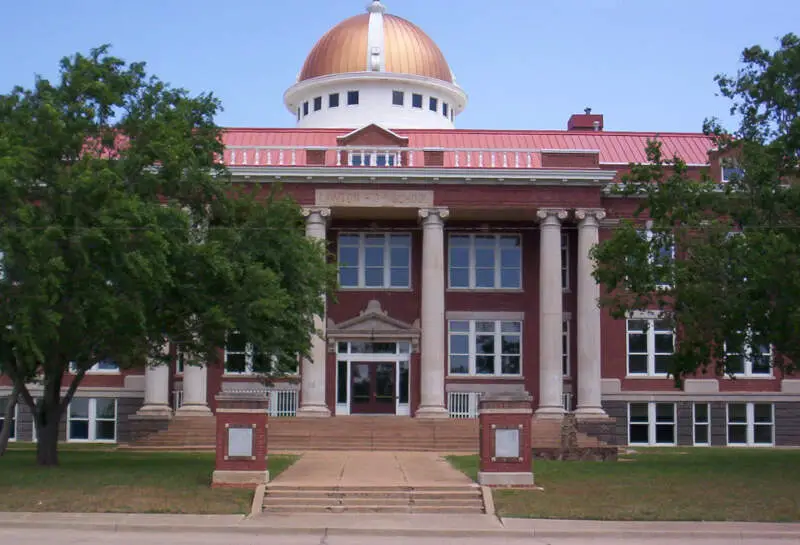
#4 most diverse in Oklahoma
The city of Lawton is the county seat of Comanche County, in the State of Oklahoma. Located in southwestern Oklahoma, about 87mi southwest of Oklahoma City, it is the principal city of the Lawton, Oklahoma Metropolitan Statistical Area. According to the 2010 census, Lawton’s population was 96,867, making it the fifth-largest city in the state.
Data | Crime | Cost of living | Movers
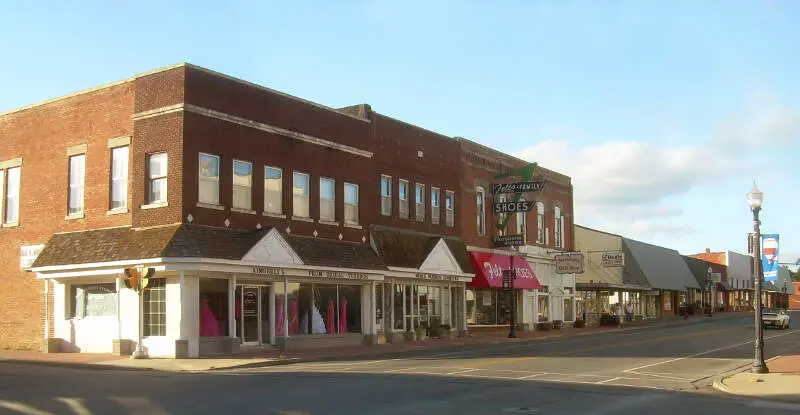
#5 most diverse in Oklahoma
Tahlequah is a city in Cherokee County, Oklahoma, United States located at the foothills of the Ozark Mountains. It is part of the Green Country region of Oklahoma and was established as a capital of the 19th-century Cherokee Nation in 1839, as part of the new settlement in Indian Territory after the Cherokee Native Americans were forced west from the American Southeast on the Trail of Tears.
Data | Crime | Cost of living | Movers
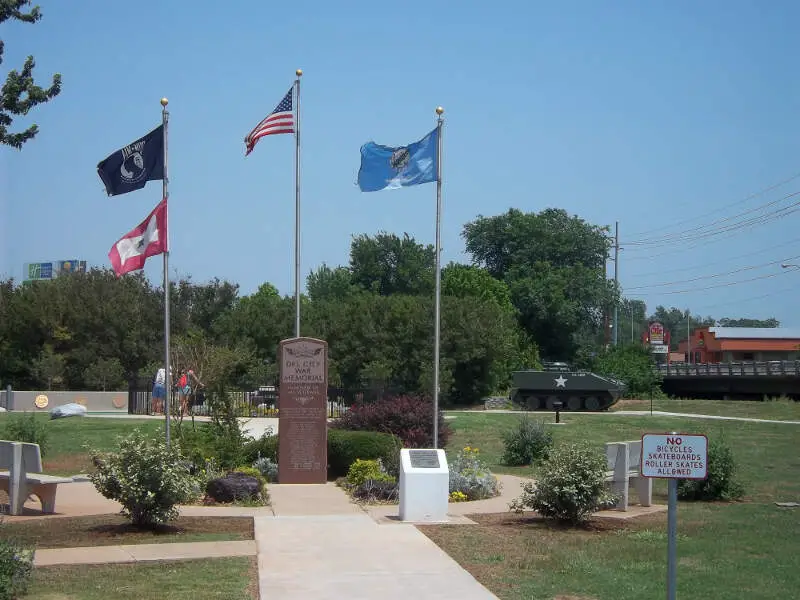
#6 most diverse in Oklahoma
Del City is a city in Oklahoma County, Oklahoma, United States, and a part of the Oklahoma City metropolitan area. The population was 21,332 at the 2010 census.
Data | Crime | Cost of living | Movers

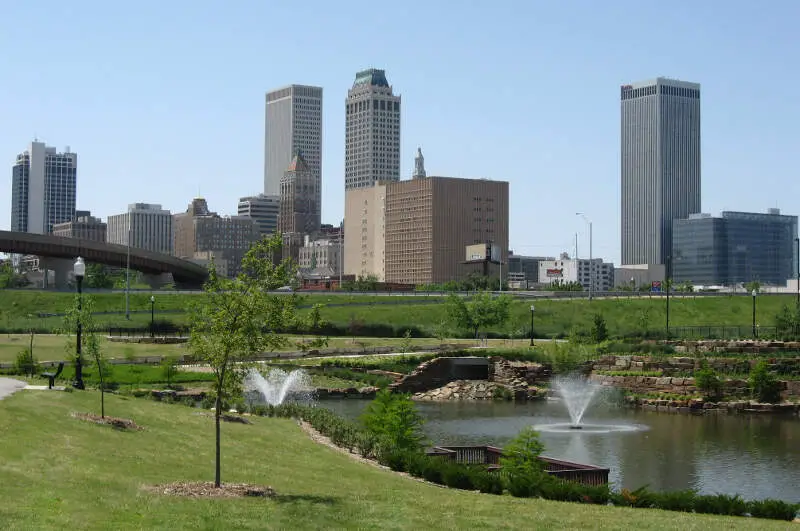
#7 most diverse in Oklahoma
Tulsa is the second-largest city in the state of Oklahoma and 47th-most populous city in the United States. As of July 2015, the population was 403,505, an increase of 11,599 over that reported in the 2010 Census. It is the principal municipality of the Tulsa Metropolitan Area, a region with 981,005 residents in the MSA and 1,151,172 in the CSA. The city serves as the county seat of Tulsa County, the most densely populated county in Oklahoma, with urban development extending into Osage, Rogers, and Wagoner counties.
Data | Crime | Cost of living | Movers | Compare

#8 most diverse in Oklahoma
Idabel is a city in and county seat of McCurtain County, Oklahoma, United States. The population was 7,010 at the 2010 census. It is located in the southeast corner of Oklahoma, a tourist area known as Kiamichi Country.
Data | Crime | Cost of living | Movers
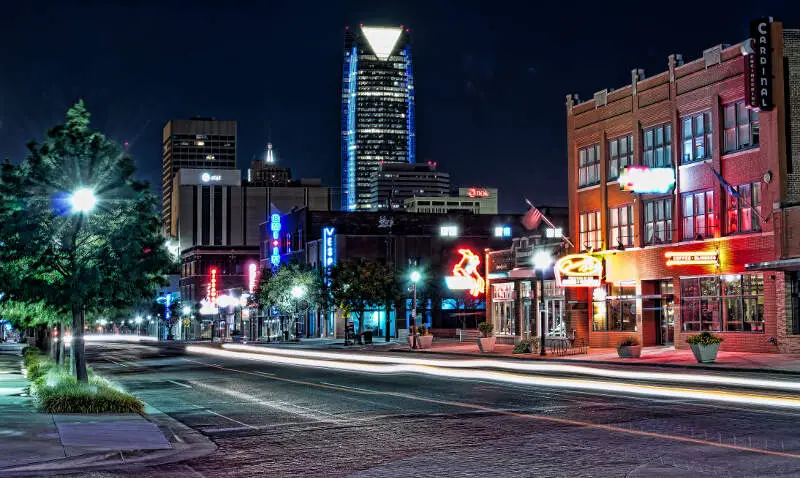
#9 most diverse in Oklahoma
Oklahoma City is the capital and largest city of the U.S. state of Oklahoma. The county seat of Oklahoma County, the city ranks 27th among United States cities in population. The population grew following the 2010 Census, with the population estimated to have increased to 631,346 as of July 2015. As of 2015, the Oklahoma City metropolitan area had a population of 1,358,452, and the Oklahoma City-Shawnee Combined Statistical Area had a population of 1,459,758 residents, making it Oklahoma’s largest metropolitan area.
Data | Crime | Cost of living | Movers | Compare
#10 most diverse in Oklahoma
Okmulgee is a city in Okmulgee County, Oklahoma, United States. The population at the 2010 census was 12,321, a loss of 5.4 percent since the 2000 census figure of 13,022. It has been the capital of the Muscogee Nation since the United States Civil War. The name is from the Creek word oki mulgee which means “boiling waters” in English. Other translations put it as “babbling brook” or ‘Effluvium’. The site was chosen because of the nearby rivers and springs. Okmulgee is 38 miles south of Tulsa and 13 miles north of Henryetta via US-75.
Data | Crime | Cost of living | Movers
The receipts
Compare the top ten
Pick a metric. The bars rescale. The red line is Oklahoma’s statewide median.
On the map
Where diversity lives in Oklahoma
Saturday Night Science
Methodology: How we determined the most diverse cities in Oklahoma for 2026
We still believe in the accuracy of data — especially from the Census — and Saturday Night Science. So that’s where we went to get the race breakdown across Oklahoma.
That leads us to the Census’s most recently available data, the 2020-2024 American Community Survey data from the US Census.
Specifically, we looked at table B03002: HISPANIC OR LATINO ORIGIN BY RACE. Here are the category names as defined by the Census:
- White alone*
- Black or African American alone*
- American Indian and Alaska Native alone*
- Asian alone*
- Native Hawaiian and Other Pacific Islander alone*
- Some other race alone*
- Two or more races*
- Hispanic or Latino
We limited our analysis to non-CDPs with a population greater than 5,000 people. That left us with 74 cities.
We then calculated the HHI for each city by finding the racial breakdown of a city in percent terms, squaring them, and then adding the squares together. This left us with scores ranging from 2,394 (Anadarko) to 6,861 (Blanchard).
Finally, we ranked each city based on the HHI, with a lower score being more diverse than a high score. Anadarko took the distinction of being the most diverse, while Blanchard was the least diverse city.
We updated this article for 2026. This report is our eleventh time ranking the most diverse places in Oklahoma.
The full plate
Race By City In Oklahoma For 2026
Click any column to sort. Search by city name.
| Rank | City | Population | HHI | % White | % Black | % Hispanic | % Asian |
|---|---|---|---|---|---|---|---|
| 1 | Anadarko | 5,572 | 2,394 | 27.2% | 7.0% | 20.4% | 0.0% |
| 2 | Hugo | 5,182 | 2,725 | 43.5% | 19.3% | 9.3% | 0.1% |
| 3 | Muskogee | 36,758 | 3,016 | 48.7% | 14.9% | 9.4% | 1.0% |
| 4 | Lawton | 90,595 | 3,026 | 48.2% | 17.5% | 16.4% | 3.1% |
| 5 | Tahlequah | 16,935 | 3,176 | 45.4% | 2.4% | 9.8% | 0.8% |
| 6 | Del City | 21,494 | 3,212 | 49.3% | 21.3% | 14.6% | 0.9% |
| 7 | Tulsa | 413,794 | 3,221 | 50.5% | 13.7% | 19.8% | 3.4% |
| 8 | Idabel | 6,987 | 3,224 | 50.7% | 16.8% | 15.8% | 0.4% |
| 9 | Oklahoma City | 697,125 | 3,246 | 50.1% | 13.1% | 22.1% | 4.5% |
| 10 | Okmulgee | 11,348 | 3,332 | 51.8% | 14.2% | 3.7% | 0.7% |
| 11 | Holdenville | 5,902 | 3,341 | 52.5% | 11.1% | 8.0% | 0.5% |
| 12 | Catoosa | 7,496 | 3,570 | 54.5% | 1.6% | 16.0% | 2.1% |
| 13 | Bethany | 20,560 | 3,666 | 53.3% | 11.0% | 25.3% | 0.8% |
| 14 | Clinton | 8,388 | 3,736 | 45.0% | 5.2% | 40.6% | 0.4% |
| 15 | Warr Acres | 10,466 | 3,781 | 43.1% | 6.7% | 43.1% | 2.1% |
| 16 | Midwest City | 58,297 | 3,823 | 56.9% | 20.3% | 7.7% | 1.7% |
| 17 | Vinita | 5,300 | 3,868 | 57.8% | 4.5% | 5.6% | 2.2% |
| 18 | Ada | 16,575 | 3,905 | 58.2% | 5.1% | 8.1% | 1.5% |
| 19 | Sallisaw | 8,605 | 3,925 | 57.2% | 1.6% | 6.0% | 0.2% |
| 20 | Ardmore | 24,877 | 3,987 | 60.2% | 8.9% | 11.4% | 1.9% |
| 21 | Seminole | 7,194 | 4,024 | 59.0% | 4.6% | 6.0% | 0.1% |
| 22 | Altus | 18,646 | 4,118 | 57.2% | 7.2% | 27.8% | 2.2% |
| 23 | El Reno | 18,557 | 4,140 | 59.5% | 6.6% | 22.2% | 0.5% |
| 24 | Miami | 12,926 | 4,171 | 60.7% | 2.1% | 6.7% | 1.0% |
| 25 | Jenks | 27,102 | 4,178 | 62.1% | 3.1% | 8.8% | 10.3% |
| 26 | Glenpool | 14,151 | 4,264 | 62.8% | 3.8% | 9.8% | 4.2% |
| 27 | Pauls Valley | 6,062 | 4,302 | 61.0% | 3.5% | 21.8% | 0.7% |
| 28 | Wagoner | 8,082 | 4,304 | 62.3% | 6.8% | 4.5% | 0.1% |
| 29 | Broken Arrow | 118,180 | 4,388 | 63.9% | 5.5% | 12.0% | 4.7% |
| 30 | McAlester | 18,111 | 4,415 | 63.8% | 4.9% | 7.4% | 0.7% |
| 31 | Durant | 19,746 | 4,435 | 63.7% | 2.3% | 9.9% | 0.9% |
| 32 | Claremore | 20,166 | 4,511 | 64.0% | 2.1% | 7.7% | 0.7% |
| 33 | Guymon | 12,539 | 4,518 | 26.3% | 7.9% | 61.3% | 1.0% |
| 34 | Owasso | 40,151 | 4,611 | 65.7% | 3.4% | 11.7% | 2.2% |
| 35 | Poteau | 8,959 | 4,636 | 65.3% | 1.3% | 15.2% | 1.1% |
| 36 | Pryor Creek | 9,569 | 4,651 | 64.8% | 0.4% | 5.2% | 0.3% |
| 37 | Moore | 63,420 | 4,700 | 66.4% | 5.5% | 13.1% | 3.2% |
| 38 | Guthrie | 11,243 | 4,702 | 66.1% | 12.9% | 11.1% | 0.6% |
| 39 | Henryetta | 5,608 | 4,739 | 65.5% | 0.3% | 7.1% | 0.0% |
| 40 | Tecumseh | 6,332 | 4,852 | 66.9% | 2.8% | 4.2% | 0.0% |
| 41 | Shawnee | 31,671 | 4,863 | 67.8% | 3.9% | 6.8% | 1.2% |
| 42 | Ponca City | 24,326 | 4,866 | 67.8% | 2.9% | 10.4% | 0.7% |
| 43 | Enid | 50,653 | 4,892 | 67.4% | 2.6% | 16.5% | 1.5% |
| 44 | The Village | 9,447 | 4,897 | 68.0% | 9.7% | 8.1% | 1.2% |
| 45 | Purcell | 6,803 | 4,952 | 67.6% | 1.1% | 16.4% | 0.0% |
| 46 | Norman | 129,672 | 5,014 | 69.3% | 4.3% | 9.2% | 4.3% |
| 47 | Coweta | 10,433 | 5,024 | 68.7% | 5.3% | 3.5% | 0.0% |
| 48 | Collinsville | 8,878 | 5,025 | 69.4% | 2.6% | 6.1% | 3.9% |
| 49 | Sapulpa | 22,570 | 5,028 | 69.1% | 2.7% | 6.9% | 1.4% |
| 50 | Bartlesville | 37,878 | 5,248 | 71.0% | 3.3% | 7.2% | 2.2% |
| 51 | Stillwater | 49,269 | 5,280 | 71.4% | 4.5% | 5.9% | 6.4% |
| 52 | Kingfisher | 5,026 | 5,323 | 70.3% | 0.4% | 18.2% | 1.7% |
| 53 | Mustang | 22,192 | 5,335 | 71.7% | 3.5% | 11.0% | 1.9% |
| 54 | Chickasha | 16,539 | 5,414 | 72.2% | 5.5% | 8.7% | 0.1% |
| 55 | Woodward | 11,882 | 5,432 | 70.5% | 0.4% | 20.5% | 0.5% |
| 56 | Bixby | 30,155 | 5,435 | 72.4% | 2.0% | 8.1% | 3.0% |
| 57 | Cushing | 8,367 | 5,470 | 72.5% | 2.8% | 8.0% | 0.1% |
| 58 | Grove | 7,176 | 5,472 | 72.3% | 0.8% | 5.9% | 0.3% |
| 59 | Weatherford | 12,004 | 5,561 | 73.2% | 2.0% | 11.1% | 1.8% |
| 60 | Lone Grove | 5,125 | 5,614 | 73.5% | 2.1% | 5.9% | 0.0% |
| 61 | Blackwell | 6,042 | 5,635 | 73.3% | 0.6% | 11.1% | 0.0% |
| 62 | Piedmont | 8,342 | 5,678 | 73.7% | 3.7% | 13.7% | 0.2% |
| 63 | Duncan | 22,958 | 5,686 | 73.9% | 2.1% | 11.7% | 0.6% |
| 64 | Verdigris | 5,637 | 5,739 | 74.3% | 0.0% | 5.7% | 0.2% |
| 65 | Harrah | 6,684 | 5,757 | 74.9% | 3.2% | 7.8% | 2.5% |
| 66 | Edmond | 96,825 | 5,801 | 75.2% | 5.0% | 6.3% | 3.7% |
| 67 | Sand Springs | 20,117 | 5,820 | 75.2% | 1.9% | 6.7% | 0.6% |
| 68 | Elk City | 11,361 | 5,859 | 74.2% | 2.1% | 18.3% | 1.8% |
| 69 | Newcastle | 13,001 | 5,933 | 76.0% | 2.5% | 8.4% | 0.5% |
| 70 | Yukon | 25,529 | 5,964 | 76.3% | 4.3% | 7.7% | 1.6% |
| 71 | Noble | 7,493 | 6,160 | 77.5% | 1.9% | 5.0% | 0.8% |
| 72 | Choctaw | 12,303 | 6,447 | 79.5% | 0.9% | 7.4% | 2.0% |
| 73 | Tuttle | 8,040 | 6,519 | 80.0% | 0.4% | 6.1% | 0.5% |
| 74 | Blanchard | 9,215 | 6,861 | 82.3% | 0.7% | 4.9% | 0.9% |
Source: U.S. Census ACS 2020-2024. 74 cities with more than 5,000 residents.
Summary
Summary: Diversity Across Oklahoma
If you’re looking for a scientific breakdown of diversity across Oklahoma, this is an accurate list.
The most diverse cities in Oklahoma are Anadarko, Hugo, Muskogee, Lawton, Tahlequah, Del City, Tulsa, Idabel, Oklahoma City, and Okmulgee. Not sold on Oklahoma? Take the two-minute Find Your Place quiz and see which state actually fits you.
Questions and answers
Most Diverse Cities In Oklahoma FAQs
What is the most diverse city in Oklahoma?
Anadarko is the most diverse city in Oklahoma for 2026, posting the lowest diversity index (2,394) of the 74 places we measured. Hugo and Muskogee are next.
What are the 10 most diverse cities in Oklahoma?
The ten most diverse cities in Oklahoma are Anadarko, Hugo, Muskogee, Lawton, Tahlequah, Del City, Tulsa, Idabel, Oklahoma City, and Okmulgee. We ranked all 74 places with more than 5,000 residents by their racial-diversity HHI.
How do you measure diversity?
We use a Herfindahl-Hirschman Index (HHI) across each city’s White, Black, Hispanic, and Asian population shares from the Census American Community Survey. A lower score means the mix is more even, so the lowest HHI wins.
What is the least diverse city in Oklahoma?
Blanchard is the least diverse city in Oklahoma, with a diversity index of 6,861. That means one group makes up most of its population.
Where does this data come from?
All population shares come from the Census Bureau’s American Community Survey (2020-2024). Diversity scores in Oklahoma range from 2,394 in Anadarko to 6,861 in Blanchard.


