
Before you decide to relocate to Nevada, it’s important to research the exact cost of living around the state. And that’s what we’re going to help you do.
These are the places in Nevada that cost a pretty penny — the most expensive cities in the state.
We used Saturday Night Science to compare the 2020-2024 American Community Survey on cost of living for the 33 places in Nevada with more than 5,000 people.
After we saved up for months and could finally afford it, we landed on this list of the ten most expensive cities in Nevada for 2026.
Table Of Contents: Top Ten | Methodology | Summary | Table
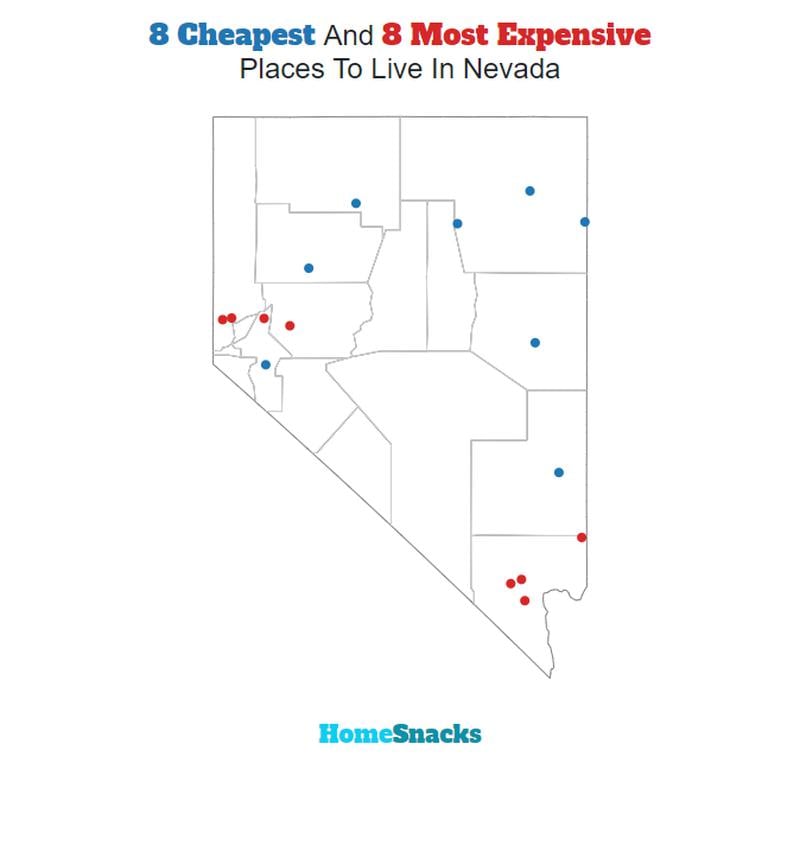
The 10 Most Expensive Places To Live In Nevada For 2026
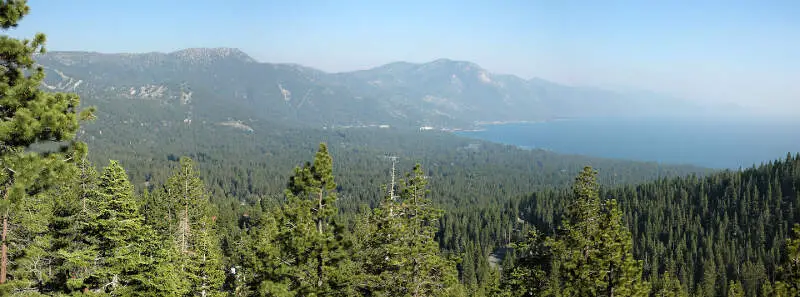
What’s the most expensive place to live in Nevada? Well, HomeSnacks crunched the numbers and discovered that Incline Village is the most expensive place to live in Nevada.
Laughlin (the cheapest place to live in Nevada) can show these guys how to live on a budget in the coming years. Read on for how these places had costs rise faster than inflation.
And if you already knew these places were expensive, check out some more reading about Nevada and the most expensive cities in the country:
The 10 Most Expensive Places To Live In Nevada For 2026
/10
Population: 9,272
Cost Of Living Index: 189
Median Income: $167,069
Average Home Price: $1,474,426
Home Price To Income Ratio: 8.8x
More on Incline Village: Data | Cost Of Living | Movers
The overall cost of living in Incline Village is 189. The median income in Incline Village comes in at $167,069 and the average home value is $1,474,426 for 2026.

/10
Population: 31,354
Cost Of Living Index: 142
Median Income: $117,035
Average Home Price: $690,105
Home Price To Income Ratio: 5.9x
More on Summerlin South: Data | Cost Of Living | Movers
The overall cost of living in Summerlin South is 142. The median income in Summerlin South comes in at $117,035 and the average home value is $690,105 for 2026.

/10
Population: 6,467
Cost Of Living Index: 141
Median Income: $121,458
Average Home Price: $784,219
Home Price To Income Ratio: 6.5x
More on Johnson Lane: Data | Cost Of Living | Movers
The overall cost of living in Johnson Lane is 141. The median income in Johnson Lane comes in at $121,458 and the average home value is $784,219 for 2026.

/10
Population: 17,980
Cost Of Living Index: 132
Median Income: $127,658
Average Home Price: $640,328
Home Price To Income Ratio: 5.0x
More on Spanish Springs: Data | Cost Of Living | Movers
The overall cost of living in Spanish Springs is 132. The median income in Spanish Springs comes in at $127,658 and the average home value is $640,328 for 2026.

/10
Population: 332,141
Cost Of Living Index: 127
Median Income: $90,138
Average Home Price: $486,156
Home Price To Income Ratio: 5.4x
More on Henderson: Data | Crime | Cost Of Living | Movers
The overall cost of living in Henderson is 127. The median income in Henderson comes in at $90,138 and the average home value is $486,156 for 2026.

/10
Population: 273,212
Cost Of Living Index: 125
Median Income: $80,760
Average Home Price: $567,856
Home Price To Income Ratio: 7.0x
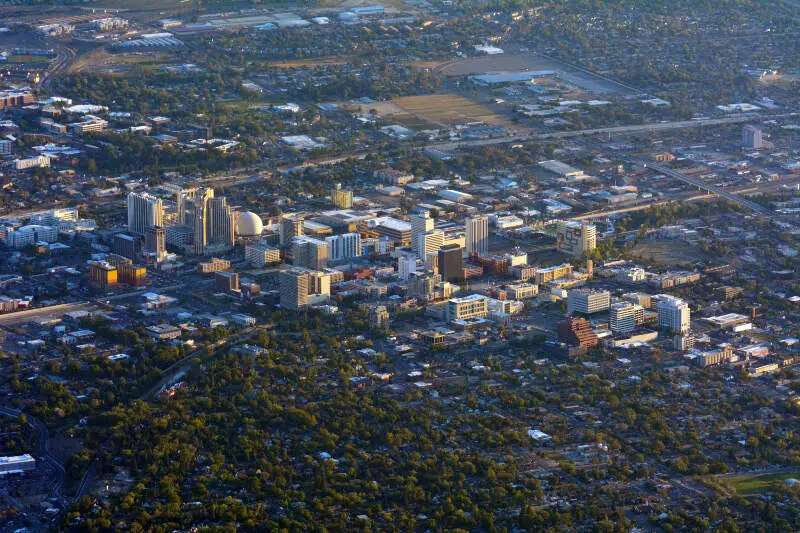
More on Reno: Data | Crime | Cost Of Living | Movers
The overall cost of living in Reno is 125. The median income in Reno comes in at $80,760 and the average home value is $567,856 for 2026.

/10
Population: 5,527
Cost Of Living Index: 124
Median Income: $78,278
Average Home Price: $496,539
Home Price To Income Ratio: 6.3x
More on Indian Hills: Data | Cost Of Living | Movers
The overall cost of living in Indian Hills is 124. The median income in Indian Hills comes in at $78,278 and the average home value is $496,539 for 2026.

/10
Population: 110,024
Cost Of Living Index: 123
Median Income: $89,056
Average Home Price: $529,282
Home Price To Income Ratio: 5.9x
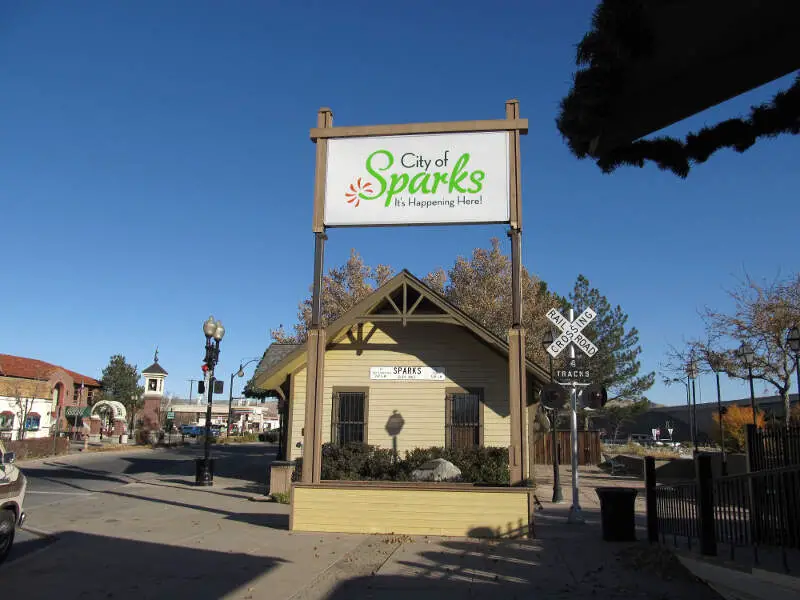
More on Sparks: Data | Crime | Cost Of Living | Movers
The overall cost of living in Sparks is 123. The median income in Sparks comes in at $89,056 and the average home value is $529,282 for 2026.

/10
Population: 12,114
Cost Of Living Index: 122
Median Income: $87,785
Average Home Price: $498,797
Home Price To Income Ratio: 5.7x
More on Gardnerville Ranchos: Data | Cost Of Living | Movers
The overall cost of living in Gardnerville Ranchos is 122. The median income in Gardnerville Ranchos comes in at $87,785 and the average home value is $498,797 for 2026.

/10
Population: 240,464
Cost Of Living Index: 120
Median Income: $98,462
Average Home Price: $488,020
Home Price To Income Ratio: 5.0x
More on Enterprise: Data | Cost Of Living | Movers
The overall cost of living in Enterprise is 120. The median income in Enterprise comes in at $98,462 and the average home value is $488,020 for 2026.
Methodology: How We Determined The Most Expensive Places To Live In The Silver State For 2026
The two most important things to think about when it comes to being able to afford a city in Nevada are:
- How much money do I make?
- How much do I have to spend to live there?
You need to understand your costs in the context of how much money you make.
For example, if the median household earns $100,000 and spends $40,000 on housing, it’s actually cheaper to live there than a place with a median income of $50,000 and housing costs of $21,000. You might spend more on housing, but you have more money overall to play with.
With that example in mind, we derived several statistics from the latest Census American Community Survey 2020-2024 around incomes and costs. They are:
- Overall Cost Of Living Index
- Median Home Price / Median Income (lower is better)
- Median Income / Median Rent (Higher is better)
- Median Home Price
You can then compare these metrics in each of the places in Nevada to figure out which is the most expensive.
You are left with a “Cost of Living Index” by taking the average rank of each of these metrics for each city.
So we used that cost of living index to rank all of the 33 places in Nevada that have more than 5,000 people.
The place with the highest cost of living in Nevada according to the data is Incline Village. We updated this article for 2026. This article is our eleventh time ranking the most expensive places to live in Nevada.
Summary: Taking A Chunk Out Of Your Paycheck In Nevada For 2026
Well, there you have it, the places in Nevada that have the highest cost of living, with Incline Village ranking as the most expensive city in the Silver State.
The most expensive cities in Nevada are Incline Village, Summerlin South, Johnson Lane, Spanish Springs, Henderson, Reno, Indian Hills, Sparks, Gardnerville Ranchos, and Enterprise.
Here’s a look at the most affordable cities in Nevada according to the data:
- Laughlin
- Nellis AFB
- Silver Springs
For more Nevada reading, check out:
- Best Places To Live In Nevada
- Cheapest Places To Live In Nevada
- 5 Most Dangerous Cities In Nevada
- Best Places To Raise A Family In Nevada
- Safest Places In Nevada
- Worst Places To Live In Nevada
Most Expensive Cities In Nevada
| Rank | City | Cost Of Living | Population | Median Income | Average Home Price | Home/Income Ratio |
|---|---|---|---|---|---|---|
| 1 | Incline Village | 189 | 9,272 | $167,069 | $1,474,426 | 8.8x |
| 2 | Summerlin South | 142 | 31,354 | $117,035 | $690,105 | 5.9x |
| 3 | Johnson Lane | 141 | 6,467 | $121,458 | $784,219 | 6.5x |
| 4 | Spanish Springs | 132 | 17,980 | $127,658 | $640,328 | 5.0x |
| 5 | Henderson | 127 | 332,141 | $90,138 | $486,156 | 5.4x |
| 6 | Reno | 125 | 273,212 | $80,760 | $567,856 | 7.0x |
| 7 | Indian Hills | 124 | 5,527 | $78,278 | $496,539 | 6.3x |
| 8 | Sparks | 123 | 110,024 | $89,056 | $529,282 | 5.9x |
| 9 | Gardnerville Ranchos | 122 | 12,114 | $87,785 | $498,797 | 5.7x |
| 10 | Enterprise | 120 | 240,464 | $98,462 | $488,020 | 5.0x |
| 11 | Spring Valley | 120 | 219,187 | $74,511 | $445,222 | 6.0x |
| 12 | Boulder City | 120 | 14,919 | $74,757 | $470,943 | 6.3x |
| 13 | Cold Springs | 120 | 11,321 | $93,732 | $444,709 | 4.7x |
| 14 | Gardnerville | 118 | 5,486 | $62,267 | $606,750 | 9.7x |
| 15 | Las Vegas | 116 | 660,400 | $73,877 | $426,582 | 5.8x |
| 16 | North Las Vegas | 115 | 278,595 | $79,542 | $407,047 | 5.1x |
| 17 | Paradise | 114 | 185,913 | $59,190 | $394,316 | 6.7x |
| 18 | Dayton | 114 | 15,781 | $102,819 | $453,484 | 4.4x |
| 19 | Fernley | 112 | 24,225 | $89,517 | $395,925 | 4.4x |
| 20 | Spring Creek | 112 | 14,739 | $105,154 | $404,703 | 3.8x |
| 21 | Mesquite | 111 | 22,059 | $75,227 | $380,205 | 5.1x |
| 22 | Elko | 110 | 20,696 | $79,036 | $360,730 | 4.6x |
| 23 | Winnemucca | 109 | 8,361 | $81,824 | $349,753 | 4.3x |
| 24 | Moapa Valley | 108 | 6,684 | $89,250 | $372,045 | 4.2x |
| 25 | Sunrise Manor | 106 | 200,218 | $58,421 | $328,426 | 5.6x |
| 26 | Whitney | 106 | 47,221 | $67,155 | $337,663 | 5.0x |
| 27 | Sun Valley | 106 | 22,228 | $77,446 | $434,990 | 5.6x |
| 28 | Winchester | 103 | 37,081 | $50,120 | $310,773 | 6.2x |
| 29 | Pahrump | 102 | 47,347 | $62,109 | $368,640 | 5.9x |
| 30 | Fallon | 101 | 9,463 | $73,389 | $391,150 | 5.3x |
| 31 | Silver Springs | 101 | 5,060 | $48,944 | $355,850 | 7.3x |
| 32 | Nellis AFB | 97 | 5,087 | $68,652 | $0 | 0.0x |
| 33 | Laughlin | 96 | 8,789 | $45,685 | $259,678 | 5.7x |