Ohio makes headlines for many reasons including the Cleveland Browns, Cincinnati’s Skyline Chili.
And, we’re happy to add to these headlines with our list of the top ten most expensive places in The Buckeye State for 2026.
To calculate our list, we used Saturday Night Science to compare the cost of living index based on housing costs and income levels data from the American Community Survey. We analyzed the latest data on the home price-to-income ratio and rent-to-income ratio for places in Ohio with at least 5,000 residents.
More importantly, many of Ohio’s most expensive places are also the state’s safest. If you want to live in one of Ohio’s most expensive places, consider attending school for a healthcare or finance degree.
$234,821 median income · $1,625,644 median home · #1 home prices in Ohio
Data | Crime | Cost of living | Movers
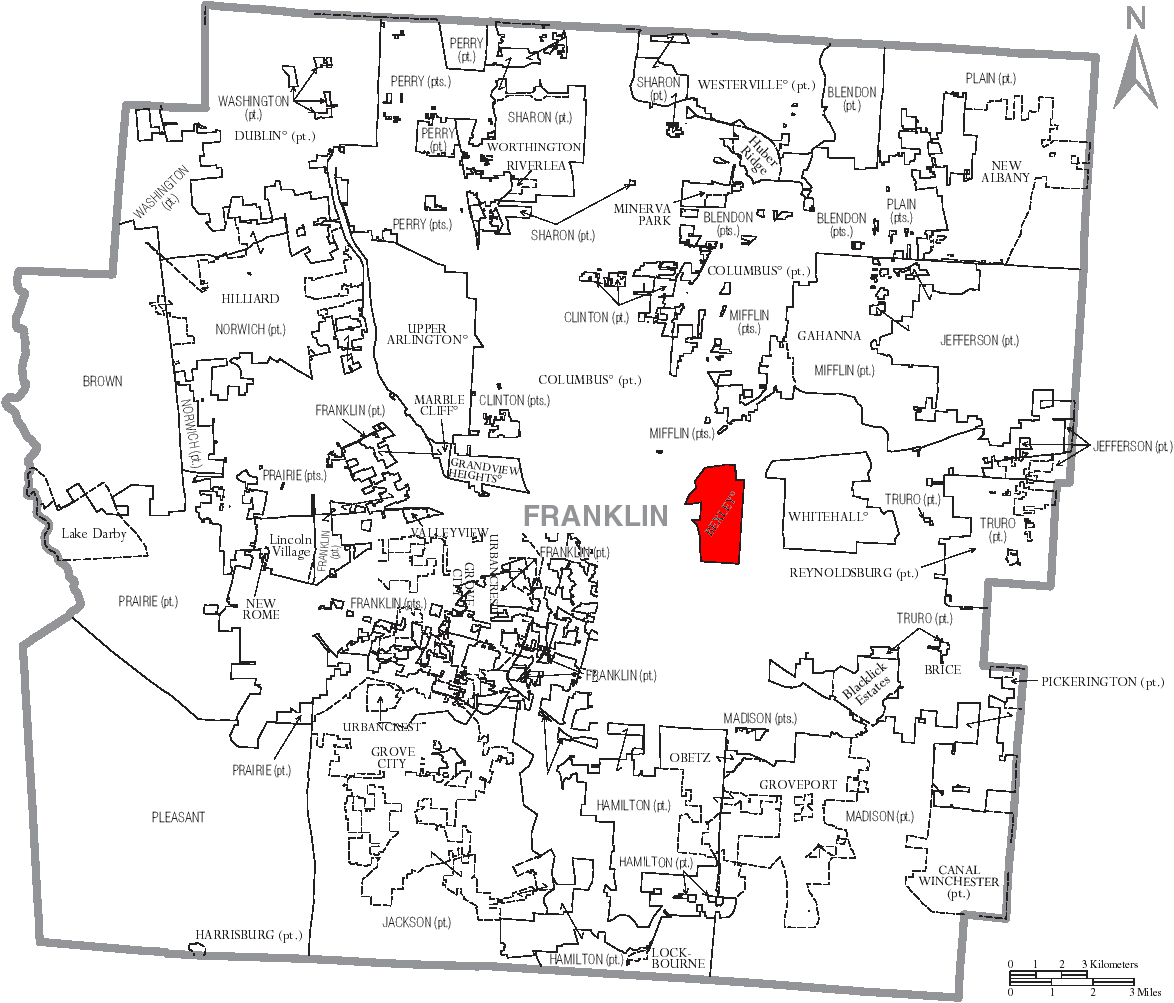
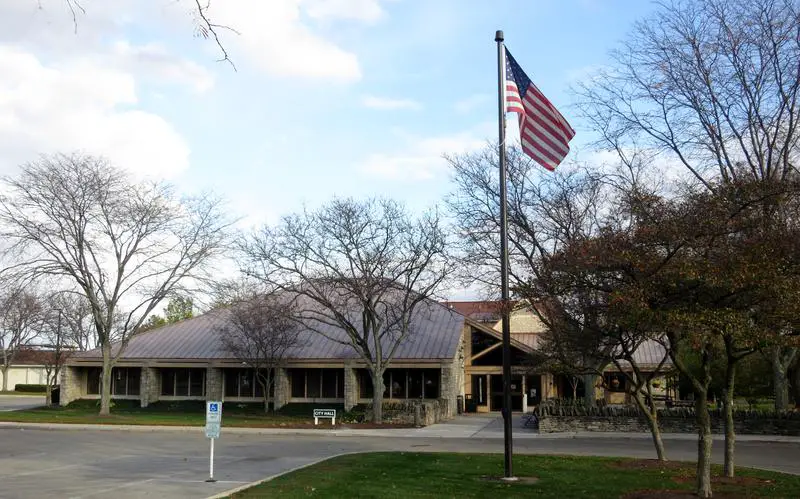
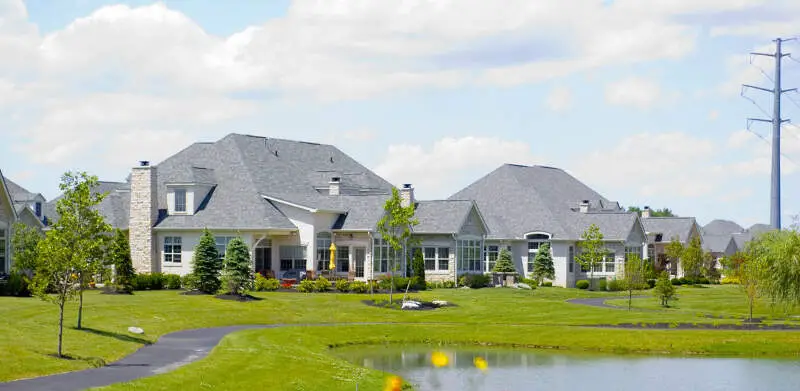
$238,250 median income · $632,192 median home · #5 home prices in Ohio
New Albany is a city in the U.S. state of Ohio, just northeast of the state capital of Columbus. Most of the city is located in Franklin County and a small portion extends into adjacent Licking County. The population was 7,724 at the 2010 census. Founded in 1837, it is now a growing suburb in the Columbus area. New Albany is a very wealthy community, with a per capita income that ranks 12th out of 1,065 places in the state of Ohio. The mayor of New Albany is Democrat Sloan Spalding who was elected in 2015.
Data | Crime | Cost of living | Movers
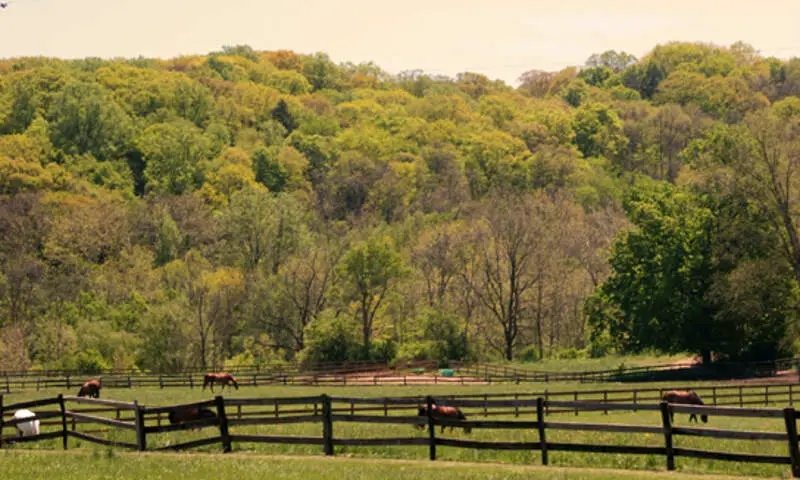
$227,813 median income · $696,160 median home · #2 home prices in Ohio
Pepper Pike is an affluent eastern suburb of the Greater Cleveland area in the US state of Ohio. The population was 5,979 at the 2010 census.
Data | Crime | Cost of living | Movers
$155,167 median income · $632,819 median home · #4 home prices in Ohio
Upper Arlington is a suburb in Franklin County, Ohio, United States, on the northwest side of the Columbus metropolitan area. As of July, 2015, the population was estimated to be 34,907.
Data | Crime | Cost of living | Movers
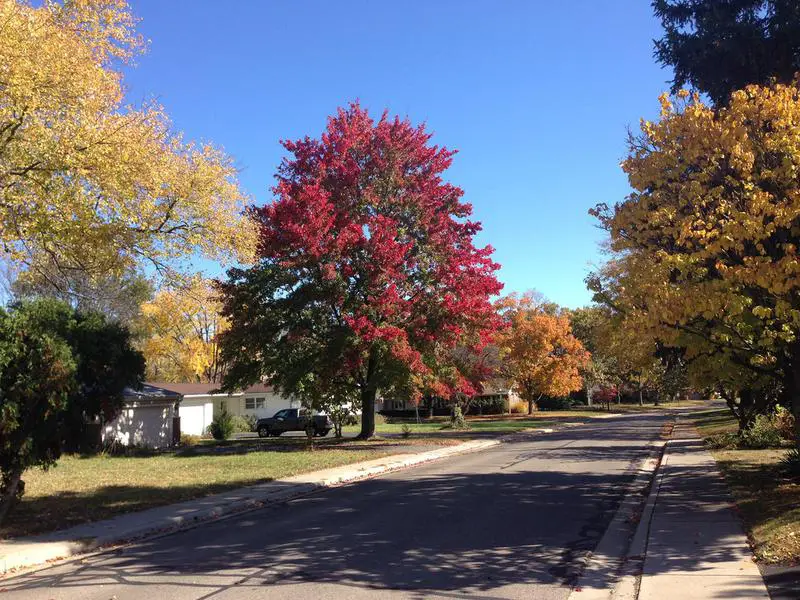
$117,672 median income · $554,974 median home · #9 home prices in Ohio
Data | Crime | Cost of living | Movers
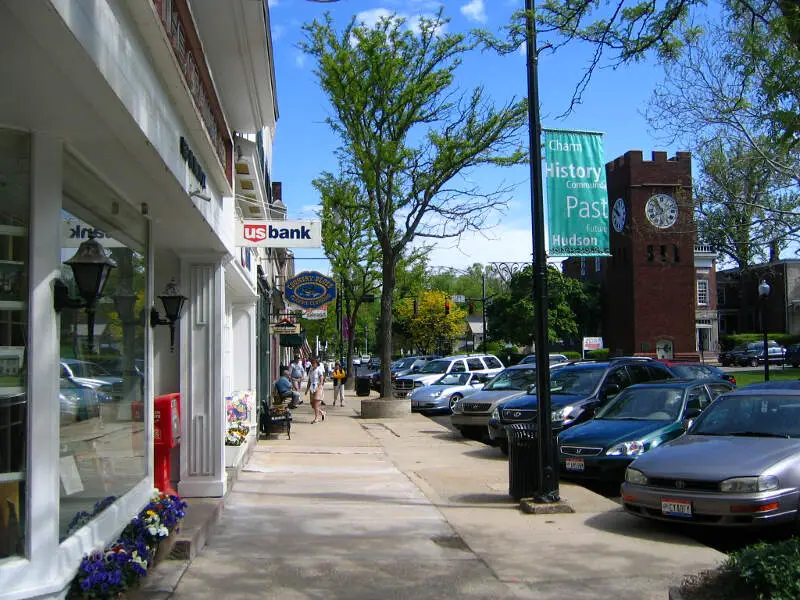
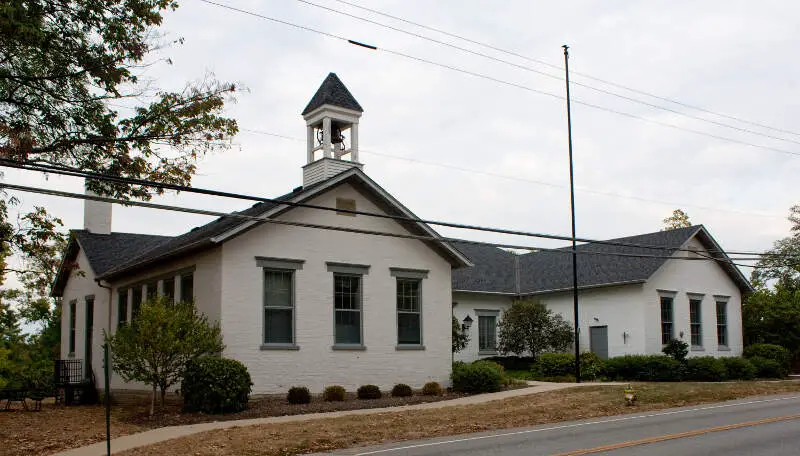
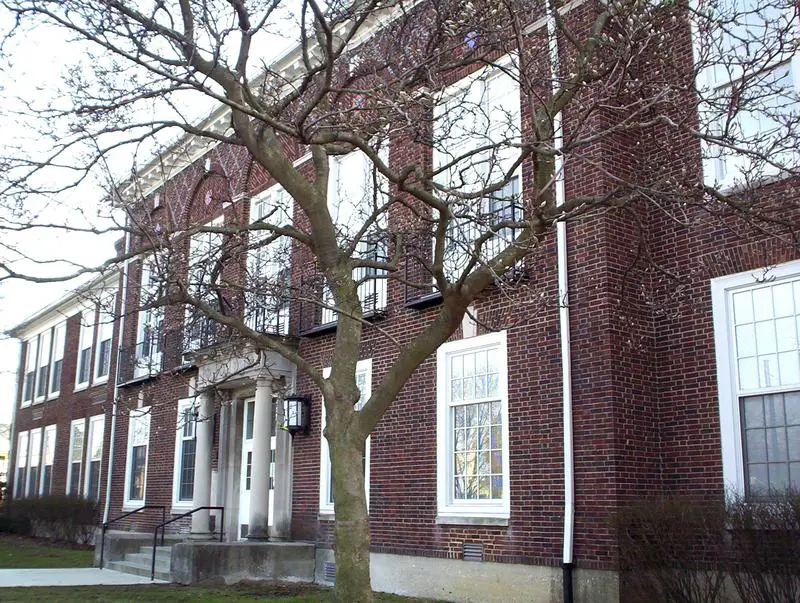
$171,427 median income · $542,265 median home · #10 home prices in Ohio
Coordinates: 411423N 812627W 41.2398397; -81.4407840
Data | Crime | Cost of living | Movers
$157,841 median income · $572,577 median home · #6 home prices in Ohio
Bexley is a suburban city in Franklin County, Ohio, United States. The population was 13,057 at the 2010 census. Founded as a village over a hundred years ago, the City of Bexley is an old, tree-lined suburb of Columbus, the Ohio state capital, situated on the banks of Alum Creek next to Driving Park and Wolfe Park, just east of the Franklin Park Conservatory. It is horizontally bisected by the National Road, serving as a reminder of Bexley’s origins as a merger between the prestigious Bullitt Park neighborhood to the north, and the Lutheran college community of Pleasant Ridge to the south.
Data | Crime | Cost of living | Movers
$160,296 median income · $559,786 median home · #8 home prices in Ohio
Dublin is an affluent city in Franklin, Delaware, and Union counties in the U.S. state of Ohio. The population was 41,751 at the 2010 census. Dublin is a suburb of Columbus, Ohio.
Data | Crime | Cost of living | Movers
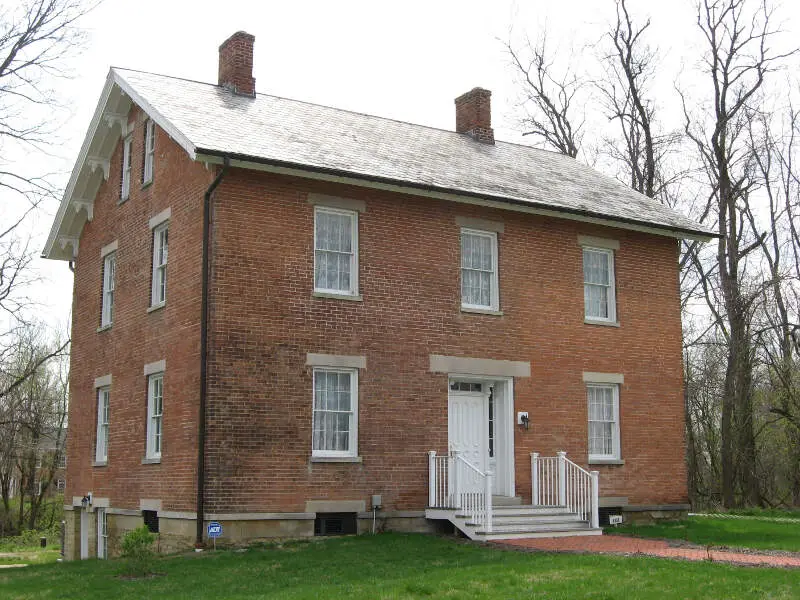
$195,495 median income · $567,815 median home · #7 home prices in Ohio
owell is an affluent city in Delaware County, Ohio, United States. The population was 11,500 at the 2010 census.
The community was first settled around 1801, two years before Ohio became a state. It was named “Middlebury” at the time, because the first settlers came from the Middlebury, Connecticut area. In 1857, Judge Thomas Powell established the first post office in the community, and the residents decided to adopt his name. The town of Powell had its start in the building of the railroad through that territory. Powell was finally incorporated as a municipality in 1947. The population remained small until the late 1980s, when residential development expanding from the northern Columbus metropolitan area reached Powell. In twenty years, the population rose from less than 400 to over 6,000.
Data | Crime | Cost of living | Movers
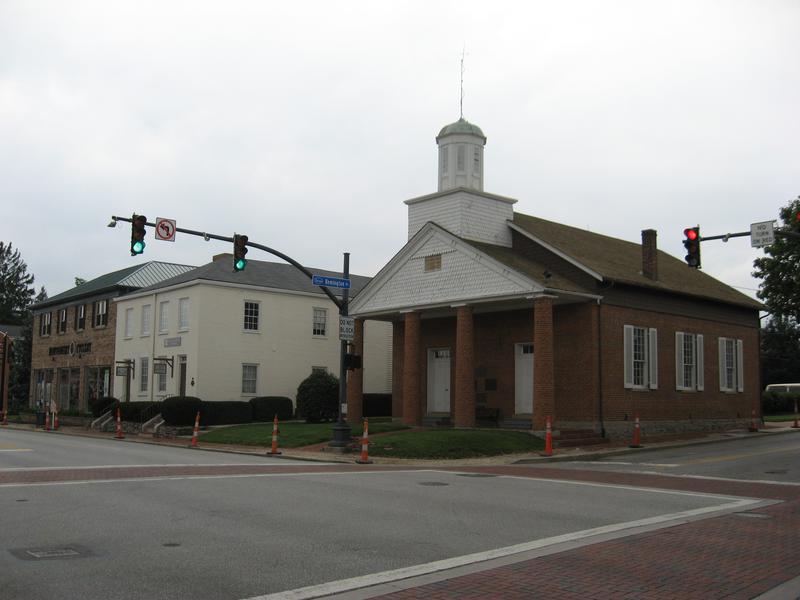
$150,995 median income · $677,977 median home · #3 home prices in Ohio
Montgomery is a city in Hamilton County, Ohio, United States, settled in 1796. The town was a coach stop on the Cincinnati-Zanesville Road, later known as the Montgomery Pike, with an inn, two taverns, a grist mill and a carding mill to process its agricultural products. It would remain a rather sleepy hamlet until the 1960s when it became an affluent bedroom community for people working in Cincinnati. It retains its historic downtown with many other 19th-century houses scattered throughout the community. It is currently accessed from exit 15 off Interstate 71 and exit 50 off Interstate 275, and it is the eastern terminus of the Ronald Reagan Cross County Highway about five miles northeast of the Cincinnati city line. The population was 10,251 at the 2010 census.
Data | Crime | Cost of living | Movers
The receipts
Compare the top ten
Pick a metric. The bars rescale. The red line is Ohio’s statewide median.
Ohio statewide median: $242,141
Ohio statewide median: $71,389
On the map
Mapping the most expensive places in Ohio
Saturday Night Science
Methodology: How We Determined The Most Expensive Places To Live In The Buckeye State For 2026
The two most important things to think about when it comes to being able to afford a city in Ohio are how much money you make and how much you have to spend to live there.
You need to understand your costs in the context of how much money you make.
For example, if the median household earns $100,000 and spends $40,000 on housing, it’s actually cheaper to live there than a place with a median income of $50,000 and housing costs of $21,000. You might spend more on housing, but you have more money overall to play with.
With that example in mind, we derived several statistics from the latest Census American Community Survey 2020-2024 around incomes and costs. They are:
- Overall Cost Of Living Index
- Median Home Price / Median Income (lower is better)
- Median Income / Median Rent (Higher is better)
- Median Home Price
You can then compare these metrics in each of the places in Ohio to figure out which is the most expensive.
You are left with a “Cost of Living Index” by taking the average rank of each of these metrics for each city.
So we used that cost of living index to rank all of the 247 places in Ohio that have more than 5,000 people.
The place with the highest cost of living in Ohio according to the data is The Village of Indian Hill. We updated this article for 2026. This article is our eleventh time ranking the most expensive places to live in Ohio.
The full plate
Most Expensive Cities In Ohio
Click any column to sort. Search by city name.
| Rank | City | Cost Of Living | Population | Median Income | Average Home Price | Home/Income Ratio |
|---|---|---|---|---|---|---|
| 1 | The Village of Indian Hill | 216 | 6,052 | $234,821 | $1,625,644 | 6.9x |
| 2 | New Albany | 146 | 10,896 | $238,250 | $632,192 | 2.7x |
| 3 | Pepper Pike | 140 | 6,840 | $227,813 | $696,160 | 3.1x |
| 4 | Upper Arlington | 132 | 36,293 | $155,167 | $632,819 | 4.1x |
| 5 | Grandview Heights | 131 | 8,647 | $117,672 | $554,974 | 4.7x |
| 6 | Hudson | 130 | 23,039 | $171,427 | $542,265 | 3.2x |
| 7 | Bexley | 126 | 13,114 | $157,841 | $572,577 | 3.6x |
| 8 | Dublin | 125 | 49,294 | $160,296 | $559,786 | 3.5x |
| 9 | Powell | 125 | 14,451 | $195,495 | $567,815 | 2.9x |
| 10 | Montgomery | 122 | 10,855 | $150,995 | $677,977 | 4.5x |
| 11 | Granville | 122 | 5,999 | $124,408 | $507,108 | 4.1x |
| 12 | Beachwood | 119 | 13,865 | $106,748 | $483,433 | 4.5x |
| 13 | Madeira | 118 | 9,484 | $167,653 | $531,046 | 3.2x |
| 14 | Highland Heights | 118 | 8,623 | $122,863 | $418,478 | 3.4x |
| 15 | Mason | 117 | 35,509 | $125,401 | $510,362 | 4.1x |
| 16 | Brecksville | 116 | 13,692 | $135,000 | $437,032 | 3.2x |
| 17 | Wyoming | 116 | 8,723 | $165,188 | $483,221 | 2.9x |
| 18 | Aurora | 115 | 17,581 | $127,886 | $428,906 | 3.4x |
| 19 | Avon | 114 | 25,317 | $135,915 | $471,403 | 3.5x |
| 20 | Solon | 114 | 23,943 | $139,089 | $452,828 | 3.3x |
| 21 | Blue Ash | 113 | 13,455 | $115,313 | $447,598 | 3.9x |
| 22 | Willoughby Hills | 112 | 9,975 | $67,214 | $349,448 | 5.2x |
| 23 | Worthington | 111 | 14,938 | $127,382 | $478,891 | 3.8x |
| 24 | Westlake | 110 | 34,104 | $112,200 | $414,010 | 3.7x |
| 25 | Avon Lake | 110 | 25,752 | $115,567 | $422,131 | 3.7x |
| 26 | Kirtland | 110 | 6,911 | $110,455 | $404,639 | 3.7x |
| 27 | Hilliard | 109 | 38,033 | $128,189 | $384,175 | 3.0x |
| 28 | Springboro | 109 | 19,980 | $119,659 | $427,302 | 3.6x |
| 29 | Bay Village | 109 | 15,984 | $132,254 | $410,254 | 3.1x |
| 30 | Westerville | 108 | 38,645 | $109,404 | $446,095 | 4.1x |
| 31 | Pickerington | 108 | 24,477 | $111,833 | $419,073 | 3.7x |
| 32 | Rocky River | 108 | 21,490 | $94,026 | $393,092 | 4.2x |
| 33 | Gahanna | 104 | 35,486 | $109,061 | $374,129 | 3.4x |
| 34 | Twinsburg | 104 | 19,410 | $99,144 | $354,964 | 3.6x |
| 35 | Independence | 104 | 7,534 | $115,733 | $354,545 | 3.1x |
| 36 | Shaker Heights | 103 | 28,922 | $104,073 | $342,442 | 3.3x |
| 37 | Macedonia | 103 | 12,152 | $101,285 | $339,074 | 3.3x |
| 38 | Grove City | 102 | 42,517 | $93,161 | $330,211 | 3.5x |
| 39 | North Royalton | 102 | 30,972 | $83,670 | $334,792 | 4.0x |
| 40 | Pataskala | 102 | 18,223 | $92,033 | $382,770 | 4.2x |
| 41 | South Lebanon | 102 | 6,712 | $104,511 | $386,045 | 3.7x |
| 42 | Beavercreek | 101 | 47,126 | $110,088 | $332,151 | 3.0x |
| 43 | Strongsville | 101 | 45,983 | $103,253 | $360,031 | 3.5x |
| 44 | Marysville | 101 | 27,518 | $92,619 | $364,500 | 3.9x |
| 45 | Perrysburg | 101 | 25,181 | $111,643 | $330,761 | 3.0x |
| 46 | Broadview Heights | 101 | 19,771 | $103,125 | $365,133 | 3.5x |
| 47 | North Ridgeville | 100 | 36,627 | $96,698 | $325,234 | 3.4x |
| 48 | Loveland | 100 | 13,197 | $94,323 | $445,808 | 4.7x |
| 49 | Waterville | 100 | 6,017 | $104,114 | $340,488 | 3.3x |
| 50 | Chardon | 100 | 5,249 | $86,613 | $363,602 | 4.2x |
| 51 | St. Clairsville | 100 | 5,003 | $76,480 | $203,091 | 2.7x |
| 52 | Mentor | 99 | 47,171 | $88,949 | $269,569 | 3.0x |
| 53 | Delaware | 99 | 44,589 | $99,786 | $407,929 | 4.1x |
| 54 | Monroe | 99 | 15,401 | $105,250 | $352,114 | 3.3x |
| 55 | University Heights | 99 | 13,394 | $96,971 | $278,811 | 2.9x |
| 56 | Reynoldsburg | 98 | 41,224 | $72,972 | $295,551 | 4.1x |
| 57 | Stow | 98 | 34,240 | $93,727 | $284,989 | 3.0x |
| 58 | Oxford | 98 | 21,753 | $40,764 | $334,774 | 8.2x |
| 59 | Lyndhurst | 98 | 13,801 | $91,238 | $230,587 | 2.5x |
| 60 | Seven Hills | 98 | 11,603 | $97,222 | $299,505 | 3.1x |
| 61 | Canal Winchester | 98 | 10,170 | $131,209 | $415,360 | 3.2x |
| 62 | Groveport | 98 | 5,900 | $93,586 | $311,011 | 3.3x |
| 63 | Brunswick | 97 | 35,246 | $90,663 | $313,497 | 3.5x |
| 64 | Green | 97 | 27,393 | $95,047 | $315,866 | 3.3x |
| 65 | Tallmadge | 97 | 18,335 | $89,410 | $282,064 | 3.2x |
| 66 | Middleburg Heights | 97 | 15,786 | $78,815 | $271,583 | 3.4x |
| 67 | Columbus | 96 | 914,802 | $66,082 | $245,979 | 3.7x |
| 68 | North Olmsted | 96 | 31,924 | $84,363 | $270,520 | 3.2x |
| 69 | Centerville | 96 | 25,205 | $85,492 | $383,031 | 4.5x |
| 70 | Athens | 96 | 23,396 | $38,204 | $238,566 | 6.2x |
| 71 | Sylvania | 96 | 19,055 | $100,189 | $319,899 | 3.2x |
| 72 | Streetsboro | 96 | 17,661 | $90,274 | $279,257 | 3.1x |
| 73 | Bellbrook | 96 | 7,394 | $111,513 | $317,414 | 2.8x |
| 74 | Fairfield | 95 | 44,828 | $77,937 | $279,552 | 3.6x |
| 75 | Bowling Green | 95 | 29,983 | $45,154 | $259,039 | 5.7x |
| 76 | Medina | 95 | 25,950 | $77,385 | $374,184 | 4.8x |
| 77 | Lebanon | 95 | 21,501 | $83,685 | $397,421 | 4.7x |
| 78 | New Franklin | 95 | 13,843 | $90,244 | $241,578 | 2.7x |
| 79 | Harrison | 95 | 13,084 | $100,000 | $316,154 | 3.2x |
| 80 | Olmsted Falls | 95 | 8,639 | $96,837 | $297,060 | 3.1x |
| 81 | Milford | 95 | 6,497 | $78,057 | $331,272 | 4.2x |
| 82 | Cincinnati | 94 | 311,224 | $52,909 | $249,568 | 4.7x |
| 83 | Lakewood | 94 | 50,007 | $68,954 | $286,113 | 4.1x |
| 84 | Willoughby | 94 | 24,046 | $71,309 | $239,414 | 3.4x |
| 85 | Mayfield Heights | 94 | 20,022 | $66,524 | $228,639 | 3.4x |
| 86 | Miamisburg | 94 | 19,948 | $82,900 | $261,699 | 3.2x |
| 87 | Fairview Park | 94 | 17,018 | $78,865 | $278,445 | 3.5x |
| 88 | Sharonville | 94 | 14,030 | $74,649 | $284,334 | 3.8x |
| 89 | Tipp City | 94 | 10,439 | $78,098 | $344,989 | 4.4x |
| 90 | Germantown | 94 | 5,825 | $90,125 | $265,382 | 2.9x |
| 91 | Cuyahoga Falls | 93 | 50,909 | $72,705 | $213,993 | 2.9x |
| 92 | Forest Park | 93 | 20,025 | $75,956 | $237,983 | 3.1x |
| 93 | Berea | 93 | 18,218 | $74,926 | $239,040 | 3.2x |
| 94 | Maumee | 93 | 13,715 | $80,833 | $277,737 | 3.4x |
| 95 | Clayton | 93 | 13,277 | $92,879 | $253,570 | 2.7x |
| 96 | Norton | 93 | 11,524 | $90,464 | $244,015 | 2.7x |
| 97 | Springdale | 93 | 11,033 | $67,903 | $234,179 | 3.4x |
| 98 | Heath | 93 | 10,644 | $71,917 | $303,572 | 4.2x |
| 99 | Fairlawn | 93 | 7,711 | $97,055 | $309,743 | 3.2x |
| 100 | Huron | 93 | 6,757 | $78,333 | $298,446 | 3.8x |
Source: U.S. Census ACS 2020-2024, Zillow research. 247 places with more than 5,000 residents.
Summary
Summary: Taking A Chunk Out Of Your Paycheck In Ohio For 2026
Well, there you have it, the places in Ohio that have the highest cost of living, with The Village of Indian Hill ranking as the most expensive city in the Buckeye State.
The most expensive cities in Ohio are The Village of Indian Hill, New Albany, Pepper Pike, Upper Arlington, Grandview Heights, Hudson, Bexley, Dublin, Powell, and Montgomery.


