Most Hispanic/Latino cities in Nevada research summary. We used Saturday Night Science to analyze Nevada’s most recent Census data to determine the most Hispanic/Latino cities based on the percentage of Hispanic/Latino residents.
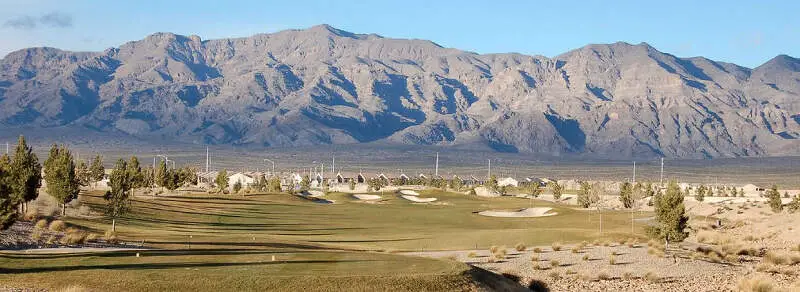
55.8% Hispanic · #1 most Hispanic in Nevada
Data | Crime | Cost of living | Movers
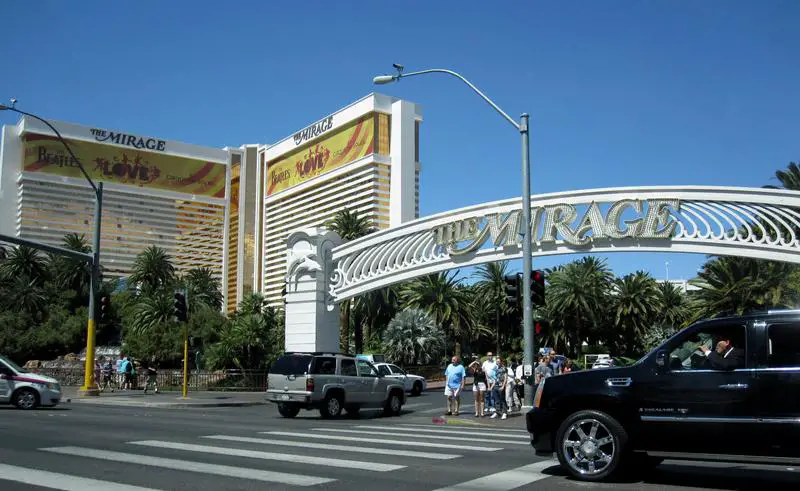
52.3% Hispanic · #2 most Hispanic in Nevada
Winchester is an unincorporated town and census-designated place and part of Las Vegas Township in Clark County, Nevada, United States that contains part of the Las Vegas Strip. It is one of a number of CDPs in the unincorporated urbanized area directly south of Las Vegas. The population was 27,978 at the 2010 census. It is governed by the Clark County Commission with advice from the Winchester Town Advisory Board. “Winchester, NV” does not appear in postal addresses; the United States Postal Service has assigned “Las Vegas, NV” as the place name for the ZIP codes containing Winchester.
Data | Crime | Cost of living | Movers
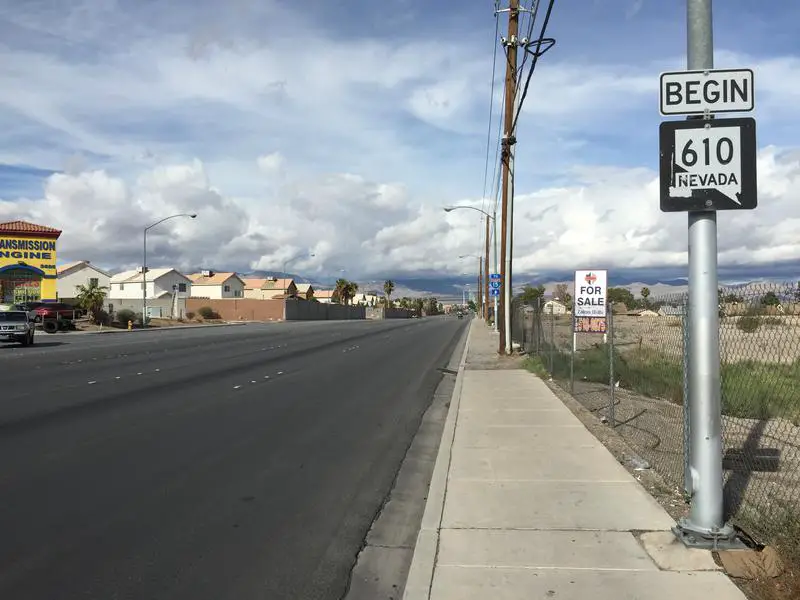
49.5% Hispanic · #3 most Hispanic in Nevada
Data | Crime | Cost of living | Movers
42.4% Hispanic · #4 most Hispanic in Nevada
Data | Crime | Cost of living | Movers
41.7% Hispanic · #5 most Hispanic in Nevada
North Las Vegas is a city in Clark County, Nevada, United States, in the Las Vegas Valley. As of the 2010 census it had a population of 216,961, with an estimated population of 249,180 in 2017. The city was incorporated on May 16, 1946. It is in the Las Vegas-Paradise, NV MSA and is the fourth largest city in the state of Nevada.
Data | Crime | Cost of living | Movers
36.8% Hispanic · #6 most Hispanic in Nevada
Coordinates: 36455N 115729W 36.08194; -115.12472
Data | Crime | Cost of living | Movers
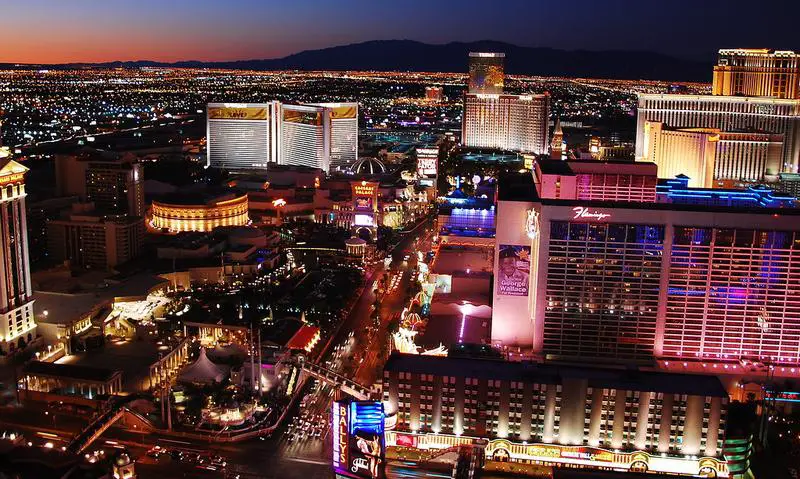
34.7% Hispanic · #7 most Hispanic in Nevada
Las Vegas, officially the City of Las Vegas and often known simply as Vegas, is the 28th-most populated city in the United States, the most populated city in the state of Nevada, and the county seat of Clark County. The city anchors the Las Vegas Valley metropolitan area and is the largest city within the greater Mojave Desert. Las Vegas is an internationally renowned major resort city, known primarily for its gambling, shopping, fine dining, entertainment, and nightlife. The Las Vegas Valley as a whole serves as the leading financial, commercial, and cultural center for Nevada.
Data | Crime | Cost of living | Movers
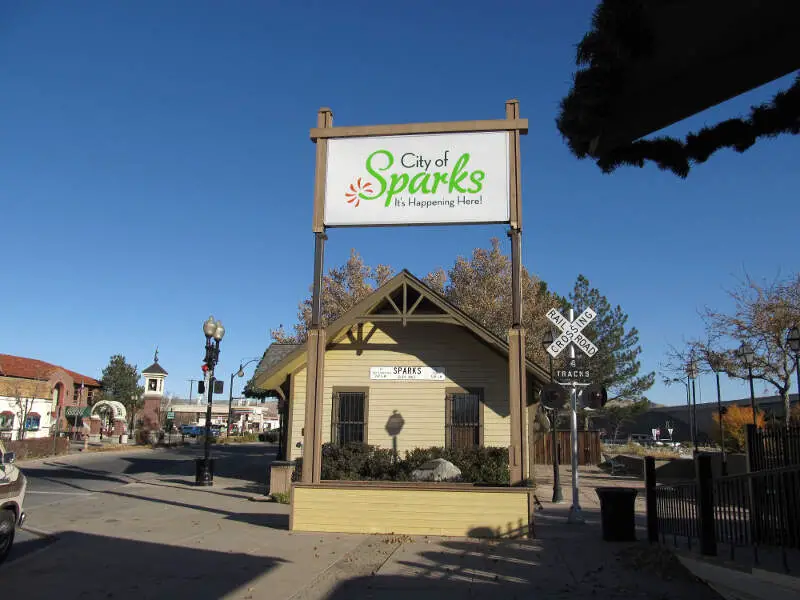
32.4% Hispanic · #8 most Hispanic in Nevada
Sparks is a city in Washoe County, Nevada, United States. It was founded in 1904 and incorporated on March 15, 1905, and is located just east of Reno. The 2010 U.S. Census Bureau population count was 90,264. It is the fifth most populous city in Nevada. It is named after the late Nevada Governor John Sparks, a member of the Silver Party.
Data | Crime | Cost of living | Movers
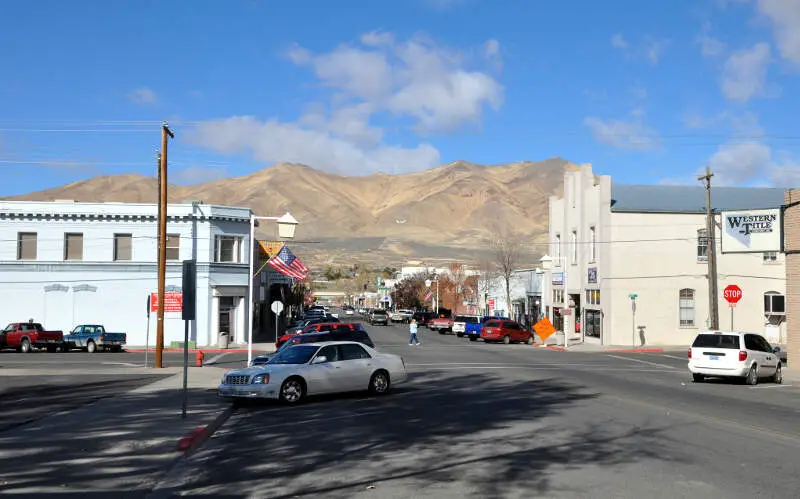
28.9% Hispanic · #9 most Hispanic in Nevada
Winnemucca ) is the only incorporated city in and is the county seat of Humboldt County, Nevada, United States. As of the 2010 census, the city had a total population of 7,396, up 3.1 percent from the 2000 census figure of 7,174. Interstate 80 passes through the city, where it meets U.S. Route 95.
Data | Crime | Cost of living | Movers
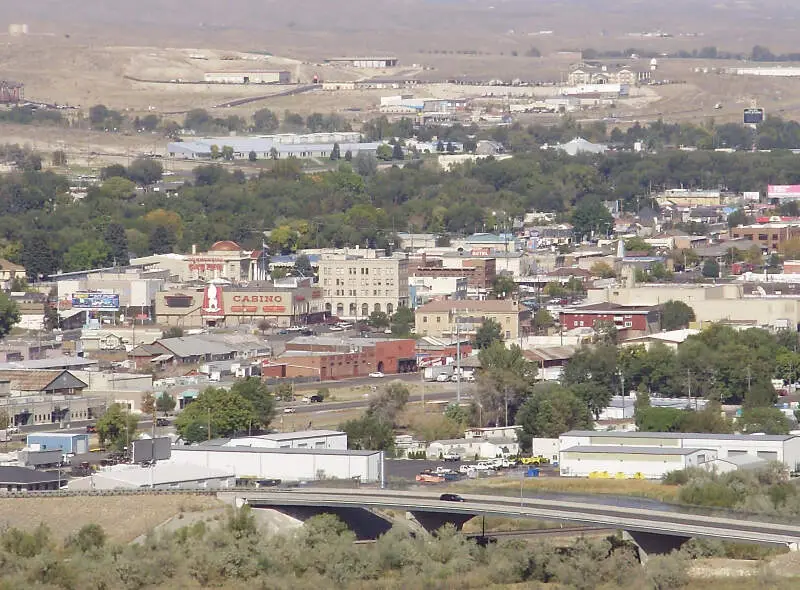
28.9% Hispanic · #10 most Hispanic in Nevada
Coordinates: 4050N 11546W 40.833; -115.767 Elko is the largest city and county seat of Elko County, Nevada, United States. The population was 18,297 at the 2010 census. The city straddles the Humboldt River.
Data | Crime | Cost of living | Movers
The receipts
Compare the top ten
Pick a metric. The bars rescale. The red line is Nevada’s statewide median.
On the map
Where Nevada’s Hispanic and Latino communities live
Saturday Night Science
Methodology: How We Determined The Cities In Nevada With The Largest Hispanic Population For 2026
We used Saturday Night Science to compare data on race from the US Census for every city in Nevada.
Nevada’s most recently available data comes from the 2020-2024 American Community Survey.
Specifically, we looked at table B03002: Hispanic OR LATINO ORIGIN BY RACE. Here are the category names as defined by the Census:
- Hispanic or Latino
- White alone*
- Black or African American alone*
- American Indian and Alaska Native alone*
- Asian alone*
- Native Hawaiian and Other Pacific Islander alone*
- Some other race alone*
- Two or more races*
Our particular column of interest here was the number of people who identified as Hispanic or Latino.
We limited our analysis to places in Nevada with a population greater than 5,000 people. That left us with 32 cities.
We then calculated the percentage of Hispanic or Latino residents in each Nevada city. The percentages ranked from 55.8% to 5.6%.
Finally, we ranked each city based on the percentage of the Hispanic or Latino population, with a higher percentage being more Hispanic or Latino. Sunrise Manor was the most Hispanic or Latino, while Silver Springs was the least Hispanic or Latino city.
We updated this article for 2026. This article represents our eleventh time ranking the cities in Nevada with the largest Hispanic/Latino population.
The full plate
Cities In Nevada By Hispanic Population
Click any column to sort. Search by city name.
| Rank | City | Population | Hispanic Population | % Hispanic |
|---|---|---|---|---|
| 1 | Sunrise Manor | 200,218 | 111,708 | 55.8% |
| 2 | Winchester | 37,081 | 19,390 | 52.3% |
| 3 | Sun Valley | 22,228 | 10,993 | 49.5% |
| 4 | Whitney | 47,221 | 20,009 | 42.4% |
| 5 | North Las Vegas | 278,595 | 116,202 | 41.7% |
| 6 | Paradise | 185,913 | 68,493 | 36.8% |
| 7 | Las Vegas | 660,400 | 228,863 | 34.7% |
| 8 | Sparks | 110,024 | 35,635 | 32.4% |
| 9 | Winnemucca | 8,361 | 2,420 | 28.9% |
| 10 | Elko | 20,696 | 5,981 | 28.9% |
| 11 | Reno | 273,212 | 70,362 | 25.8% |
| 12 | Mesquite | 22,059 | 5,440 | 24.7% |
| 13 | Cold Springs | 11,321 | 2,772 | 24.5% |
| 14 | Spring Valley | 219,187 | 49,688 | 22.7% |
| 15 | Fernley | 24,225 | 5,221 | 21.6% |
| 16 | Dayton | 15,781 | 3,247 | 20.6% |
| 17 | Incline Village | 9,272 | 1,885 | 20.3% |
| 18 | Enterprise | 240,464 | 45,492 | 18.9% |
| 19 | Henderson | 332,141 | 60,283 | 18.1% |
| 20 | Laughlin | 8,789 | 1,525 | 17.4% |
| 21 | Pahrump | 47,347 | 8,010 | 16.9% |
| 22 | Indian Hills | 5,527 | 924 | 16.7% |
| 23 | Fallon | 9,463 | 1,573 | 16.6% |
| 24 | Gardnerville Ranchos | 12,114 | 1,954 | 16.1% |
| 25 | Gardnerville | 5,486 | 766 | 14.0% |
| 26 | Spanish Springs | 17,980 | 2,433 | 13.5% |
| 27 | Summerlin South | 31,354 | 3,941 | 12.6% |
| 28 | Moapa Valley | 6,684 | 757 | 11.3% |
| 29 | Spring Creek | 14,739 | 1,557 | 10.6% |
| 30 | Boulder City | 14,919 | 1,055 | 7.1% |
| 31 | Johnson Lane | 6,467 | 393 | 6.1% |
| 32 | Silver Springs | 5,060 | 281 | 5.6% |
Source: U.S. Census ACS 2020-2024. 32 cities with more than 5,000 residents.
Summary
Summary: Hispanic or Latino Populations Across Nevada
According to the most recent data, this is an accurate list if you’re looking for a breakdown of Latino populations for each place across Nevada.
The most Hispanic/Latino cities in Nevada are Sunrise Manor, Winchester, Sun Valley, Whitney, North Las Vegas, Paradise, Las Vegas, Sparks, Winnemucca, and Elko.


