Most Hispanic/Latino cities in West Virginia research summary. We used Saturday Night Science to analyze West Virginia’s most recent Census data to determine the most Hispanic/Latino cities based on the percentage of Hispanic/Latino residents.
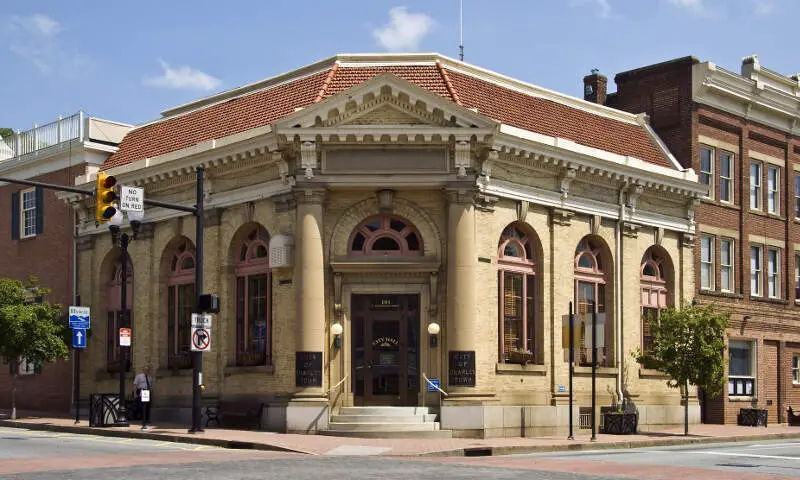
13.9% Hispanic · #1 most Hispanic in West Virginia
Charles Town, officially the City of Charles Town, is a city in Jefferson County, West Virginia, and is also the county seat. The population was 5,259 at the 2010 United States Census.
Data | Crime | Cost of living | Movers
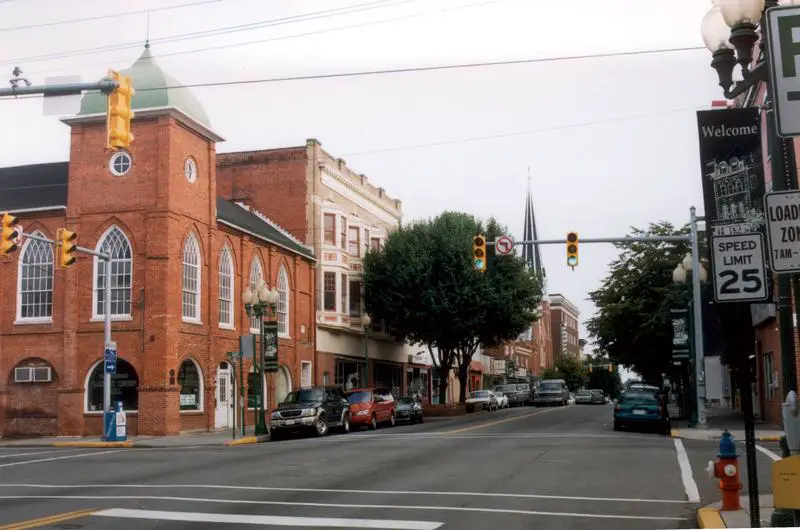
10.6% Hispanic · #2 most Hispanic in West Virginia
Martinsburg is a city in and the county seat of Berkeley County, West Virginia, United States, in the tip of the state’s Eastern Panhandle region. Its population was 17,687 in the 2016 census estimate, making it the largest city in the Eastern Panhandle and the ninth-largest municipality in the state. Martinsburg is part of the Hagerstown-Martinsburg, MD-WV Metropolitan Statistical Area.
Data | Crime | Cost of living | Movers
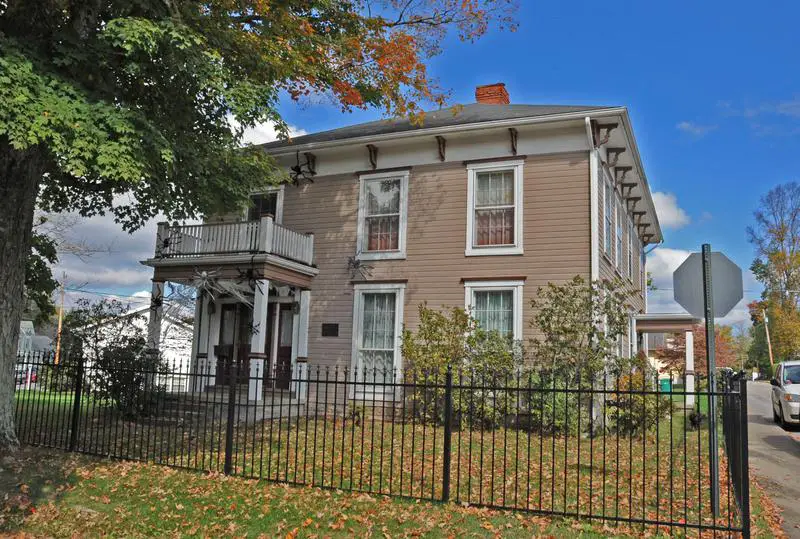
4.3% Hispanic · #3 most Hispanic in West Virginia
Bridgeport is a city in Harrison County, West Virginia, USA. The population was 8,149 at the 2010 census.
Data | Crime | Cost of living | Movers
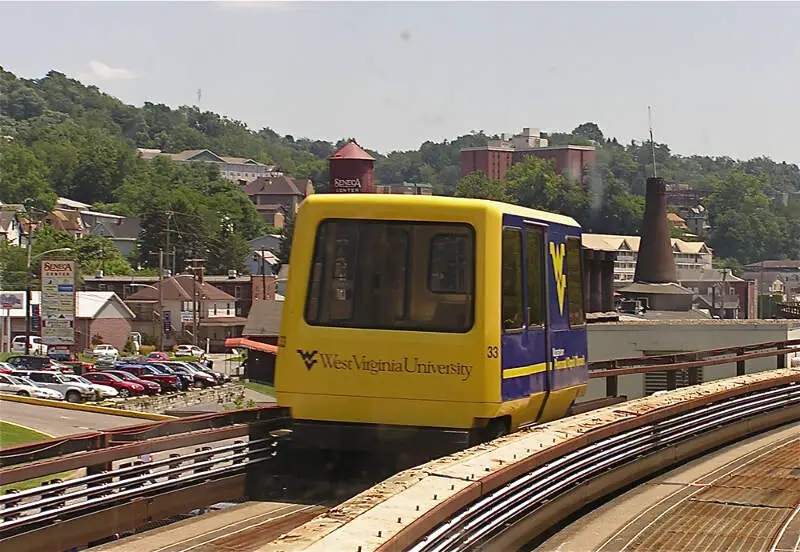
4.3% Hispanic · #4 most Hispanic in West Virginia
Morgantown is a city in and the county seat of Monongalia County, West Virginia, situated along the banks of the Monongahela River. With a permanent population of 31,073 per the 2015 U.S. Census estimates, Morgantown is the largest city in North-Central West Virginia. The Morgantown metropolitan area has a population of 138,176, and is the 3rd largest in West Virginia. West Virginia University adds several thousand seasonal residents to the city and surrounding area from September through May. Morgantown is best known as the home of West Virginia University and the Morgantown Personal Rapid Transit system.
Data | Crime | Cost of living | Movers
3.9% Hispanic · #5 most Hispanic in West Virginia
Dunbar is a city in Kanawha County, West Virginia, along the Kanawha River. The population was 7,907 at the 2010 census.
Data | Crime | Cost of living | Movers
3.6% Hispanic · #6 most Hispanic in West Virginia
Beckley is a city in and the county seat of Raleigh County, West Virginia, United States. It was founded on April 4, 1838. Beckley was named in honor of John James Beckley, who was the first Clerk of the House of Representatives and the first Librarian of Congress. It was founded by his son Alfred Beckley. The current mayor is Rob Rappold
Data | Crime | Cost of living | Movers
3.4% Hispanic · #7 most Hispanic in West Virginia
Elkins is a city in Randolph County, West Virginia, USA. The community was incorporated in 1890 and named in honor of Stephen Benton Elkins, a U.S. Senator from West Virginia. The population was 7,094 at the 2010 census. It is the county seat of Randolph County. Elkins is home to Davis and Elkins College and to the Mountain State Forest Festival, held in early October every year.
Data | Crime | Cost of living | Movers
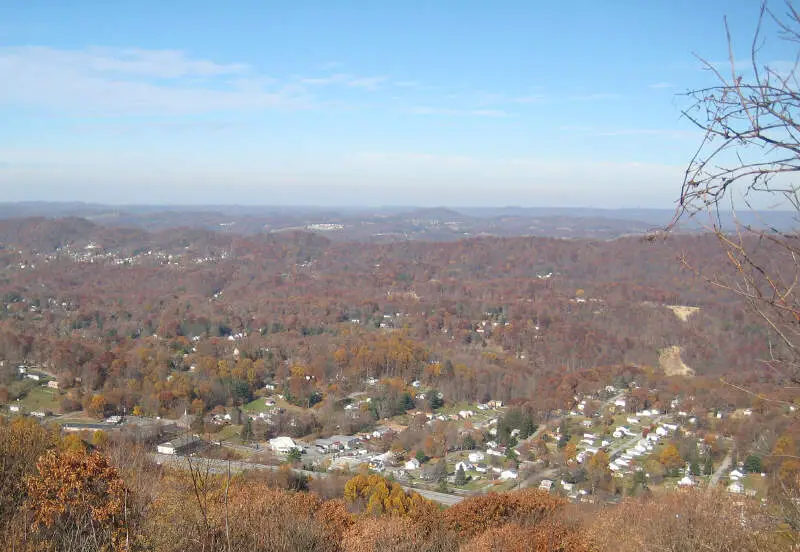
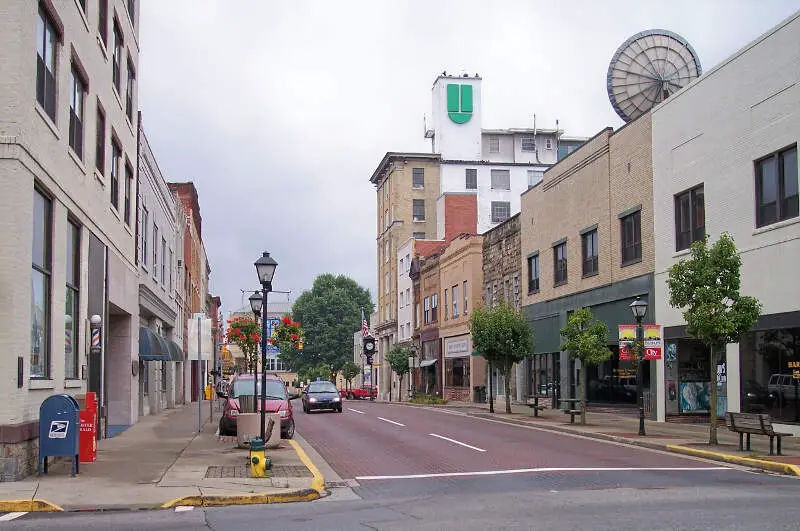
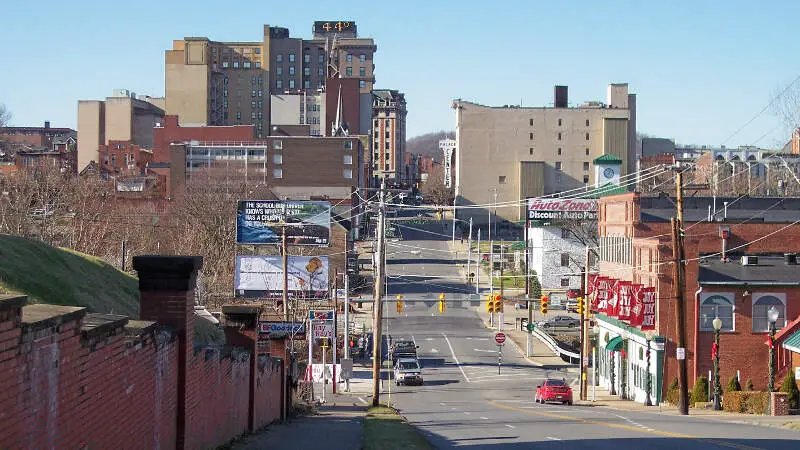
3.1% Hispanic · #8 most Hispanic in West Virginia
Bluefield is a city in Mercer County, West Virginia, United States. The population was 10,447 at the 2010 census. It is the core city of the Bluefield WV-VA micropolitan area, which has a population of 107,342.
Data | Crime | Cost of living | Movers
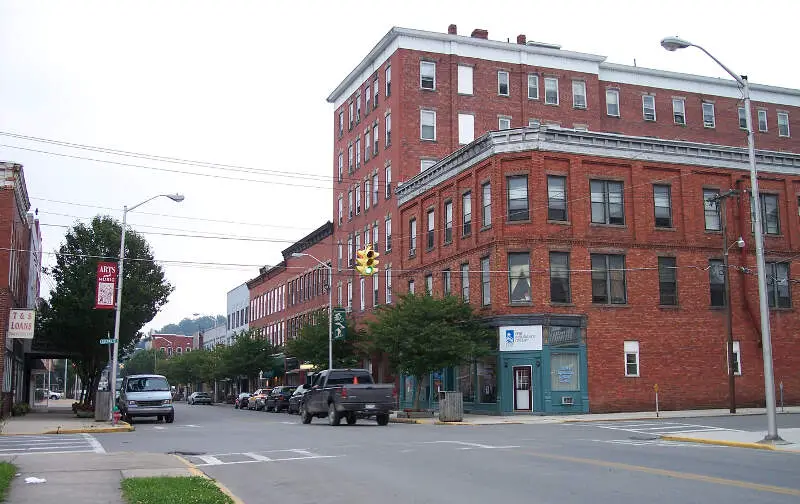
2.7% Hispanic · #9 most Hispanic in West Virginia
Clarksburg is a city in and the county seat of Harrison County, West Virginia, United States, in the north-central region of the state. The population of the city was 16,578 at the 2010 census. It is the principal city of the Clarksburg, WV Micropolitan Statistical Area, which had a population of 94,221 in 2014. Clarksburg was named National Small City of the Year in 2011 by the National League of Cities.
Data | Crime | Cost of living | Movers
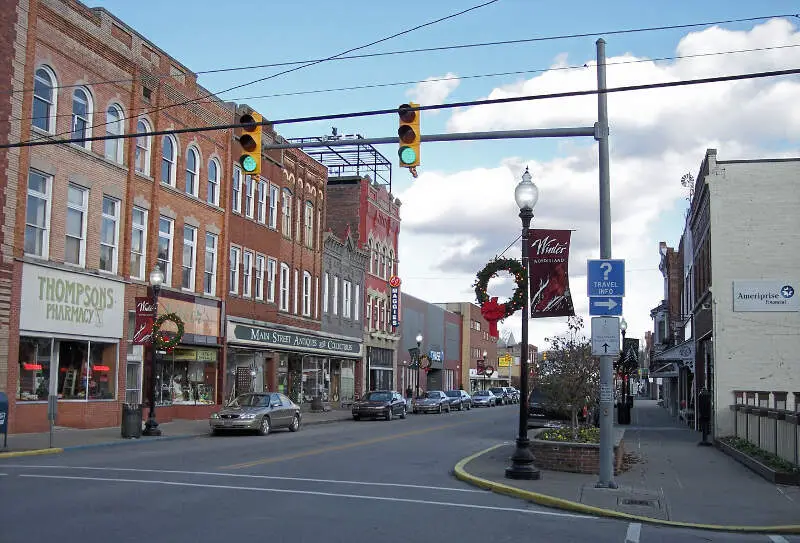
2.5% Hispanic · #10 most Hispanic in West Virginia
Buckhannon is the only incorporated city in, and the county seat of, Upshur County, West Virginia, United States, and is located along the Buckhannon River. The population was 5,639 at the 2010 census. Buckhannon is home to West Virginia Wesleyan College and the West Virginia Strawberry Festival, held annually on the third week of May. The city is located 115 miles northeast from the capital city of Charleston and 140 miles south of Pittsburgh, Pennsylvania.
Data | Crime | Cost of living | Movers
The receipts
Compare the top ten
Pick a metric. The bars rescale. The red line is West Virginia’s statewide median.
On the map
Where West Virginia’s Hispanic and Latino communities live
Saturday Night Science
Methodology: How We Determined The Cities In West Virginia With The Largest Hispanic Population For 2026
We used Saturday Night Science to compare data on race from the US Census for every city in West Virginia.
West Virginia’s most recently available data comes from the 2020-2024 American Community Survey.
Specifically, we looked at table B03002: Hispanic OR LATINO ORIGIN BY RACE. Here are the category names as defined by the Census:
- Hispanic or Latino
- White alone*
- Black or African American alone*
- American Indian and Alaska Native alone*
- Asian alone*
- Native Hawaiian and Other Pacific Islander alone*
- Some other race alone*
- Two or more races*
Our particular column of interest here was the number of people who identified as Hispanic or Latino.
We limited our analysis to places in West Virginia with a population greater than 5,000 people. That left us with 25 cities.
We then calculated the percentage of Hispanic or Latino residents in each West Virginia city. The percentages ranked from 13.9% to 0.1%.
Finally, we ranked each city based on the percentage of the Hispanic or Latino population, with a higher percentage being more Hispanic or Latino. Charles Town was the most Hispanic or Latino, while Oak Hill was the least Hispanic or Latino city.
We updated this article for 2026. This article represents our eleventh time ranking the cities in West Virginia with the largest Hispanic/Latino population.
The full plate
Cities In West Virginia By Hispanic Population
Click any column to sort. Search by city name.
| Rank | City | Population | Hispanic Population | % Hispanic |
|---|---|---|---|---|
| 1 | Charles Town | 7,337 | 1,022 | 13.9% |
| 2 | Martinsburg | 18,904 | 2,000 | 10.6% |
| 3 | Bridgeport | 9,252 | 400 | 4.3% |
| 4 | Morgantown | 30,236 | 1,306 | 4.3% |
| 5 | Dunbar | 7,254 | 280 | 3.9% |
| 6 | Beckley | 16,818 | 600 | 3.6% |
| 7 | Elkins | 6,811 | 233 | 3.4% |
| 8 | Bluefield | 9,387 | 288 | 3.1% |
| 9 | Clarksburg | 15,549 | 417 | 2.7% |
| 10 | Buckhannon | 5,116 | 130 | 2.5% |
| 11 | Fairmont | 18,221 | 446 | 2.4% |
| 12 | Weirton | 18,647 | 446 | 2.4% |
| 13 | Huntington | 45,787 | 1,091 | 2.4% |
| 14 | Moundsville | 7,869 | 185 | 2.4% |
| 15 | St. Albans | 10,522 | 233 | 2.2% |
| 16 | Charleston | 47,421 | 1,045 | 2.2% |
| 17 | South Charleston | 13,457 | 272 | 2.0% |
| 18 | Parkersburg | 29,240 | 530 | 1.8% |
| 19 | Hurricane | 6,855 | 118 | 1.7% |
| 20 | Vienna | 10,518 | 168 | 1.6% |
| 21 | Wheeling | 26,350 | 368 | 1.4% |
| 22 | Princeton | 5,736 | 34 | 0.6% |
| 23 | New Martinsville | 5,133 | 18 | 0.4% |
| 24 | Nitro | 6,853 | 10 | 0.1% |
| 25 | Oak Hill | 7,937 | 9 | 0.1% |
Source: U.S. Census ACS 2020-2024. 25 cities with more than 5,000 residents.
Summary
Summary: Hispanic or Latino Populations Across West Virginia
According to the most recent data, this is an accurate list if you’re looking for a breakdown of Latino populations for each place across West Virginia.
The most Hispanic/Latino cities in West Virginia are Charles Town, Martinsburg, Bridgeport, Morgantown, Dunbar, Beckley, Elkins, Bluefield, Clarksburg, and Buckhannon.


