Bluefield SnackAbility
Overall SnackAbility
Crime in Bluefield summary. We use data from the FBI to determine the crime rates in Bluefield. Key points include:
There were 139 total crimes in Bluefield in the last reporting year.
The overall crime rate per 100,000 people in Bluefield is 1,517.0 / 100k people.
The violent crime rate per 100,000 people in Bluefield is 480.2 / 100k people.
The property crime rate per 100,000 people in Bluefield is 1,036.8 / 100k people.
Overall, crime in Bluefield is -28.42% below the national average.
Total Crimes
Below National Average
Crime In Bluefield Comparison Table
| Statistic | Count Raw |
Bluefield / 100k People |
West Virginia / 100k People |
National / 100k People |
|---|---|---|---|---|
| Total Crimes Per 100K | 139 | 1,517.0 | 1,410.8 | 2,119.2 |
| Violent Crime | 44 | 480.2 | 248.8 | 359.0 |
| Murder | 1 | 10.9 | 5.3 | 5.0 |
| Robbery | 1 | 10.9 | 9.7 | 61.0 |
| Aggravated Assault | 37 | 403.8 | 185.8 | 256.0 |
| Property Crime | 95 | 1,036.8 | 1,161.9 | 1,760.0 |
| Burglary | 22 | 240.1 | 178.3 | 229.0 |
| Larceny | 64 | 698.5 | 905.1 | 1,272.0 |
| Car Theft | 9 | 98.2 | 78.5 | 259.0 |
Source: FBI Uniform Crime Reporting (2024)
Cost of living in Bluefield summary. We use data on the cost of living to determine how expensive it is to live in Bluefield. Real estate prices drive most of the variance in cost of living around West Virginia. Key points include:
The cost of living in Bluefield is 88 with 100 being average.
The cost of living in Bluefield is 0.9x lower than the national average.
The median home value in Bluefield is $105,764.
The median income in Bluefield is $49,375.
Bluefield's Overall Cost Of Living
Lower Than The National Average
Cost Of Living In Bluefield Comparison Table
| Living Expense | Bluefield | West Virginia | National Average |
|---|---|---|---|
| Overall | 88 | 86 | 100 |
| Services | 104 | 95 | 100 |
| Groceries | 105 | 95 | 100 |
| Health | 54 | 61 | 100 |
| Housing | 100 | 95 | 100 |
| Transportation | 106 | 93 | 100 |
| Utilities | 102 | 93 | 100 |
Source: Cost of living index, normalized to US average = 100
Bluefield, WV Weather
The average high in Bluefield is 63.0° and the average low is 42.1°.
There are 79.9 days of precipitation each year.
Expect an average of 40.7 inches of precipitation each year with 30.9 inches of snow.
| Stat | Bluefield |
|---|---|
| Average Annual High | 63.0 |
| Average Annual Low | 42.1 |
| Annual Precipitation Days | 79.9 |
| Average Annual Precipitation | 40.7 |
| Average Annual Snowfall | 30.9 |
Average High
Days of Rain
Source: NOAA climate normals (30-year)
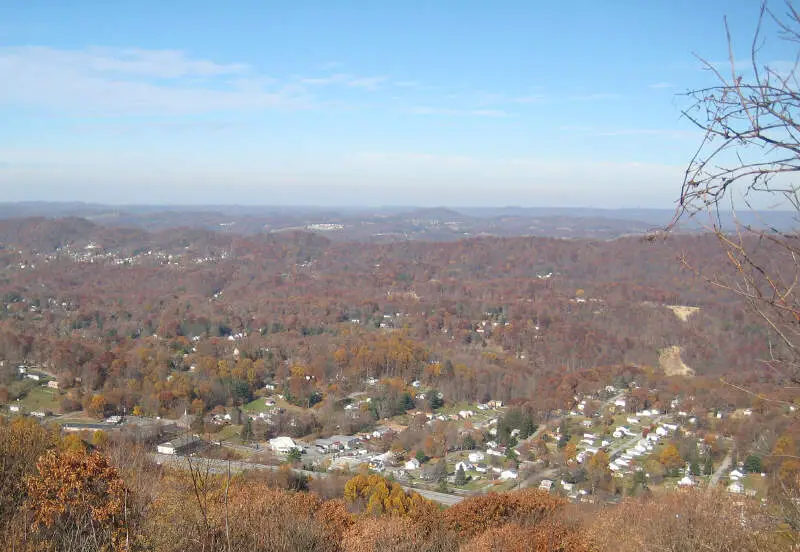
Bluefield, WV Photos
1 Reviews & Comments About Bluefield

I live in bluefield and it's nickname is the air conditioned city, and our city does have a lot of poverty. And no one wants to live hear really. Lots of people retire here
Rankings & Articles For Bluefield


Locations Around Bluefield
Map Of Bluefield, WV
Best Places Around Bluefield
Blacksburg, VA
Population 45,446
Christiansburg, VA
Population 22,720
Radford, VA
Population 16,726
Pulaski, VA
Population 8,893
Wytheville, VA
Population 8,202
Bluefield, VA
Population 4,979
Princeton, WV
Population 5,736
Richlands, VA
Population 5,171
Marion, VA
Population 5,670
Beckley, WV
Population 16,818
Bluefield Demographics And Statistics
Population over time in Bluefield
The current population in Bluefield is 9,387. The population has decreased 10.9% from 2010.
| Year | Population | % Change |
|---|---|---|
| 2024 | 9,387 | -1.3% |
| 2023 | 9,511 | -1.1% |
| 2022 | 9,619 | -0.8% |
| 2021 | 9,699 | -0.8% |
| 2020 | 9,776 | -1.1% |
| 2019 | 9,889 | -1.3% |
| 2018 | 10,022 | -1.2% |
| 2017 | 10,144 | -2.1% |
| 2016 | 10,366 | -0.6% |
| 2015 | 10,431 | -0.3% |
| 2014 | 10,465 | -0.3% |
| 2013 | 10,492 | 0.1% |
| 2012 | 10,486 | -0.3% |
| 2011 | 10,517 | -0.2% |
| 2010 | 10,538 | - |
Race / Ethnicity in Bluefield
See the full breakdown
Bluefield is:
75.8% White with 7,116 White residents.
13.4% African American with 1,260 African American residents.
0.0% American Indian with 0 American Indian residents.
0.6% Asian with 56 Asian residents.
0.0% Hawaiian with 0 Hawaiian residents.
0.5% Other with 49 Other residents.
6.6% Two Or More with 618 Two Or More residents.
3.1% Hispanic with 288 Hispanic residents.
| Race | Bluefield | WV | USA |
|---|---|---|---|
| White | 75.8% | 89.7% | 57.4% |
| African American | 13.4% | 3.1% | 11.9% |
| American Indian | 0.0% | 0.1% | 0.5% |
| Asian | 0.6% | 0.8% | 5.9% |
| Hawaiian | 0.0% | 0.0% | 0.2% |
| Other | 0.5% | 0.3% | 0.6% |
| Two Or More | 6.6% | 3.9% | 4.3% |
| Hispanic | 3.1% | 2.1% | 19.3% |
Gender in Bluefield
See the full breakdown
Bluefield is 54.7% female with 5,132 female residents.
Bluefield is 45.3% male with 4,255 male residents.
| Gender | Bluefield | WV | USA |
|---|---|---|---|
| Female | 54.7% | 50.1% | 50.5% |
| Male | 45.3% | 49.9% | 49.5% |
Highest level of educational attainment in Bluefield for adults over 25
See the full breakdown
4.0% of adults in Bluefield completed < 9th grade.
7.0% of adults in Bluefield completed 9-12th grade.
28.0% of adults in Bluefield completed high school / ged.
21.0% of adults in Bluefield completed some college.
10.0% of adults in Bluefield completed associate's degree.
20.0% of adults in Bluefield completed bachelor's degree.
8.0% of adults in Bluefield completed master's degree.
1.0% of adults in Bluefield completed professional degree.
1.0% of adults in Bluefield completed doctorate degree.
| Education | Bluefield | WV | USA |
|---|---|---|---|
| < 9th Grade | 4.0% | 5.0% | 4.0% |
| 9-12th Grade | 7.0% | 7.0% | 6.0% |
| High School / GED | 28.0% | 39.0% | 26.0% |
| Some College | 21.0% | 17.0% | 19.0% |
| Associate's Degree | 10.0% | 8.0% | 9.0% |
| Bachelor's Degree | 20.0% | 14.0% | 22.0% |
| Master's Degree | 8.0% | 7.0% | 10.0% |
| Professional Degree | 1.0% | 2.0% | 2.0% |
| Doctorate Degree | 1.0% | 1.0% | 2.0% |
Household Income For Bluefield, West Virginia
See the full breakdown
5.6% of households in Bluefield earn Less than $10,000.
6.2% of households in Bluefield earn $10,000 to $14,999.
11.7% of households in Bluefield earn $15,000 to $24,999.
9.4% of households in Bluefield earn $25,000 to $34,999.
17.5% of households in Bluefield earn $35,000 to $49,999.
12.7% of households in Bluefield earn $50,000 to $74,999.
13.0% of households in Bluefield earn $75,000 to $99,999.
16.7% of households in Bluefield earn $100,000 to $149,999.
3.7% of households in Bluefield earn $150,000 to $199,999.
3.5% of households in Bluefield earn $200,000 or more.
| Income | Bluefield | WV | USA |
|---|---|---|---|
| Less than $10,000 | 5.6% | 6.2% | 5.0% |
| $10,000 to $14,999 | 6.2% | 5.5% | 3.4% |
| $15,000 to $24,999 | 11.7% | 9.4% | 6.3% |
| $25,000 to $34,999 | 9.4% | 9.2% | 6.6% |
| $35,000 to $49,999 | 17.5% | 12.4% | 10.1% |
| $50,000 to $74,999 | 12.7% | 17.3% | 15.5% |
| $75,000 to $99,999 | 13.0% | 12.7% | 12.6% |
| $100,000 to $149,999 | 16.7% | 15.1% | 17.5% |
| $150,000 to $199,999 | 3.7% | 6.3% | 9.6% |
| $200,000 or more | 3.5% | 5.9% | 13.4% |
Source: U.S. Census ACS 5-year estimates (2024)


