Princeton SnackAbility
Overall SnackAbility
Crime in Princeton summary. We use data from the FBI to determine the crime rates in Princeton. Key points include:
There were 43 total crimes in Princeton in the last reporting year.
The overall crime rate per 100,000 people in Princeton is 774.6 / 100k people.
The violent crime rate per 100,000 people in Princeton is 414.3 / 100k people.
The property crime rate per 100,000 people in Princeton is 360.3 / 100k people.
Overall, crime in Princeton is -63.45% below the national average.
Total Crimes
Below National Average
Crime In Princeton Comparison Table
| Statistic | Count Raw |
Princeton / 100k People |
West Virginia / 100k People |
National / 100k People |
|---|---|---|---|---|
| Total Crimes Per 100K | 43 | 774.6 | 1,410.8 | 2,119.2 |
| Violent Crime | 23 | 414.3 | 248.8 | 359.0 |
| Murder | 0 | 0.0 | 5.3 | 5.0 |
| Robbery | 0 | 0.0 | 9.7 | 61.0 |
| Aggravated Assault | 22 | 396.3 | 185.8 | 256.0 |
| Property Crime | 20 | 360.3 | 1,161.9 | 1,760.0 |
| Burglary | 0 | 0.0 | 178.3 | 229.0 |
| Larceny | 20 | 360.3 | 905.1 | 1,272.0 |
| Car Theft | 0 | 0.0 | 78.5 | 259.0 |
Source: FBI Uniform Crime Reporting (2024)
Cost of living in Princeton summary. We use data on the cost of living to determine how expensive it is to live in Princeton. Real estate prices drive most of the variance in cost of living around West Virginia. Key points include:
The cost of living in Princeton is 91 with 100 being average.
The cost of living in Princeton is 0.9x lower than the national average.
The median home value in Princeton is $166,769.
The median income in Princeton is $43,900.
Princeton's Overall Cost Of Living
Lower Than The National Average
Cost Of Living In Princeton Comparison Table
| Living Expense | Princeton | West Virginia | National Average |
|---|---|---|---|
| Overall | 91 | 86 | 100 |
| Services | 103 | 95 | 100 |
| Groceries | 103 | 95 | 100 |
| Health | 61 | 61 | 100 |
| Housing | 101 | 95 | 100 |
| Transportation | 102 | 93 | 100 |
| Utilities | 102 | 93 | 100 |
Source: Cost of living index, normalized to US average = 100
Princeton, WV Weather
The average high in Princeton is 63.5° and the average low is 41.8°.
There are 85.2 days of precipitation each year.
Expect an average of 37.9 inches of precipitation each year with 29.2 inches of snow.
| Stat | Princeton |
|---|---|
| Average Annual High | 63.5 |
| Average Annual Low | 41.8 |
| Annual Precipitation Days | 85.2 |
| Average Annual Precipitation | 37.9 |
| Average Annual Snowfall | 29.2 |
Average High
Days of Rain
Source: NOAA climate normals (30-year)
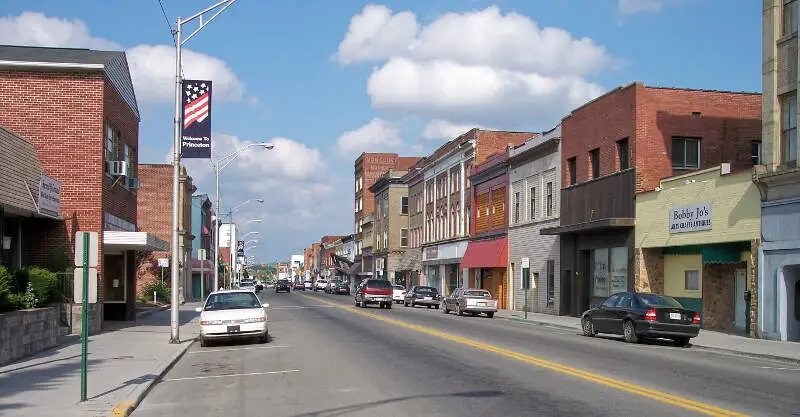
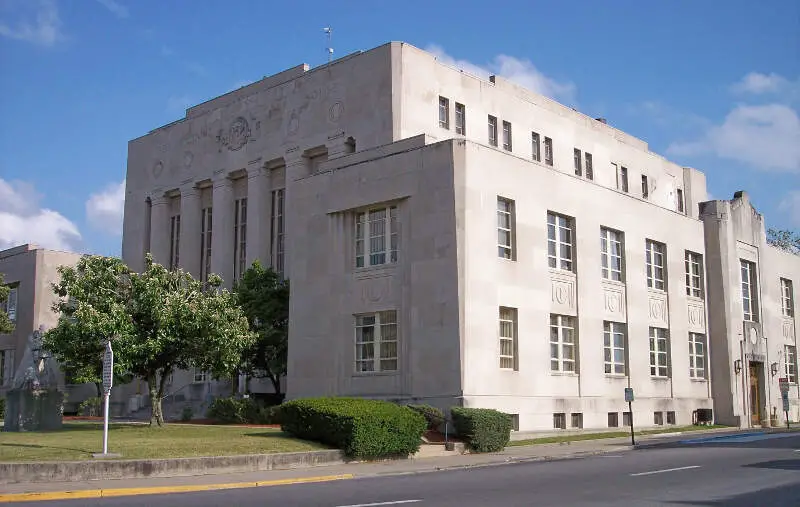
Princeton, WV Photos
2 Reviews & Comments About Princeton

I live in Princeton and their is nothing to do at all
Horrible I got stabbed last time I was visiting
Bedsides the knife in my stomach is the drug problem
Rankings & Articles For Princeton


Locations Around Princeton
Map Of Princeton, WV
Best Places Around Princeton
Blacksburg, VA
Population 45,446
Christiansburg, VA
Population 22,720
Radford, VA
Population 16,726
Pulaski, VA
Population 8,893
Wytheville, VA
Population 8,202
Oak Hill, WV
Population 7,937
Bluefield, VA
Population 4,979
Bluefield, WV
Population 9,387
Richlands, VA
Population 5,171
Marion, VA
Population 5,670
Princeton Demographics And Statistics
Population over time in Princeton
The current population in Princeton is 5,736. The population has decreased 10.0% from 2010.
| Year | Population | % Change |
|---|---|---|
| 2024 | 5,736 | -0.8% |
| 2023 | 5,780 | -0.9% |
| 2022 | 5,833 | -0.9% |
| 2021 | 5,885 | 2.5% |
| 2020 | 5,740 | -1.6% |
| 2019 | 5,831 | -1.3% |
| 2018 | 5,907 | -1.0% |
| 2017 | 5,967 | -1.5% |
| 2016 | 6,056 | -0.4% |
| 2015 | 6,082 | -4.8% |
| 2014 | 6,387 | -1.0% |
| 2013 | 6,454 | 0.4% |
| 2012 | 6,427 | 0.2% |
| 2011 | 6,413 | 0.7% |
| 2010 | 6,370 | - |
Race / Ethnicity in Princeton
See the full breakdown
Princeton is:
88.1% White with 5,053 White residents.
2.6% African American with 147 African American residents.
0.0% American Indian with 2 American Indian residents.
0.1% Asian with 4 Asian residents.
0.0% Hawaiian with 0 Hawaiian residents.
0.0% Other with 0 Other residents.
8.6% Two Or More with 496 Two Or More residents.
0.6% Hispanic with 34 Hispanic residents.
| Race | Princeton | WV | USA |
|---|---|---|---|
| White | 88.1% | 89.7% | 57.4% |
| African American | 2.6% | 3.1% | 11.9% |
| American Indian | 0.0% | 0.1% | 0.5% |
| Asian | 0.1% | 0.8% | 5.9% |
| Hawaiian | 0.0% | 0.0% | 0.2% |
| Other | 0.0% | 0.3% | 0.6% |
| Two Or More | 8.6% | 3.9% | 4.3% |
| Hispanic | 0.6% | 2.1% | 19.3% |
Gender in Princeton
See the full breakdown
Princeton is 51.7% female with 2,965 female residents.
Princeton is 48.3% male with 2,771 male residents.
| Gender | Princeton | WV | USA |
|---|---|---|---|
| Female | 51.7% | 50.1% | 50.5% |
| Male | 48.3% | 49.9% | 49.5% |
Highest level of educational attainment in Princeton for adults over 25
See the full breakdown
5.0% of adults in Princeton completed < 9th grade.
3.0% of adults in Princeton completed 9-12th grade.
40.0% of adults in Princeton completed high school / ged.
22.0% of adults in Princeton completed some college.
9.0% of adults in Princeton completed associate's degree.
12.0% of adults in Princeton completed bachelor's degree.
6.0% of adults in Princeton completed master's degree.
2.0% of adults in Princeton completed professional degree.
1.0% of adults in Princeton completed doctorate degree.
| Education | Princeton | WV | USA |
|---|---|---|---|
| < 9th Grade | 5.0% | 5.0% | 4.0% |
| 9-12th Grade | 3.0% | 7.0% | 6.0% |
| High School / GED | 40.0% | 39.0% | 26.0% |
| Some College | 22.0% | 17.0% | 19.0% |
| Associate's Degree | 9.0% | 8.0% | 9.0% |
| Bachelor's Degree | 12.0% | 14.0% | 22.0% |
| Master's Degree | 6.0% | 7.0% | 10.0% |
| Professional Degree | 2.0% | 2.0% | 2.0% |
| Doctorate Degree | 1.0% | 1.0% | 2.0% |
Household Income For Princeton, West Virginia
See the full breakdown
5.8% of households in Princeton earn Less than $10,000.
5.9% of households in Princeton earn $10,000 to $14,999.
13.7% of households in Princeton earn $15,000 to $24,999.
16.8% of households in Princeton earn $25,000 to $34,999.
13.7% of households in Princeton earn $35,000 to $49,999.
21.4% of households in Princeton earn $50,000 to $74,999.
10.7% of households in Princeton earn $75,000 to $99,999.
5.2% of households in Princeton earn $100,000 to $149,999.
4.6% of households in Princeton earn $150,000 to $199,999.
2.2% of households in Princeton earn $200,000 or more.
| Income | Princeton | WV | USA |
|---|---|---|---|
| Less than $10,000 | 5.8% | 6.2% | 5.0% |
| $10,000 to $14,999 | 5.9% | 5.5% | 3.4% |
| $15,000 to $24,999 | 13.7% | 9.4% | 6.3% |
| $25,000 to $34,999 | 16.8% | 9.2% | 6.6% |
| $35,000 to $49,999 | 13.7% | 12.4% | 10.1% |
| $50,000 to $74,999 | 21.4% | 17.3% | 15.5% |
| $75,000 to $99,999 | 10.7% | 12.7% | 12.6% |
| $100,000 to $149,999 | 5.2% | 15.1% | 17.5% |
| $150,000 to $199,999 | 4.6% | 6.3% | 9.6% |
| $200,000 or more | 2.2% | 5.9% | 13.4% |
Source: U.S. Census ACS 5-year estimates (2024)


