
Most Hispanic/Latino cities in Wisconsin research summary. We used Saturday Night Science to analyze Wisconsin’s most recent Census data to determine the most Hispanic/Latino cities based on the percentage of Hispanic/Latino residents. Here are the results of our analysis:
-
The most Hispanic/Latino city in Wisconsin is Racine, based on the most recent Census data.
-
Racine is 24.43% Hispanic/Latino.
-
The least Hispanic/Latino city in Wisconsin is Richfield.
-
Richfield is 0.72% Hispanic/Latino.
-
Wisconsin is 8.0% Hispanic/Latino.
-
Wisconsin is the 3most Hispanic/Latino state in the United States.
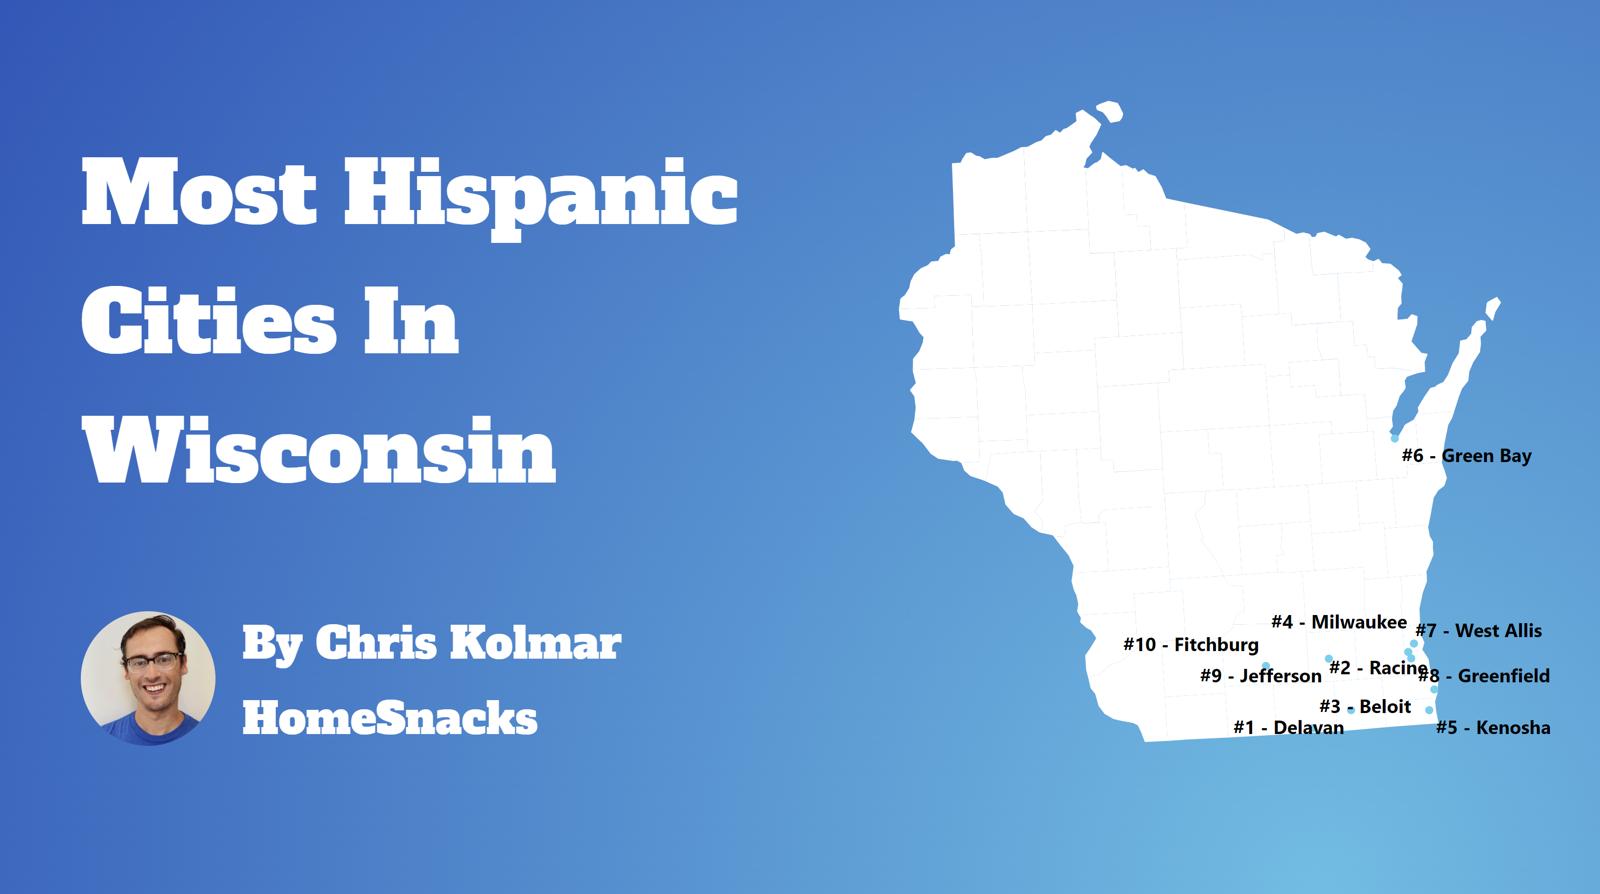
Table Of Contents: Top Ten | Methodology | Summary | Table
The 10 Cities In Wisconsin With The Largest Hispanic Population For 2026
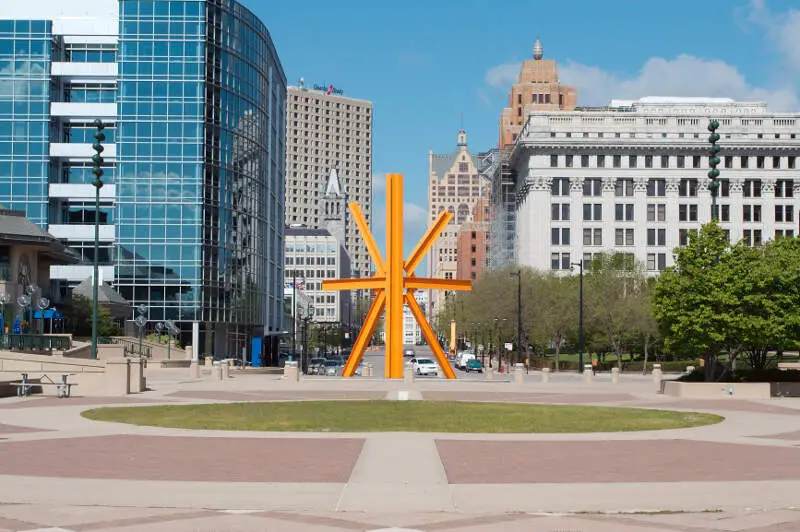
What’s the city in Wisconsin with the largest Hispanic/Latino population? Racine took the number one overall spot for the largest Hispanic population in Wisconsin for 2026.
Continue below to see how we crunched the numbers and how your town ranked.
To see where Wisconsin ranked as a state on diversity, we have a ranking of the most diverse states in America.
And if you already knew these places were Hispanic, check out the best places to live in Wisconsin or the safest places in Wisconsin.

/10
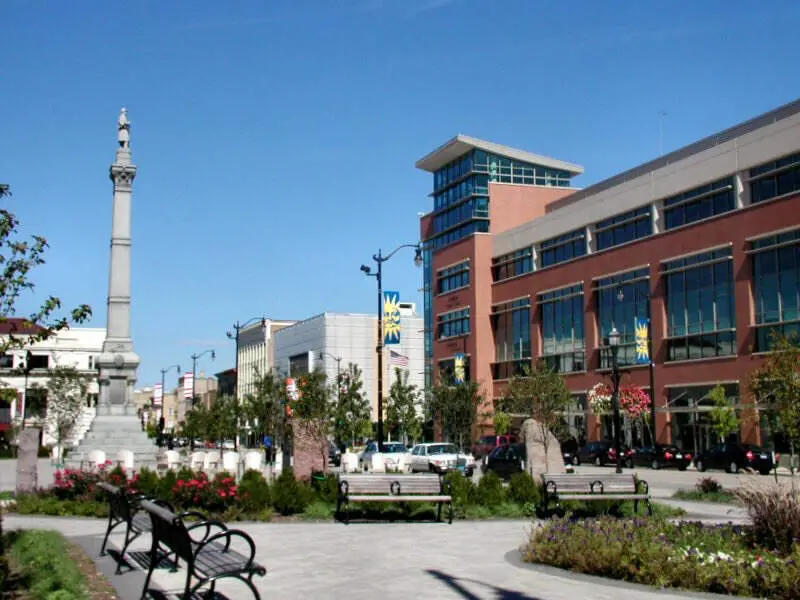
Population: 77,633
# Of Hispanic/Latino Residents: 18,969
% Hispanic/Latino: 24.43%
More on Racine: Data | Crime | Cost Of Living | Movers

/10
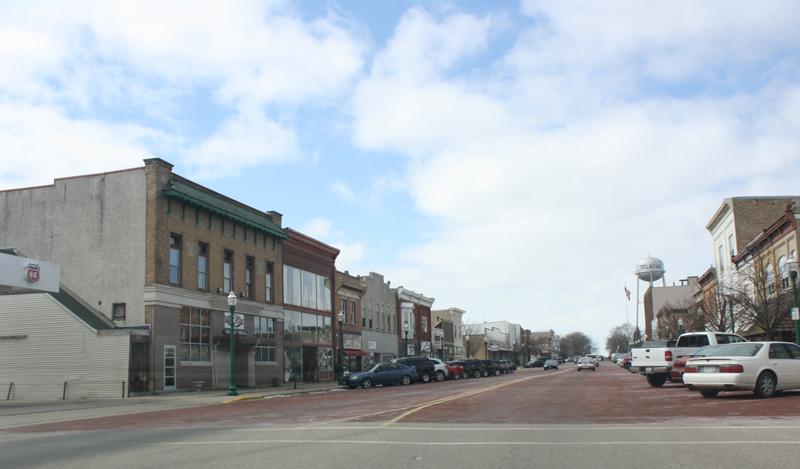
Population: 8,689
# Of Hispanic/Latino Residents: 1,893
% Hispanic/Latino: 21.79%
More on Delavan: Data | Crime | Cost Of Living | Movers

/10
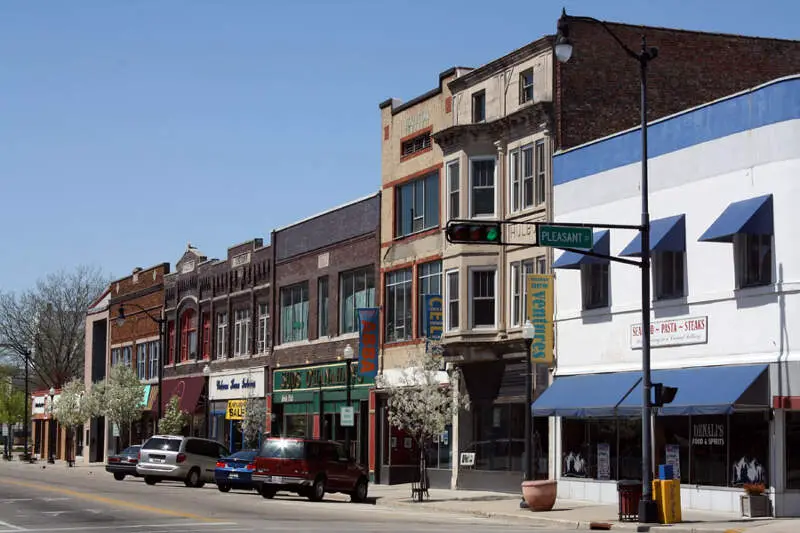
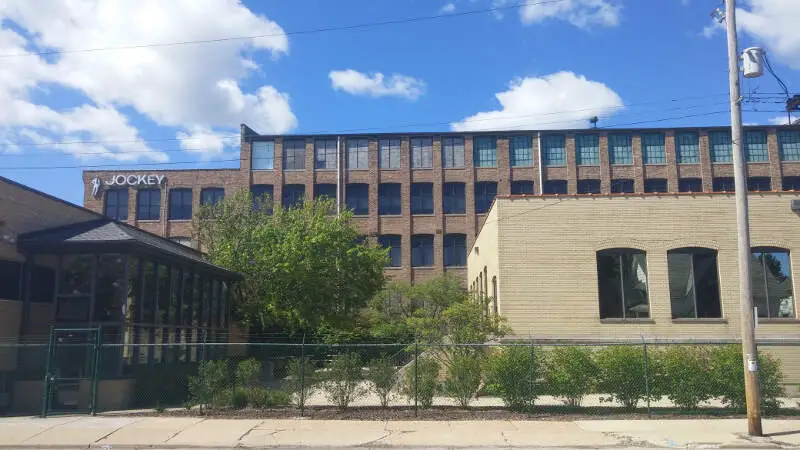
Population: 36,534
# Of Hispanic/Latino Residents: 7,680
% Hispanic/Latino: 21.02%
More on Beloit: Data | Crime | Cost Of Living | Movers

/10
Population: 566,973
# Of Hispanic/Latino Residents: 118,591
% Hispanic/Latino: 20.92%
More on Milwaukee: Data | Crime | Cost Of Living | Movers

/10
Population: 99,372
# Of Hispanic/Latino Residents: 19,032
% Hispanic/Latino: 19.15%
More on Kenosha: Data | Crime | Cost Of Living | Movers

/10
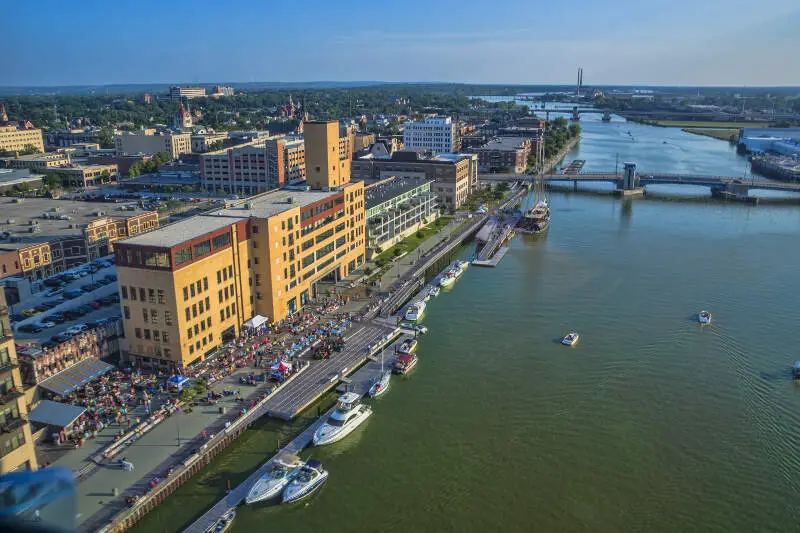
Population: 106,253
# Of Hispanic/Latino Residents: 19,965
% Hispanic/Latino: 18.79%
More on Green Bay: Data | Crime | Cost Of Living | Movers

/10
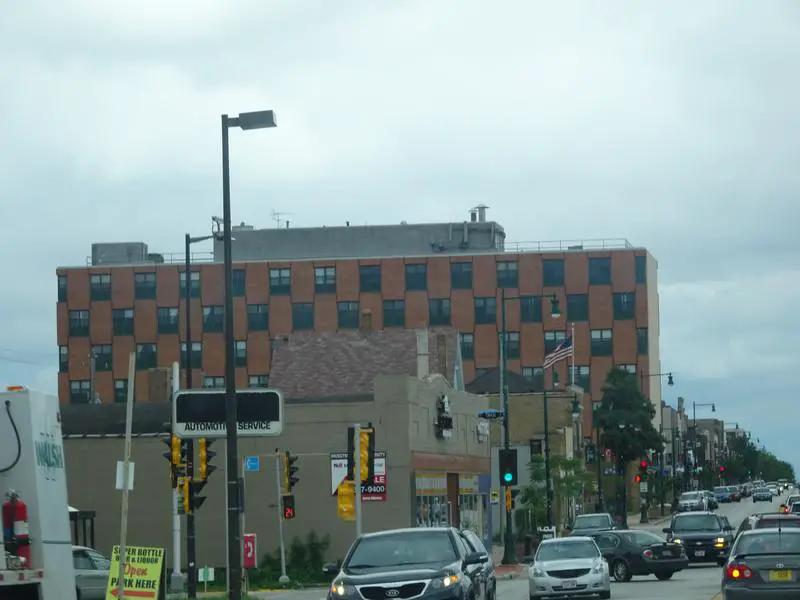
Population: 59,612
# Of Hispanic/Latino Residents: 10,196
% Hispanic/Latino: 17.1%
More on West Allis: Data | Crime | Cost Of Living | Movers

/10
Population: 37,345
# Of Hispanic/Latino Residents: 6,201
% Hispanic/Latino: 16.6%
More on Greenfield: Data | Crime | Cost Of Living | Movers

/10
Population: 7,732
# Of Hispanic/Latino Residents: 1,128
% Hispanic/Latino: 14.59%
More on Jefferson: Data | Crime | Cost Of Living | Movers

/10
Population: 10,221
# Of Hispanic/Latino Residents: 1,482
% Hispanic/Latino: 14.5%
More on Elkhorn: Data | Crime | Cost Of Living | Movers
Methodology: How We Determined The Cities In Wisconsin With The Largest Hispanic Population For 2026
We used Saturday Night Science to compare data on race from the US Census for every city in Wisconsin.
Wisconsin’s most recently available data comes from the 2020-2024 American Community Survey.
Specifically, we looked at table B03002: Hispanic OR LATINO ORIGIN BY RACE. Here are the category names as defined by the Census:
- Hispanic or Latino
- White alone*
- Black or African American alone*
- American Indian and Alaska Native alone*
- Asian alone*
- Native Hawaiian and Other Pacific Islander alone*
- Some other race alone*
- Two or more races*
Our particular column of interest here was the number of people who identified as Hispanic or Latino.
We limited our analysis to places in Wisconsin with a population greater than 5,000 people. That left us with 137 cities.
We then calculated the percentage of Hispanic or Latino residents in each Wisconsin city. The percentages ranked from 24.4% to 0.7%.
Finally, we ranked each city based on the percentage of the Hispanic or Latino population, with a higher score being more Hispanic or Latino than a lower score. Racine was the most Hispanic or Latino, while Richfield was the least Hispanic or Latino city.
We updated this article for 2026. This article represents our eleventh time ranking the cities in Wisconsin with the largest Hispanic/Latino population.
Read on for more information on how the cities in Wisconsin ranked by population of Hispanic or Latino residents or, for a more general take on diversity in America, head over to our ranking of the most diverse cities in America.
Summary: Hispanic or Latino Populations Across Wisconsin
According to the most recent data, this is an accurate list if you’re looking for a breakdown of Latino populations for each place across Wisconsin.
The most Hispanic/Latino cities in Wisconsin are Racine, Delavan, Beloit, Milwaukee, Kenosha, Green Bay, West Allis, Greenfield, Jefferson, and Elkhorn.
If you’re curious enough, here are the least Hispanic or Latino places in Wisconsin:
- Richfield
- Rothschild
- Holmen
For more Wisconsin reading, check out:
Most Hispanic Cities In Wisconsin
| Rank | City | Population | Hispanic Pop. | % Hispanic |
|---|---|---|---|---|
| 1 | Racine | 77,633 | 18,969 | 24.43% |
| 2 | Delavan | 8,689 | 1,893 | 21.79% |
| 3 | Beloit | 36,534 | 7,680 | 21.02% |
| 4 | Milwaukee | 566,973 | 118,591 | 20.92% |
| 5 | Kenosha | 99,372 | 19,032 | 19.15% |
| 6 | Green Bay | 106,253 | 19,965 | 18.79% |
| 7 | West Allis | 59,612 | 10,196 | 17.1% |
| 8 | Greenfield | 37,345 | 6,201 | 16.6% |
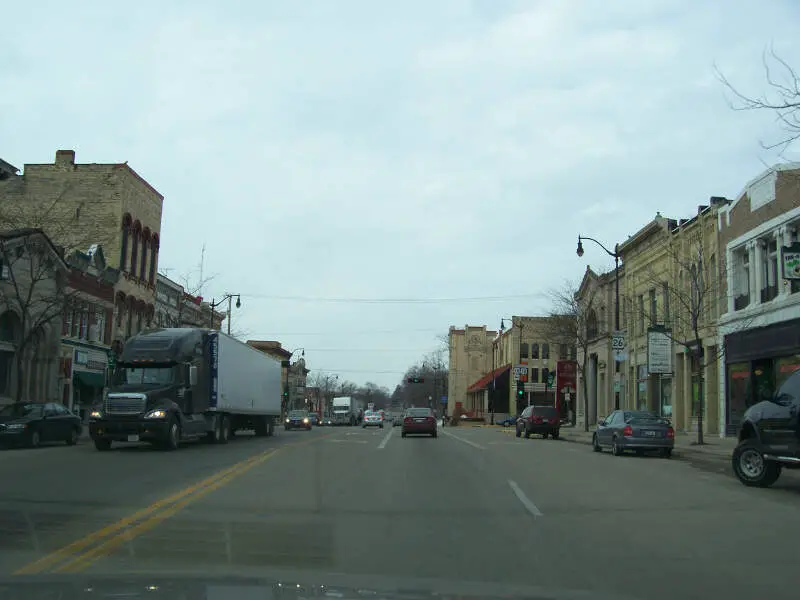
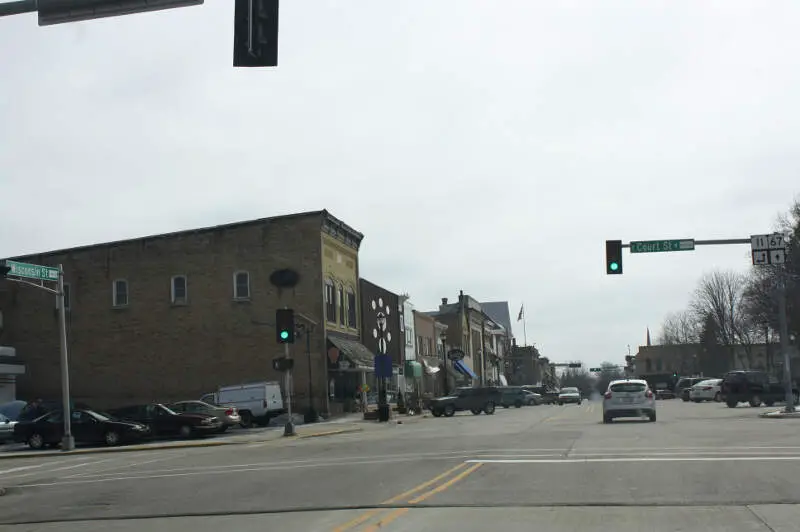
| 9 | Jefferson | 7,732 | 1,128 | 14.59% |
| 10 | Elkhorn | 10,221 | 1,482 | 14.5% |
| 11 | Fitchburg | 32,619 | 4,695 | 14.39% |
| 12 | Reedsburg | 10,168 | 1,449 | 14.25% |
| 13 | Fort Atkinson | 12,463 | 1,715 | 13.76% |
| 14 | Middleton | 22,301 | 3,029 | 13.58% |
| 15 | Mount Pleasant | 27,953 | 3,749 | 13.41% |
| 16 | Sheboygan | 49,645 | 6,401 | 12.89% |
| 17 | Pleasant Prairie | 21,669 | 2,698 | 12.45% |
| 18 | Menasha | 18,273 | 2,255 | 12.34% |
| 19 | Waukesha | 71,233 | 8,765 | 12.3% |
| 20 | Caledonia | 25,257 | 3,077 | 12.18% |
| 21 | South Milwaukee | 20,442 | 2,489 | 12.18% |
| 22 | Oak Creek | 37,325 | 4,544 | 12.17% |
| 23 | Bellevue | 16,442 | 1,926 | 11.71% |
| 24 | St. Francis | 9,004 | 1,043 | 11.58% |
| 25 | Cudahy | 17,853 | 2,035 | 11.4% |
| 26 | Greendale | 14,594 | 1,646 | 11.28% |
| 27 | Berlin | 5,562 | 616 | 11.08% |
| 28 | Beaver Dam | 16,565 | 1,759 | 10.62% |
| 29 | Whitewater | 15,807 | 1,623 | 10.27% |
| 30 | Watertown | 22,774 | 2,153 | 9.45% |
| 31 | Madison | 278,001 | 26,165 | 9.41% |
| 32 | Fond Du Lac | 44,494 | 4,162 | 9.35% |
| 33 | Waupun | 11,174 | 1,039 | 9.3% |
| 34 | Twin Lakes | 6,309 | 565 | 8.96% |
| 35 | Milton | 5,706 | 510 | 8.94% |
| 36 | Hales Corners | 7,689 | 682 | 8.87% |
| 37 | Lake Mills | 6,470 | 558 | 8.62% |
| 38 | Neenah | 27,336 | 2,330 | 8.52% |
| 39 | Brown Deer | 12,564 | 1,067 | 8.49% |
| 40 | Sturtevant | 6,772 | 556 | 8.21% |
| 41 | Burlington | 10,987 | 899 | 8.18% |
| 42 | Deforest | 11,501 | 912 | 7.93% |
| 43 | Monroe | 10,587 | 830 | 7.84% |
| 44 | Janesville | 66,030 | 5,124 | 7.76% |
| 45 | Mukwonago | 8,415 | 636 | 7.56% |
| 46 | Waunakee | 15,687 | 1,140 | 7.27% |
| 47 | New London | 7,726 | 547 | 7.08% |
| 48 | Two Rivers | 11,231 | 768 | 6.84% |
| 49 | Plover | 13,884 | 937 | 6.75% |
| 50 | Shorewood | 13,627 | 904 | 6.63% |
| 51 | Appleton | 75,023 | 4,935 | 6.58% |
| 52 | Manitowoc | 34,620 | 2,271 | 6.56% |
| 53 | Portage | 10,236 | 659 | 6.44% |
| 54 | Glendale | 13,656 | 865 | 6.33% |
| 55 | Sparta | 9,950 | 617 | 6.2% |
| 56 | Edgerton | 6,014 | 372 | 6.19% |
| 57 | Richland Center | 5,109 | 315 | 6.17% |
| 58 | Franklin | 35,886 | 2,192 | 6.11% |
| 59 | Sturgeon Bay | 9,806 | 597 | 6.09% |
| 60 | Hartford | 15,821 | 963 | 6.09% |
| 61 | Hobart | 10,610 | 645 | 6.08% |
| 62 | Lake Geneva | 8,521 | 511 | 6.0% |
| 63 | Muskego | 25,406 | 1,512 | 5.95% |
| 64 | New Berlin | 40,270 | 2,280 | 5.66% |
| 65 | Ripon | 7,772 | 435 | 5.6% |
| 66 | Wausau | 39,996 | 2,169 | 5.42% |
| 67 | Delafield | 7,202 | 380 | 5.28% |
| 68 | Whitefish Bay | 14,665 | 763 | 5.2% |
| 69 | Rice Lake | 9,030 | 455 | 5.04% |
| 70 | Verona | 15,232 | 764 | 5.02% |
| 71 | Wauwatosa | 48,529 | 2,427 | 5.0% |
| 72 | Cottage Grove | 8,513 | 425 | 4.99% |
| 73 | Altoona | 8,878 | 443 | 4.99% |
| 74 | Hartland | 9,972 | 497 | 4.98% |
| 75 | Little Chute | 11,754 | 574 | 4.88% |
| 76 | Platteville | 11,499 | 554 | 4.82% |
| 77 | Menomonee Falls | 39,539 | 1,902 | 4.81% |
| 78 | Ashwaubenon | 17,314 | 816 | 4.71% |
| 79 | Waupaca | 6,283 | 296 | 4.71% |
| 80 | Sun Prairie | 37,570 | 1,766 | 4.7% |
| 81 | Tomah | 9,532 | 448 | 4.7% |
| 82 | West Bend | 32,030 | 1,484 | 4.63% |
| 83 | Kaukauna | 17,706 | 816 | 4.61% |
| 84 | Hudson | 14,959 | 684 | 4.57% |
| 85 | Shawano | 9,522 | 429 | 4.51% |
| 86 | Stevens Point | 25,785 | 1,160 | 4.5% |
| 87 | Brookfield | 41,273 | 1,815 | 4.4% |
| 88 | Pewaukee | 8,196 | 360 | 4.39% |
| 89 | Kimberly | 7,447 | 326 | 4.38% |
| 90 | Ashland | 7,902 | 344 | 4.35% |
| 91 | Mequon | 25,270 | 1,089 | 4.31% |
| 92 | Cedarburg | 12,605 | 543 | 4.31% |
| 93 | Mount Horeb | 7,736 | 331 | 4.28% |
| 94 | Oshkosh | 66,729 | 2,842 | 4.26% |
| 95 | Antigo | 8,069 | 342 | 4.24% |
| 96 | Allouez | 13,975 | 587 | 4.2% |
| 97 | Pewaukee | 16,211 | 672 | 4.15% |
| 98 | Weston | 15,749 | 646 | 4.1% |
| 99 | Merrill | 9,356 | 377 | 4.03% |
| 100 | De Pere | 25,301 | 979 | 3.87% |