Appleton SnackAbility
Overall SnackAbility
Crime in Appleton summary. We use data from the FBI to determine the crime rates in Appleton. Key points include:
There were 1,152 total crimes in Appleton in the last reporting year.
The overall crime rate per 100,000 people in Appleton is 1,548.5 / 100k people.
The violent crime rate per 100,000 people in Appleton is 201.6 / 100k people.
The property crime rate per 100,000 people in Appleton is 1,346.9 / 100k people.
Overall, crime in Appleton is -26.93% below the national average.
Total Crimes
Below National Average
Crime In Appleton Comparison Table
| Statistic | Count Raw |
Appleton / 100k People |
Wisconsin / 100k People |
National / 100k People |
|---|---|---|---|---|
| Total Crimes Per 100K | 1,152 | 1,548.5 | 1,432.6 | 2,119.2 |
| Violent Crime | 150 | 201.6 | 278.5 | 359.0 |
| Murder | 2 | 2.7 | 4.2 | 5.0 |
| Robbery | 7 | 9.4 | 39.4 | 61.0 |
| Aggravated Assault | 102 | 137.1 | 200.1 | 256.0 |
| Property Crime | 1,002 | 1,346.9 | 1,154.1 | 1,760.0 |
| Burglary | 114 | 153.2 | 117.2 | 229.0 |
| Larceny | 841 | 1,130.5 | 875.6 | 1,272.0 |
| Car Theft | 47 | 63.2 | 161.3 | 259.0 |
Source: FBI Uniform Crime Reporting (2024)
Cost of living in Appleton summary. We use data on the cost of living to determine how expensive it is to live in Appleton. Real estate prices drive most of the variance in cost of living around Wisconsin. Key points include:
The cost of living in Appleton is 94 with 100 being average.
The cost of living in Appleton is 0.9x lower than the national average.
The median home value in Appleton is $297,642.
The median income in Appleton is $80,483.
Appleton's Overall Cost Of Living
Lower Than The National Average
Cost Of Living In Appleton Comparison Table
| Living Expense | Appleton | Wisconsin | National Average |
|---|---|---|---|
| Overall | 94 | 98 | 100 |
| Services | 96 | 98 | 100 |
| Groceries | 96 | 100 | 100 |
| Health | 83 | 91 | 100 |
| Housing | 100 | 99 | 100 |
| Transportation | 103 | 102 | 100 |
| Utilities | 95 | 100 | 100 |
Source: Cost of living index, normalized to US average = 100
Appleton, WI Weather
The average high in Appleton is 54.7° and the average low is 36.2°.
There are 65.9 days of precipitation each year.
Expect an average of 30.8 inches of precipitation each year with 42.9 inches of snow.
| Stat | Appleton |
|---|---|
| Average Annual High | 54.7 |
| Average Annual Low | 36.2 |
| Annual Precipitation Days | 65.9 |
| Average Annual Precipitation | 30.8 |
| Average Annual Snowfall | 42.9 |
Average High
Days of Rain
Source: NOAA climate normals (30-year)
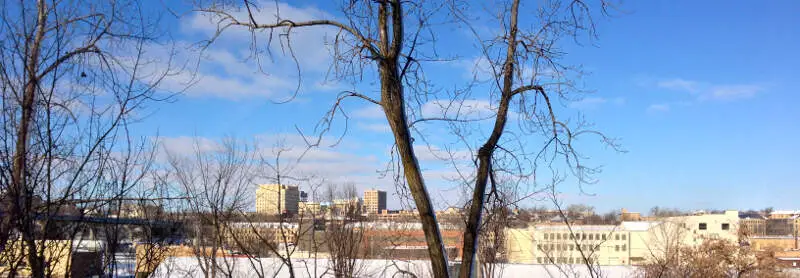
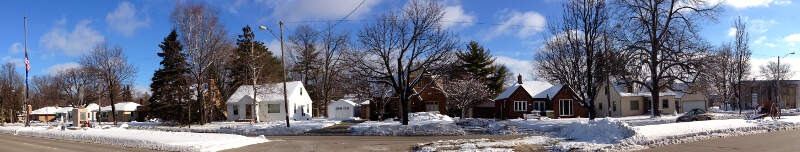
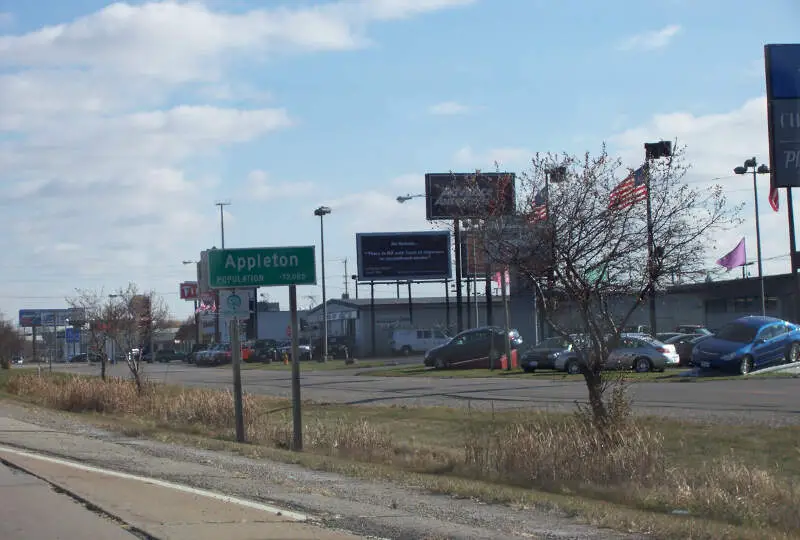
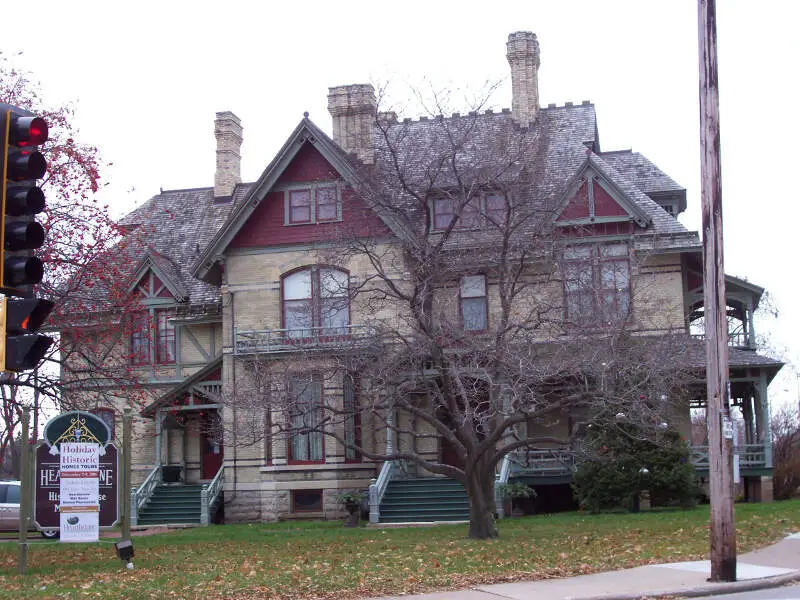
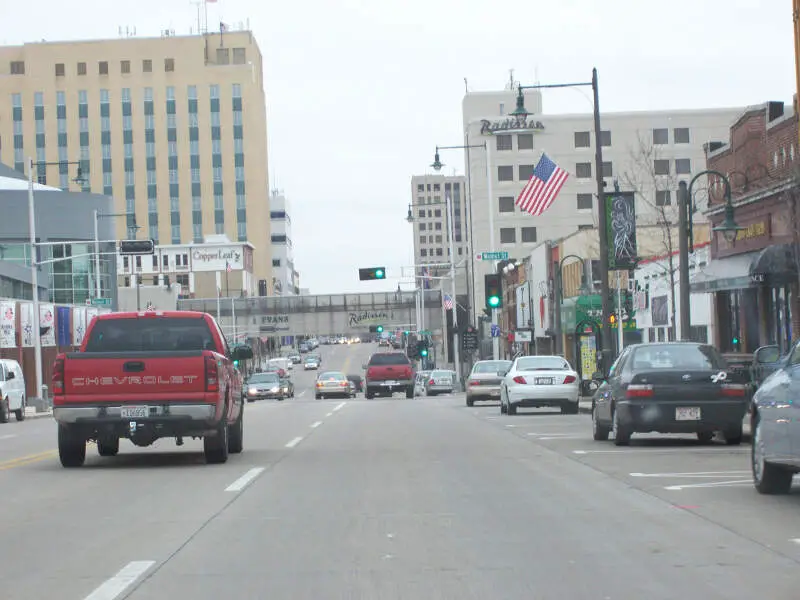
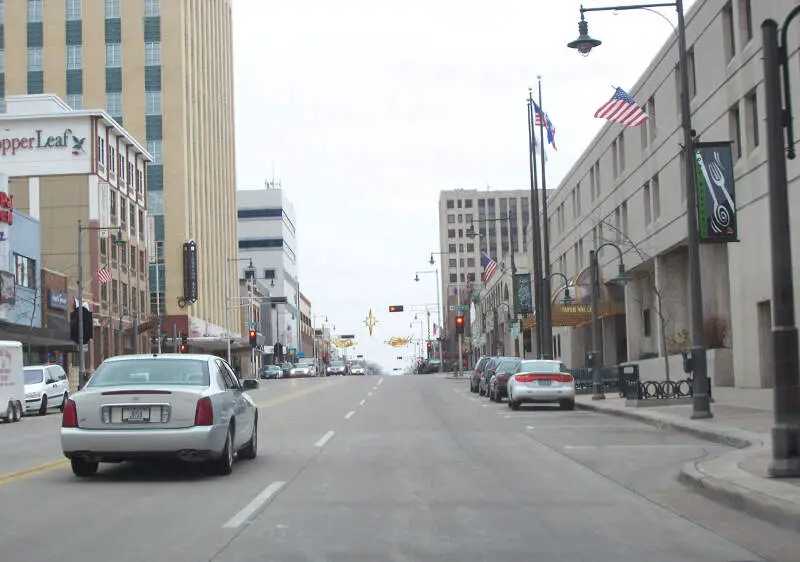
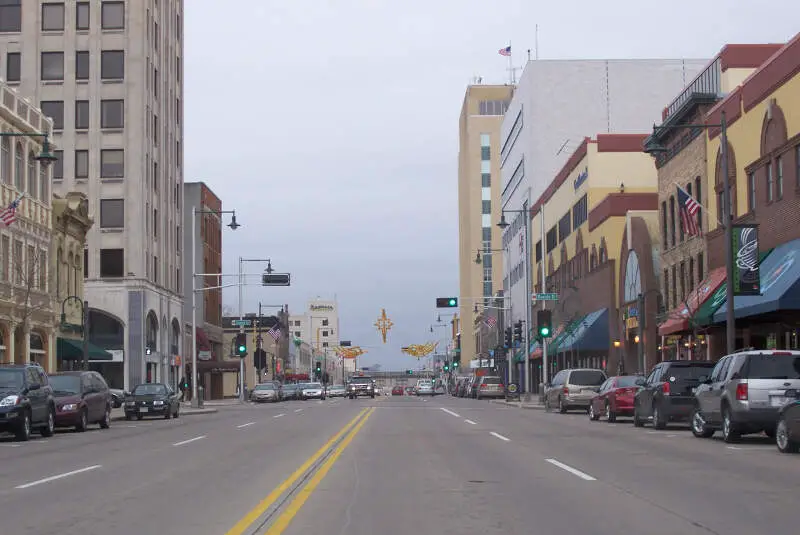
Appleton, WI Photos

Rankings & Articles For Appleton


Locations Around Appleton
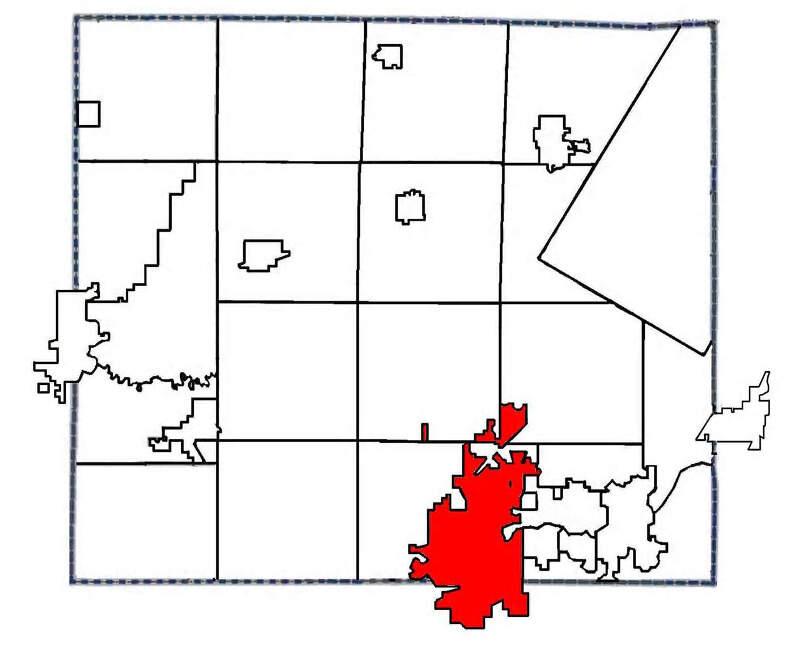
Map Of Appleton, WI
Best Places Around Appleton
Raymore, MO
Population 24,526
Greenwood, MO
Population 6,013
Pleasant Hill, MO
Population 8,847
Warrensburg, MO
Population 19,582
Harrisonville, MO
Population 9,970
Louisburg, KS
Population 5,094
Clinton, MO
Population 9,065
Nevada, MO
Population 7,925
Fort Scott, KS
Population 7,555
Appleton Demographics And Statistics
Population over time in Appleton
The current population in Appleton is 75,023. The population has increased 3.3% from 2010.
| Year | Population | % Change |
|---|---|---|
| 2024 | 75,023 | 0.2% |
| 2023 | 74,873 | -0.3% |
| 2022 | 75,133 | 0.5% |
| 2021 | 74,752 | 1.2% |
| 2020 | 73,891 | -0.3% |
| 2019 | 74,139 | -0.1% |
| 2018 | 74,234 | 0.5% |
| 2017 | 73,832 | 0.5% |
| 2016 | 73,446 | 0.4% |
| 2015 | 73,118 | 0.4% |
| 2014 | 72,861 | -0.1% |
| 2013 | 72,923 | 0.5% |
| 2012 | 72,575 | -0.2% |
| 2011 | 72,716 | 0.1% |
| 2010 | 72,620 | - |
Race / Ethnicity in Appleton
See the full breakdown
Appleton is:
79.5% White with 59,639 White residents.
2.8% African American with 2,130 African American residents.
0.3% American Indian with 237 American Indian residents.
6.6% Asian with 4,961 Asian residents.
0.1% Hawaiian with 47 Hawaiian residents.
0.0% Other with 21 Other residents.
4.1% Two Or More with 3,053 Two Or More residents.
6.6% Hispanic with 4,935 Hispanic residents.
| Race | Appleton | WI | USA |
|---|---|---|---|
| White | 79.5% | 78.6% | 57.4% |
| African American | 2.8% | 5.9% | 11.9% |
| American Indian | 0.3% | 0.5% | 0.5% |
| Asian | 6.6% | 2.9% | 5.9% |
| Hawaiian | 0.1% | 0.0% | 0.2% |
| Other | 0.0% | 0.3% | 0.6% |
| Two Or More | 4.1% | 3.7% | 4.3% |
| Hispanic | 6.6% | 8.0% | 19.3% |
Gender in Appleton
See the full breakdown
Appleton is 50.2% female with 37,689 female residents.
Appleton is 49.8% male with 37,334 male residents.
| Gender | Appleton | WI | USA |
|---|---|---|---|
| Female | 50.2% | 49.9% | 50.5% |
| Male | 49.8% | 50.1% | 49.5% |
Highest level of educational attainment in Appleton for adults over 25
See the full breakdown
4.0% of adults in Appleton completed < 9th grade.
3.0% of adults in Appleton completed 9-12th grade.
25.0% of adults in Appleton completed high school / ged.
18.0% of adults in Appleton completed some college.
13.0% of adults in Appleton completed associate's degree.
26.0% of adults in Appleton completed bachelor's degree.
8.0% of adults in Appleton completed master's degree.
2.0% of adults in Appleton completed professional degree.
1.0% of adults in Appleton completed doctorate degree.
| Education | Appleton | WI | USA |
|---|---|---|---|
| < 9th Grade | 4.0% | 4.0% | 4.0% |
| 9-12th Grade | 3.0% | 4.0% | 6.0% |
| High School / GED | 25.0% | 29.0% | 26.0% |
| Some College | 18.0% | 19.0% | 19.0% |
| Associate's Degree | 13.0% | 11.0% | 9.0% |
| Bachelor's Degree | 26.0% | 22.0% | 22.0% |
| Master's Degree | 8.0% | 8.0% | 10.0% |
| Professional Degree | 2.0% | 2.0% | 2.0% |
| Doctorate Degree | 1.0% | 1.0% | 2.0% |
Household Income For Appleton, Wisconsin
See the full breakdown
3.1% of households in Appleton earn Less than $10,000.
2.8% of households in Appleton earn $10,000 to $14,999.
4.8% of households in Appleton earn $15,000 to $24,999.
5.2% of households in Appleton earn $25,000 to $34,999.
12.6% of households in Appleton earn $35,000 to $49,999.
17.8% of households in Appleton earn $50,000 to $74,999.
14.2% of households in Appleton earn $75,000 to $99,999.
22.0% of households in Appleton earn $100,000 to $149,999.
8.1% of households in Appleton earn $150,000 to $199,999.
9.6% of households in Appleton earn $200,000 or more.
| Income | Appleton | WI | USA |
|---|---|---|---|
| Less than $10,000 | 3.1% | 4.1% | 5.0% |
| $10,000 to $14,999 | 2.8% | 3.0% | 3.4% |
| $15,000 to $24,999 | 4.8% | 5.9% | 6.3% |
| $25,000 to $34,999 | 5.2% | 7.2% | 6.6% |
| $35,000 to $49,999 | 12.6% | 10.8% | 10.1% |
| $50,000 to $74,999 | 17.8% | 17.5% | 15.5% |
| $75,000 to $99,999 | 14.2% | 13.8% | 12.6% |
| $100,000 to $149,999 | 22.0% | 19.1% | 17.5% |
| $150,000 to $199,999 | 8.1% | 9.4% | 9.6% |
| $200,000 or more | 9.6% | 9.2% | 13.4% |
Source: U.S. Census ACS 5-year estimates (2024)


