We used Saturday Night Science to analyze New Jersey’s most recent Census data to determine the divorce rate for each city in New Jersey based on the percentage of currently divorced residents.
The city with the highest divorce rate in New Jersey is South Amboy, with 10.0% of people over 15 years of age being divorced, per the most recent census data. The city with the lowest divorce rate in New Jersey is Woodcliff Lake.
New Jersey is 4.0% divorced overall. There are some 299,001 people living in New Jersey over fifteen years of age who are divorced. You can compare that to the 28,339,199 Americans who are currently divorced.
Isn’t the divorce rate in America close to 50%? Yes indeed. But we’re measuring something else; we are looking at counts and percentages of people over 15 years old who are currently divorced. That 50% statistic is for the percentage of people who have ever been divorced.
So now that we have you biting your nails, rethinking your worldview, and pulling out your hair, let’s look at the places in New Jersey with the highest rates of divorcees.
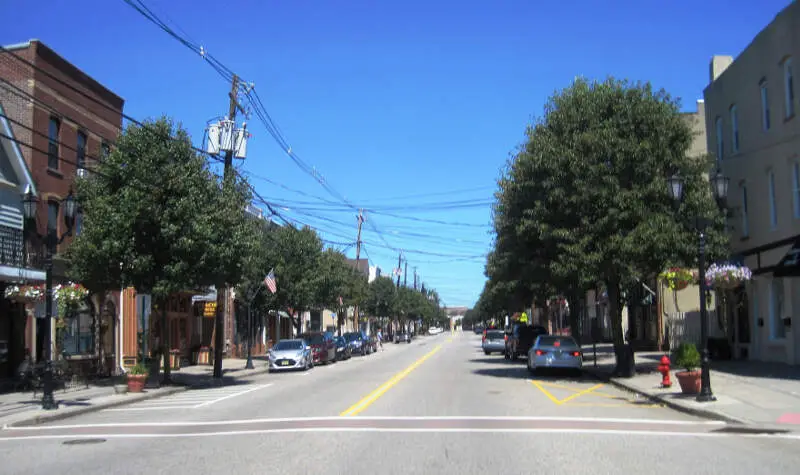
10.0% divorced · #2 highest divorce rate in New Jersey
 Located in
Middlesex County, New Jersey
Located in
Middlesex County, New Jersey
South Amboy is a city in Middlesex County, New Jersey, on the Raritan Bay. As of the 2010 United States Census, the city’s population was 8,631, reflecting an increase of 718 from the 7,913 counted in the 2000 Census, which had in turn increased by 50 from the 7,863 counted in the 1990 Census.
Data | Crime | Cost of living | Movers
10.0% divorced · #2 highest divorce rate in New Jersey
Data | Crime | Cost of living | Movers
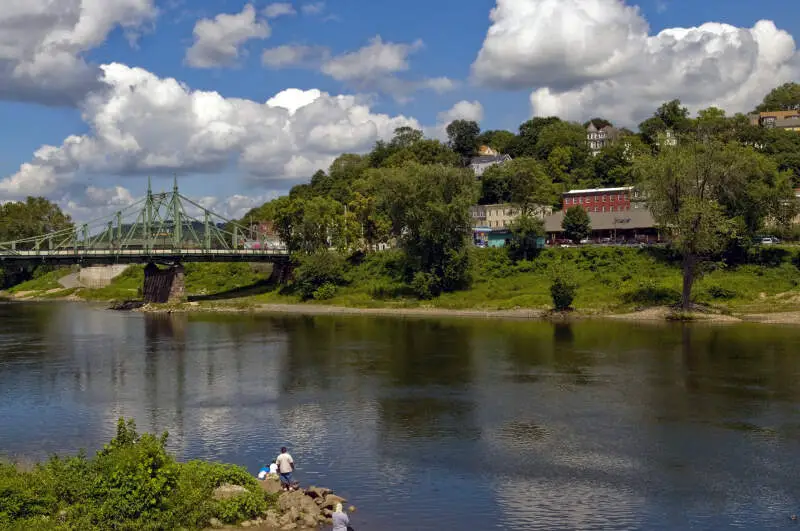
9.0% divorced · #3 highest divorce rate in New Jersey
 Located in
Warren County, New Jersey
Located in
Warren County, New Jersey
Phillipsburg is a town in Warren County, New Jersey, United States, a sister city to the cross-Delaware River industrial partner of Easton, Pennsylvania.
Data | Crime | Cost of living | Movers
8.0% divorced · #8 highest divorce rate in New Jersey
Data | Crime | Cost of living | Movers
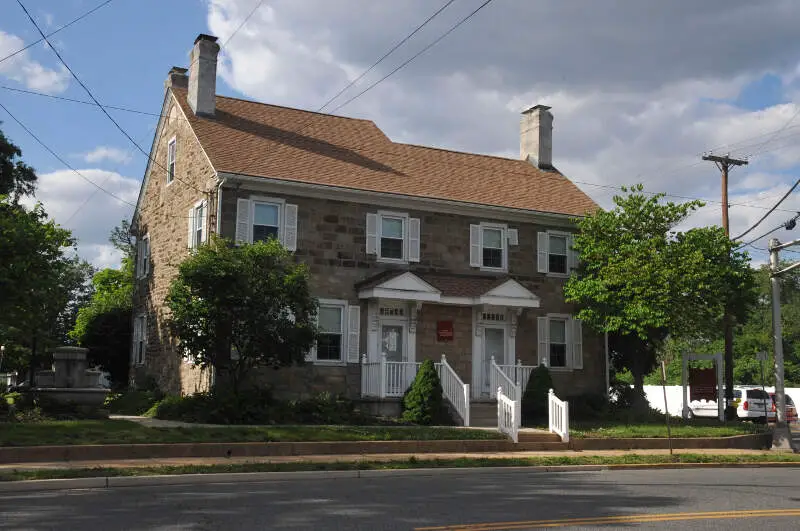
8.0% divorced · #8 highest divorce rate in New Jersey
 Located in
Gloucester County, New Jersey
Located in
Gloucester County, New Jersey
Paulsboro is a borough in Gloucester County, New Jersey, United States. As of the 2010 United States Census, the borough’s population was 6,097, reflecting a decline of 63 from the 6,160 counted in the 2000 Census, which had in turn declined by 417 from the 6,577 counted in the 1990 Census.
Data | Crime | Cost of living | Movers
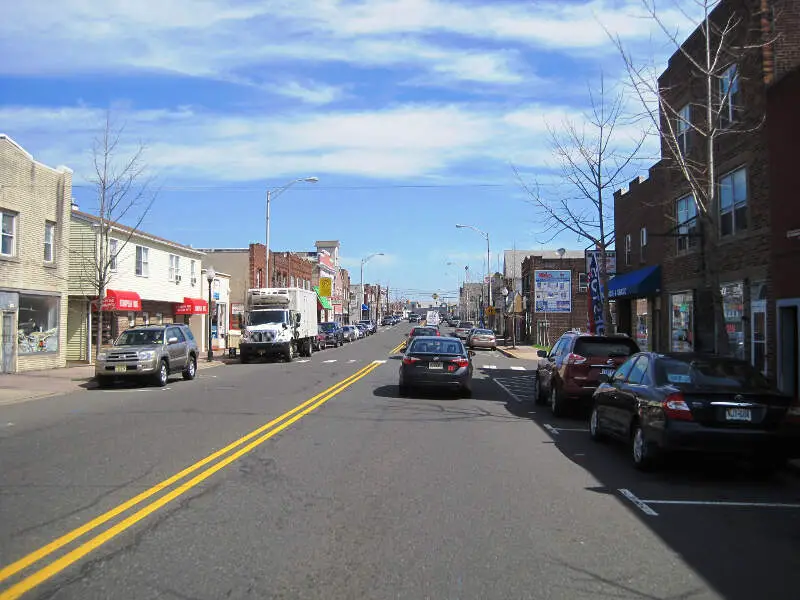
8.0% divorced · #8 highest divorce rate in New Jersey
 Located in
Somerset County, New Jersey
Located in
Somerset County, New Jersey
Data | Crime | Cost of living | Movers
8.0% divorced · #8 highest divorce rate in New Jersey
 Located in
Ocean County, New Jersey
Located in
Ocean County, New Jersey
Point Pleasant is a borough in Ocean County, New Jersey, United States. As of the 2010 United States Census, the borough’s population was 18,392, reflecting a decline of 914 from the 19,306 counted in the 2000 Census, which had in turn increased by 1,129 from the 18,177 counted in the 1990 Census.
Data | Crime | Cost of living | Movers
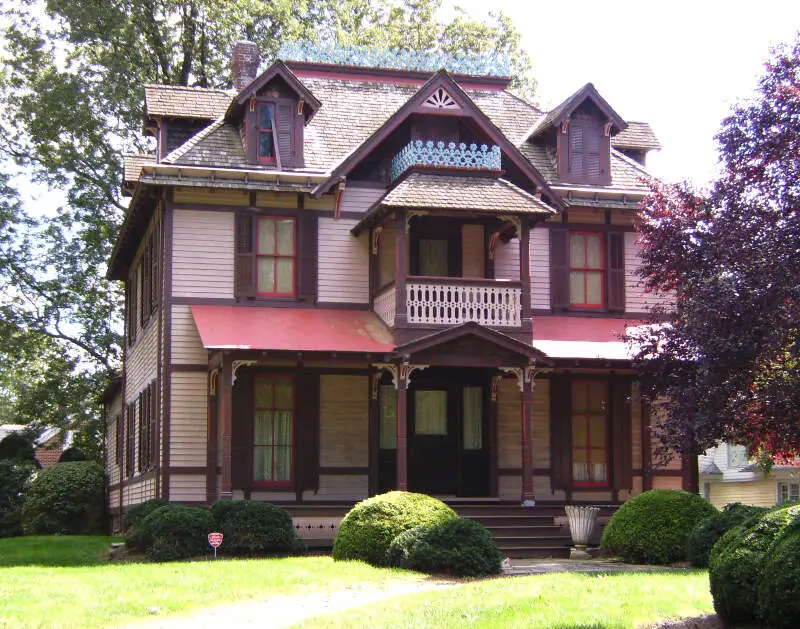
8.0% divorced · #8 highest divorce rate in New Jersey
 Located in
Atlantic County, New Jersey
Located in
Atlantic County, New Jersey
Data | Crime | Cost of living | Movers
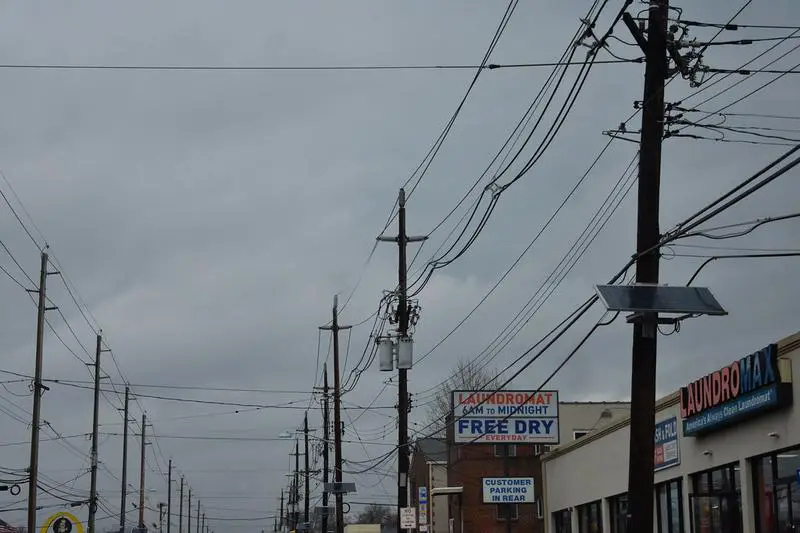
8.0% divorced · #8 highest divorce rate in New Jersey
 Located in
Camden County, New Jersey
Located in
Camden County, New Jersey
Data | Crime | Cost of living | Movers
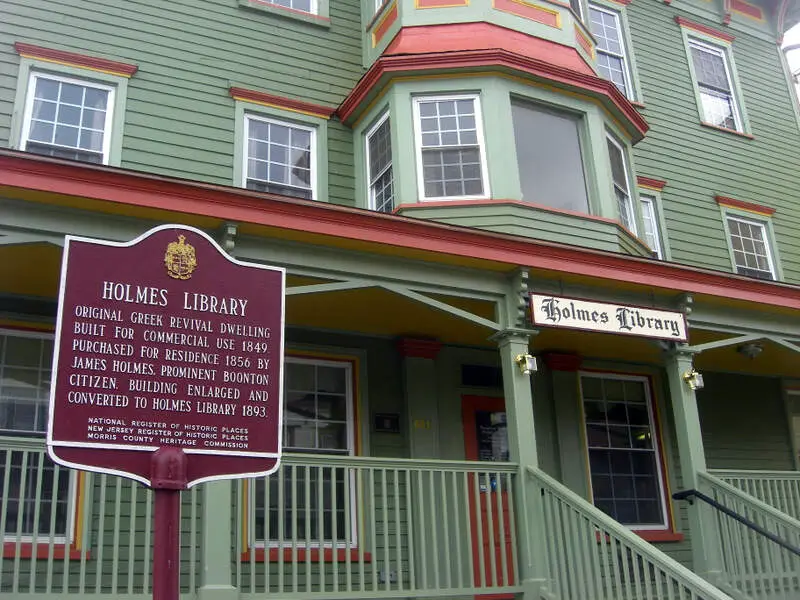
8.0% divorced · #8 highest divorce rate in New Jersey
 Located in
Morris County, New Jersey
Located in
Morris County, New Jersey
Boonton is a town in Morris County, New Jersey, United States. As of the 2010 United States Census, the town’s population was 8,347, reflecting a decline of 149 from the 8,496 counted in the 2000 Census, which had in turn increased by 153 from the 8,343 counted in the 1990 Census. The settlement was originally called “Boone-Towne” in 1761 in honor of the Colonial Governor Thomas Boone.
Data | Crime | Cost of living | Movers
The receipts
Compare the top ten
Pick a metric. The bars rescale. The red line is New Jersey’s statewide median.
New Jersey statewide median: $103,556
On the map
Where New Jersey’s highest divorce rates are
Saturday Night Science
How We Determined The Places In New Jersey That Get Un-Hitched The Most
We used Saturday Night Science to look at the U.S. Census Bureau on divorce rates. Because who likes tracking misery more than the U.S. government?
Specifically, we looked at the 2020-2024 American Community Survey table S1201 — Marital Status. Pretty straightforward on that front — we just had to extract the following column of data:
Today, the analysis focuses on the 189 places in New Jersey with a population of over 5,000.
- Population 15 Years and Over -> Divorced
We ranked each place by the percentage of divorcees over 15 years of age from highest to lowest. We crowned the divorce capital of New Jersey the place with the highest incidence of divorcees, South Amboy.
And if you’re trying to avoid divorce, check out Woodcliff Lake, the city with the lowest divorce rate in New Jersey. We updated this article for 2026 and this list is our eleventh time ranking the cities in New Jersey with the highest divorce rates.
The full plate
Cities With The Highest Divorce Rates In New Jersey
Click any column to sort. Search by city name.
| Rank | City | Population | Divorcees | Divorce Rate |
|---|---|---|---|---|
| 1 | South Amboy | 9,989 | 799 | 10.0% |
| 1 | Mil | 7,059 | 565 | 10.0% |
| 3 | Phillipsburg | 15,299 | 1,102 | 9.0% |
| 8 | Clementon | 5,410 | 346 | 8.0% |
| 8 | Paulsboro | 6,248 | 400 | 8.0% |
| 8 | Manville | 10,921 | 699 | 8.0% |
| 8 | Point Pleasant | 19,334 | 1,237 | 8.0% |
| 8 | Hammonton | 14,840 | 950 | 8.0% |
| 8 | Bellmawr | 11,737 | 751 | 8.0% |
| 8 | Boonton | 8,854 | 567 | 8.0% |
| 8 | Brigantine | 7,674 | 491 | 8.0% |
| 8 | Northfield | 8,456 | 541 | 8.0% |
| 18 | Pine Hill | 10,802 | 605 | 7.0% |
| 18 | Belmar | 5,869 | 329 | 7.0% |
| 18 | Kenilworth | 8,401 | 470 | 7.0% |
| 18 | Millville | 27,511 | 1,541 | 7.0% |
| 18 | Newton | 8,369 | 469 | 7.0% |
| 18 | Mount Arlington | 5,935 | 332 | 7.0% |
| 18 | Gloucester City | 11,509 | 645 | 7.0% |
| 18 | Pitman | 8,856 | 496 | 7.0% |
| 18 | Keansburg | 9,719 | 544 | 7.0% |
| 18 | Butler | 8,133 | 455 | 7.0% |
| 18 | Burlington | 9,993 | 560 | 7.0% |
| 31 | Dunellen | 7,911 | 380 | 6.0% |
| 31 | Salem | 5,322 | 255 | 6.0% |
| 31 | Keyport | 7,171 | 344 | 6.0% |
| 31 | Washington | 7,334 | 352 | 6.0% |
| 31 | Spotswood | 8,171 | 392 | 6.0% |
| 31 | Middlesex | 14,645 | 703 | 6.0% |
| 31 | Manasquan | 5,922 | 284 | 6.0% |
| 31 | Beachwood | 11,088 | 532 | 6.0% |
| 31 | Caldwell | 9,003 | 432 | 6.0% |
| 31 | Long Branch | 32,530 | 1,561 | 6.0% |
| 31 | Hawthorne | 19,628 | 942 | 6.0% |
| 31 | Rumson | 7,241 | 348 | 6.0% |
| 31 | Audubon | 8,730 | 419 | 6.0% |
| 31 | Lincoln Park | 10,957 | 526 | 6.0% |
| 31 | Lindenwold | 21,719 | 1,043 | 6.0% |
| 31 | Watchung | 6,485 | 311 | 6.0% |
| 49 | Tinton Falls | 19,361 | 774 | 5.0% |
| 49 | Eato | 13,575 | 543 | 5.0% |
| 49 | Linwood | 6,992 | 280 | 5.0% |
| 49 | Somers Point | 10,515 | 421 | 5.0% |
| 49 | Oceanport | 6,195 | 248 | 5.0% |
| 49 | Matawan | 9,710 | 388 | 5.0% |
| 49 | Woodbury | 10,042 | 402 | 5.0% |
| 49 | Clayton | 8,921 | 357 | 5.0% |
| 49 | Hopatcong | 14,565 | 583 | 5.0% |
| 49 | Hackett | 10,140 | 406 | 5.0% |
| 49 | Sayreville | 45,838 | 1,834 | 5.0% |
| 49 | Rahway | 30,109 | 1,204 | 5.0% |
| 49 | Red Bank | 12,862 | 514 | 5.0% |
| 49 | Runnemede | 8,355 | 334 | 5.0% |
| 49 | Absecon | 9,170 | 367 | 5.0% |
| 49 | Rockaway | 6,613 | 265 | 5.0% |
| 49 | East Rutherford | 10,313 | 413 | 5.0% |
| 49 | Barrington | 7,076 | 283 | 5.0% |
| 49 | Midland Park | 7,019 | 281 | 5.0% |
| 74 | South River | 16,124 | 516 | 4.0% |
| 74 | Carlstadt | 6,378 | 204 | 4.0% |
| 74 | Wanaque | 11,206 | 359 | 4.0% |
| 74 | Palmyra | 7,485 | 240 | 4.0% |
| 74 | Stratford | 7,018 | 225 | 4.0% |
| 74 | Oakland | 12,768 | 409 | 4.0% |
| 74 | Ringwood | 11,657 | 373 | 4.0% |
| 74 | Totowa | 10,959 | 351 | 4.0% |
| 74 | Bayonne | 71,553 | 2,290 | 4.0% |
| 74 | South Plainfield | 24,473 | 783 | 4.0% |
| 74 | Ridgefield Park | 13,235 | 424 | 4.0% |
| 74 | Somerdale | 5,581 | 179 | 4.0% |
| 74 | Madison | 16,447 | 526 | 4.0% |
| 74 | Lodi | 26,082 | 835 | 4.0% |
| 74 | New Milford | 16,995 | 544 | 4.0% |
| 74 | New Providence | 13,727 | 439 | 4.0% |
| 74 | Bloomingdale | 7,716 | 247 | 4.0% |
| 74 | Bernardsville | 7,916 | 253 | 4.0% |
| 74 | Bound Brook | 12,219 | 391 | 4.0% |
| 74 | Camden | 71,496 | 2,288 | 4.0% |
| 74 | Wood-Ridge | 10,218 | 327 | 4.0% |
| 74 | Atlantic City | 38,632 | 1,236 | 4.0% |
| 74 | Cliffside Park | 25,781 | 825 | 4.0% |
| 74 | Elmwood Park | 21,412 | 685 | 4.0% |
| 74 | Vineland | 61,006 | 1,952 | 4.0% |
| 74 | Pompton Lakes | 11,047 | 354 | 4.0% |
| 74 | Trenton | 90,338 | 2,891 | 4.0% |
| 74 | Dumont | 18,279 | 585 | 4.0% |
| 74 | Ventnor City | 9,265 | 296 | 4.0% |
| 74 | Somerville | 13,410 | 429 | 4.0% |
| 74 | Little Ferry | 10,996 | 352 | 4.0% |
| 74 | Asbury Park | 15,295 | 489 | 4.0% |
| 113 | Haddonfield | 12,595 | 302 | 3.0% |
| 113 | Florham Park | 13,564 | 326 | 3.0% |
| 113 | Fair Haven | 6,170 | 148 | 3.0% |
| 113 | Collingswood | 14,205 | 341 | 3.0% |
| 113 | North Haledon | 8,778 | 211 | 3.0% |
| 113 | North Arlington | 16,461 | 395 | 3.0% |
| 113 | Maywood | 10,093 | 242 | 3.0% |
| 113 | Haddon Heights | 7,516 | 180 | 3.0% |
| 113 | Haledon | 8,980 | 216 | 3.0% |
| 113 | Summit | 22,705 | 545 | 3.0% |
Source: U.S. Census ACS 2020-2024. 189 cities with more than 5,000 residents.
Summary
Getting Some Closure In New Jersey After Untying The Knot
We now have a sense of what places in the Garden State don’t pay much attention to the whole “’til death do we part” phrase.
The cities with the highest divorce rate in New Jersey are South Amboy, Mil, Phillipsburg, Clementon, Paulsboro, Manville, Point Pleasant, Hammonton, Bellmawr, and Boonton.
Try to keep in mind that the reason cities rank where they do in New Jersey could be because of the age, education, and income distribution, as all of those things impact the rate of divorce. Not sold on New Jersey? Take the two-minute Find Your Place quiz and see which state actually fits you.
Questions and answers
Divorce In New Jersey FAQs
What city in New Jersey has the highest divorce rate?
South Amboy has the highest divorce rate in New Jersey for 2026, with 10.0% of residents over 15 currently divorced. Mil and Phillipsburg are next.
What is the divorce rate in New Jersey?
New Jersey is 4.0% divorced overall, versus a US divorce rate of 10.9%. That counts residents over 15 who are currently divorced, per the Census American Community Survey.
What are the divorce capitals of New Jersey?
The New Jersey cities with the highest divorce rates are South Amboy, Mil, Phillipsburg, Clementon, Paulsboro, Manville, Point Pleasant, Hammonton, Bellmawr, and Boonton. We ranked all 189 cities with more than 5,000 residents.
Where do marriages last in New Jersey?
Woodcliff Lake posts the lowest divorce rate of the 189 New Jersey cities we ranked. Whatever they are doing there, it appears to be working.
How do you measure divorce rates?
We use the share of residents aged 15 and over who report being currently divorced in the Census American Community Survey. It is a snapshot of marital status today, not a count of divorces filed each year.