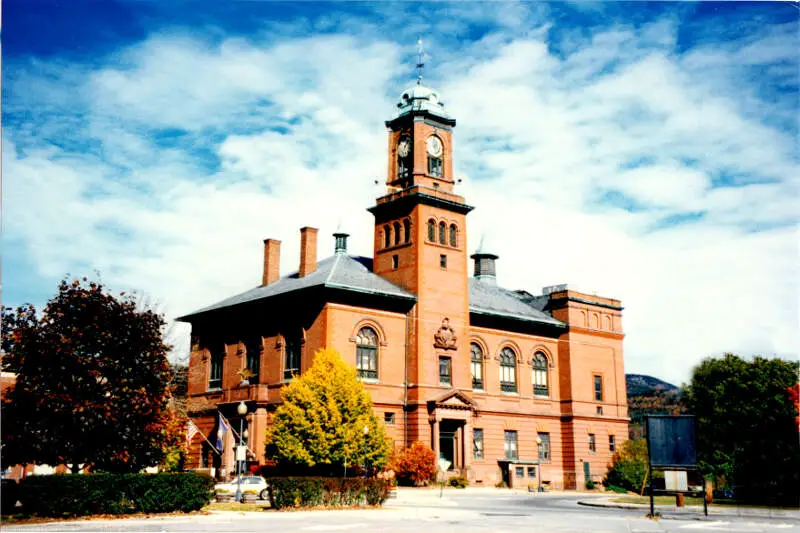
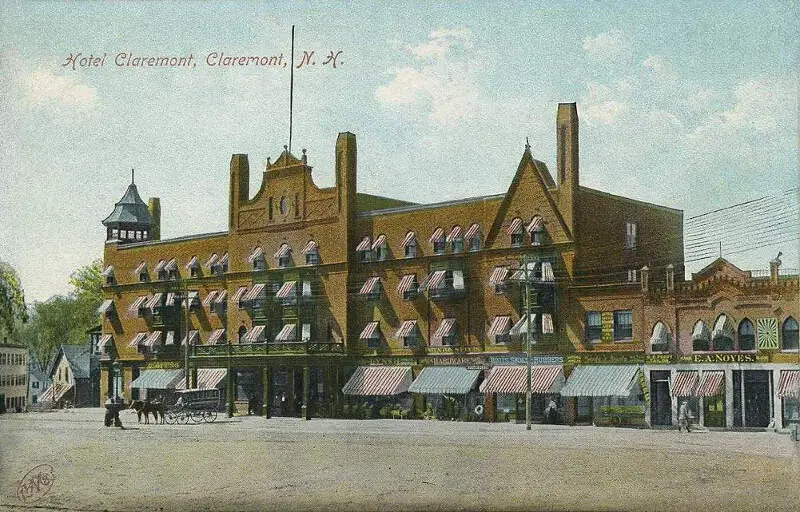
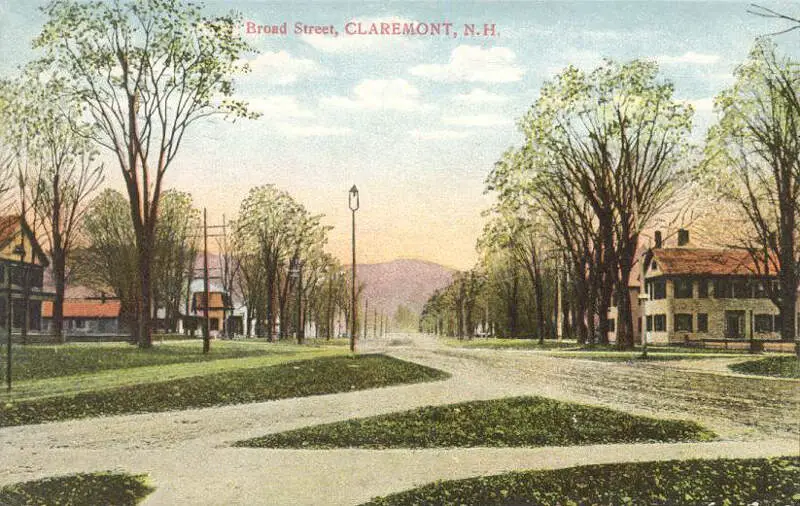
Claremont, NH
Demographics And Statistics
Living In Claremont, New Hampshire Summary
Life in Claremont research summary. HomeSnacks has been using Saturday Night Science to research the quality of life in Claremont over the past nine years using Census, FBI, Zillow, and other primary data sources. Based on the most recently available data, we found the following about life in Claremont:
The population in Claremont is 13,054.
The median home value in Claremont is $275,595.
The median income in Claremont is $54,520.
The cost of living in Claremont is 107 which is 1.1x higher than the national average.
The median rent in Claremont is $1,077.
The unemployment rate in Claremont is 3.4%.
The poverty rate in Claremont is 15.2%.
The average high in Claremont is 56.2° and the average low is 33.6°.
Claremont SnackAbility
Overall SnackAbility
Claremont, NH Crime Report
Crime in Claremont summary. We use data from the FBI to determine the crime rates in Claremont. Key points include:
There were 271 total crimes in Claremont in the last reporting year.
The overall crime rate per 100,000 people in Claremont is 2,058.5 / 100k people.
The violent crime rate per 100,000 people in Claremont is 189.9 / 100k people.
The property crime rate per 100,000 people in Claremont is 1,868.6 / 100k people.
Overall, crime in Claremont is -2.87% below the national average.
Total Crimes
Below National Average
Crime In Claremont Comparison Table
| Statistic | Count Raw |
Claremont / 100k People |
New Hampshire / 100k People |
National / 100k People |
|---|---|---|---|---|
| Total Crimes Per 100K | 271 | 2,058.5 | 1,028.1 | 2,119.2 |
| Violent Crime | 25 | 189.9 | 110.1 | 359.0 |
| Murder | 0 | 0.0 | 1.0 | 5.0 |
| Robbery | 5 | 38.0 | 12.6 | 61.0 |
| Aggravated Assault | 16 | 121.5 | 62.8 | 256.0 |
| Property Crime | 246 | 1,868.6 | 918.0 | 1,760.0 |
| Burglary | 20 | 151.9 | 48.1 | 229.0 |
| Larceny | 209 | 1,587.5 | 805.4 | 1,272.0 |
| Car Theft | 17 | 129.1 | 64.4 | 259.0 |
Claremont, NH Cost Of Living
Cost of living in Claremont summary. We use data on the cost of living to determine how expensive it is to live in Claremont. Real estate prices drive most of the variance in cost of living around New Hampshire. Key points include:
The cost of living in Claremont is 107 with 100 being average.
The cost of living in Claremont is 1.1x higher than the national average.
The median home value in Claremont is $275,595.
The median income in Claremont is $54,520.
Claremont's Overall Cost Of Living
Higher Than The National Average
Cost Of Living In Claremont Comparison Table
| Living Expense | Claremont | New Hampshire | National Average | |
|---|---|---|---|---|
| Overall | 107 | 116 | 100 | |
| Services | 122 | 118 | 100 | |
| Groceries | 102 | 103 | 100 | |
| Health | 111 | 114 | 100 | |
| Housing | 81 | 122 | 100 | |
| Transportation | 108 | 110 | 100 | |
| Utilities | 132 | 132 | 100 | |
Claremont, NH Weather
The average high in Claremont is 56.2° and the average low is 33.6°.
There are 80.4 days of precipitation each year.
Expect an average of 42.8 inches of precipitation each year with 65.4 inches of snow.
| Stat | Claremont |
|---|---|
| Average Annual High | 56.2 |
| Average Annual Low | 33.6 |
| Annual Precipitation Days | 80.4 |
| Average Annual Precipitation | 42.8 |
| Average Annual Snowfall | 65.4 |
Average High
Days of Rain
Claremont, NH Photos

1 Reviews & Comments About Claremont
/5

HomeSnacks User - None
If a person is looking to move to a state for a growing family, NH is probably not for them. Only those of us with professional occupations can even get a decent job here, and then nowhere near the pay youd get elsewhere. Hubby and I moved to Colebrook when we each got out of the Air Force we only stayed there a year, as that place didnt even have a national store chain of any kind. We then moved to Claremont, where we raised our kids for the next 10 years. I am a nurse, hubby was a lab tech at the time, so finding jobs was very easy. We love that our children grew up with great schools, clean neighborhoods, and nice people. I feel I should mention that were a multiracial family, but never got nasty looks, etc. for it.
Rankings for Claremont in New Hampshire


Locations Around Claremont
Map Of Claremont, NH
Claremont Demographics And Statistics
Population over time in Claremont
The current population in Claremont is 13,054. The population has decreased -3.1% from 2010.
| Year | Population | % Change |
|---|---|---|
| 2023 | 13,054 | 0.3% |
| 2022 | 13,018 | 0.5% |
| 2021 | 12,955 | -0.1% |
| 2020 | 12,969 | -0.1% |
| 2019 | 12,977 | -0.3% |
| 2018 | 13,016 | -0.1% |
| 2017 | 13,028 | 0.0% |
| 2016 | 13,022 | -0.4% |
| 2015 | 13,076 | -0.7% |
| 2014 | 13,169 | -0.4% |
| 2013 | 13,224 | -0.6% |
| 2012 | 13,304 | -0.9% |
| 2011 | 13,422 | -0.4% |
| 2010 | 13,470 | - |
Race / Ethnicity in Claremont
Claremont is:
87.1% White with 11,365 White residents.
1.3% African American with 175 African American residents.
0.0% American Indian with 0 American Indian residents.
0.4% Asian with 46 Asian residents.
0.0% Hawaiian with 0 Hawaiian residents.
0.0% Other with 0 Other residents.
6.1% Two Or More with 799 Two Or More residents.
5.1% Hispanic with 669 Hispanic residents.
| Race | Claremont | NH | USA |
|---|---|---|---|
| White | 87.1% | 87.5% | 58.2% |
| African American | 1.3% | 1.4% | 12.0% |
| American Indian | 0.0% | 0.1% | 0.5% |
| Asian | 0.4% | 2.6% | 5.7% |
| Hawaiian | 0.0% | 0.0% | 0.2% |
| Other | 0.0% | 0.4% | 0.5% |
| Two Or More | 6.1% | 3.5% | 3.9% |
| Hispanic | 5.1% | 4.5% | 19.0% |
Gender in Claremont
Claremont is 48.4% female with 6,313 female residents.
Claremont is 51.6% male with 6,740 male residents.
| Gender | Claremont | NH | USA |
|---|---|---|---|
| Female | 48.4% | 50.1% | 50.5% |
| Male | 51.6% | 49.9% | 49.5% |
Highest level of educational attainment in Claremont for adults over 25
4.0% of adults in Claremont completed < 9th grade.
10.0% of adults in Claremont completed 9-12th grade.
47.0% of adults in Claremont completed high school / ged.
11.0% of adults in Claremont completed some college.
8.0% of adults in Claremont completed associate's degree.
14.0% of adults in Claremont completed bachelor's degree.
5.0% of adults in Claremont completed master's degree.
0.0% of adults in Claremont completed professional degree.
1.0% of adults in Claremont completed doctorate degree.
| Education | Claremont | NH | USA |
|---|---|---|---|
| < 9th Grade | 4.0% | 2.0% | 5.0% |
| 9-12th Grade | 10.0% | 4.0% | 6.0% |
| High School / GED | 47.0% | 27.0% | 26.0% |
| Some College | 11.0% | 17.0% | 19.0% |
| Associate's Degree | 8.0% | 10.0% | 9.0% |
| Bachelor's Degree | 14.0% | 24.0% | 21.0% |
| Master's Degree | 5.0% | 12.0% | 10.0% |
| Professional Degree | 0.0% | 2.0% | 2.0% |
| Doctorate Degree | 1.0% | 2.0% | 2.0% |
Household Income For Claremont, New Hampshire
7.6% of households in Claremont earn Less than $10,000.
5.7% of households in Claremont earn $10,000 to $14,999.
8.6% of households in Claremont earn $15,000 to $24,999.
8.7% of households in Claremont earn $25,000 to $34,999.
16.8% of households in Claremont earn $35,000 to $49,999.
16.4% of households in Claremont earn $50,000 to $74,999.
14.3% of households in Claremont earn $75,000 to $99,999.
12.8% of households in Claremont earn $100,000 to $149,999.
4.9% of households in Claremont earn $150,000 to $199,999.
4.3% of households in Claremont earn $200,000 or more.
| Income | Claremont | NH | USA |
|---|---|---|---|
| Less than $10,000 | 7.6% | 2.9% | 4.9% |
| $10,000 to $14,999 | 5.7% | 2.5% | 3.6% |
| $15,000 to $24,999 | 8.6% | 5.0% | 6.6% |
| $25,000 to $34,999 | 8.7% | 5.6% | 6.8% |
| $35,000 to $49,999 | 16.8% | 8.4% | 10.4% |
| $50,000 to $74,999 | 16.4% | 14.6% | 15.7% |
| $75,000 to $99,999 | 14.3% | 12.9% | 12.7% |
| $100,000 to $149,999 | 12.8% | 20.0% | 17.4% |
| $150,000 to $199,999 | 4.9% | 12.2% | 9.3% |
| $200,000 or more | 4.3% | 15.7% | 12.6% |


