Oakland, CA
Demographics And Statistics
Living In Oakland, California Summary
Life in Oakland research summary. HomeSnacks has been using Saturday Night Science to research the quality of life in Oakland over the past nine years using Census, FBI, Zillow, and other primary data sources. Based on the most recently available data, we found the following about life in Oakland:
The population in Oakland is 438,072.
The median home value in Oakland is $700,691.
The median income in Oakland is $97,369.
The cost of living in Oakland is 183 which is 1.8x higher than the national average.
The median rent in Oakland is $1,917.
The unemployment rate in Oakland is 6.0%.
The poverty rate in Oakland is 13.7%.
The average high in Oakland is 67.8° and the average low is 49.9°.
Oakland SnackAbility
Overall SnackAbility
Oakland, CA Crime Report
Crime in Oakland summary. We use data from the FBI to determine the crime rates in Oakland. Key points include:
There were 39,831 total crimes in Oakland in the last reporting year.
The overall crime rate per 100,000 people in Oakland is 9,155.7 / 100k people.
The violent crime rate per 100,000 people in Oakland is 1,925.3 / 100k people.
The property crime rate per 100,000 people in Oakland is 7,230.3 / 100k people.
Overall, crime in Oakland is 332.03% above the national average.
Total Crimes
Above National Average
Crime In Oakland Comparison Table
| Statistic | Count Raw |
Oakland / 100k People |
California / 100k People |
National / 100k People |
|---|---|---|---|---|
| Total Crimes Per 100K | 39,831 | 9,155.7 | 2,564.5 | 2,119.2 |
| Violent Crime | 8,376 | 1,925.3 | 486.0 | 359.0 |
| Murder | 81 | 18.6 | 4.5 | 5.0 |
| Robbery | 2,960 | 680.4 | 119.1 | 61.0 |
| Aggravated Assault | 5,039 | 1,158.3 | 325.8 | 256.0 |
| Property Crime | 31,455 | 7,230.3 | 2,078.4 | 1,760.0 |
| Burglary | 3,423 | 786.8 | 305.8 | 229.0 |
| Larceny | 18,118 | 4,164.7 | 1,345.2 | 1,272.0 |
| Car Theft | 9,914 | 2,278.9 | 427.5 | 259.0 |
Oakland, CA Cost Of Living
Cost of living in Oakland summary. We use data on the cost of living to determine how expensive it is to live in Oakland. Real estate prices drive most of the variance in cost of living around California. Key points include:
The cost of living in Oakland is 183 with 100 being average.
The cost of living in Oakland is 1.8x higher than the national average.
The median home value in Oakland is $700,691.
The median income in Oakland is $97,369.
Oakland's Overall Cost Of Living
Higher Than The National Average
Cost Of Living In Oakland Comparison Table
| Living Expense | Oakland | California | National Average | |
|---|---|---|---|---|
| Overall | 183 | 141 | 100 | |
| Services | 115 | 110 | 100 | |
| Groceries | 119 | 112 | 100 | |
| Health | 122 | 110 | 100 | |
| Housing | 326 | 195 | 100 | |
| Transportation | 130 | 125 | 100 | |
| Utilities | 134 | 128 | 100 | |
Oakland, CA Weather
The average high in Oakland is 67.8° and the average low is 49.9°.
There are 42.8 days of precipitation each year.
Expect an average of 21.8 inches of precipitation each year with 0.0 inches of snow.
| Stat | Oakland |
|---|---|
| Average Annual High | 67.8 |
| Average Annual Low | 49.9 |
| Annual Precipitation Days | 42.8 |
| Average Annual Precipitation | 21.8 |
| Average Annual Snowfall | 0.0 |
Average High
Days of Rain
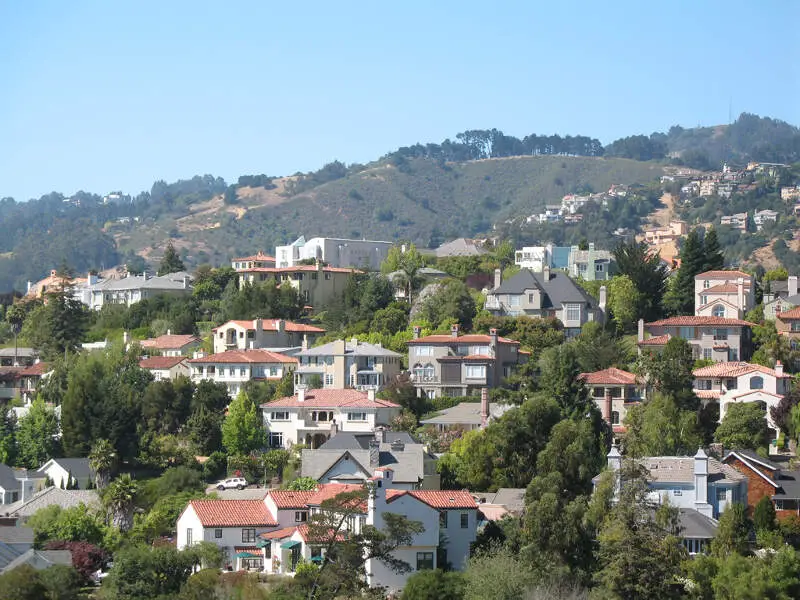
Oakland, CA Photos


5 Reviews & Comments About Oakland
/5

Tuck3r - None
I live in Oakland and it's not bad outside of East and West Oakland. For some context, the clip at the end of the video isn't from California.
ETG - None
i lived in richmond all my life and Oakland is way worse then Richmond theres hardly any police there and they wait for the shootings to be over then they show up lol
Kalea Jordan - None
My dad grew up in Oakland and I live in San Leandro and he never had anything happen to him and I use to always go to Oakland to do my basketball practice
Trent S56 - None
Yeah I live in Oakland !. And it really s***s !!!.
HomeSnacks User - 2019-03-18 16:51:19.373767
To everybody thinking about moving to Oakland : It's dreadful, horrible chaos. Please just stay where you are.
Actually, Oakland s a wonderful place to live. We just don't need any more people here. Really.
Bad: weather. Bad: diverse, fun population. You've been warned. Lol
Oakland Articles


Rankings for Oakland in California
Locations Around Oakland
Map Of Oakland, CA
Best Places Around Oakland
San Carlos, CA
Population 29,797
Piedmont, CA
Population 11,012
San Lorenzo, CA
Population 29,453
San Mateo, CA
Population 103,555
San Bruno, CA
Population 42,612
Belmont, CA
Population 27,505
San Ramon, CA
Population 85,734
Kensington, CA
Population 5,292
Millbrae, CA
Population 22,589
Fairview, CA
Population 10,033
Oakland Demographics And Statistics
Population over time in Oakland
The current population in Oakland is 438,072. The population has increased 13.2% from 2010.
| Year | Population | % Change |
|---|---|---|
| 2023 | 438,072 | 0.1% |
| 2022 | 437,825 | 0.1% |
| 2021 | 437,548 | 3.5% |
| 2020 | 422,575 | -0.6% |
| 2019 | 425,097 | 1.0% |
| 2018 | 421,042 | 0.9% |
| 2017 | 417,442 | 1.3% |
| 2016 | 412,040 | 1.0% |
| 2015 | 408,073 | 1.4% |
| 2014 | 402,339 | 1.3% |
| 2013 | 397,011 | 1.0% |
| 2012 | 392,890 | 0.9% |
| 2011 | 389,397 | 0.6% |
| 2010 | 386,909 | - |
Race / Ethnicity in Oakland
Oakland is:
27.9% White with 122,007 White residents.
20.5% African American with 89,973 African American residents.
0.3% American Indian with 1,371 American Indian residents.
15.3% Asian with 67,225 Asian residents.
0.4% Hawaiian with 1,839 Hawaiian residents.
0.7% Other with 3,257 Other residents.
5.9% Two Or More with 25,883 Two Or More residents.
28.9% Hispanic with 126,517 Hispanic residents.
| Race | Oakland | CA | USA |
|---|---|---|---|
| White | 27.9% | 34.6% | 58.2% |
| African American | 20.5% | 5.3% | 12.0% |
| American Indian | 0.3% | 0.3% | 0.5% |
| Asian | 15.3% | 15.1% | 5.7% |
| Hawaiian | 0.4% | 0.3% | 0.2% |
| Other | 0.7% | 0.5% | 0.5% |
| Two Or More | 5.9% | 4.1% | 3.9% |
| Hispanic | 28.9% | 39.8% | 19.0% |
Gender in Oakland
Oakland is 50.5% female with 221,407 female residents.
Oakland is 49.5% male with 216,665 male residents.
| Gender | Oakland | CA | USA |
|---|---|---|---|
| Female | 50.5% | 50.0% | 50.5% |
| Male | 49.5% | 50.0% | 49.5% |
Highest level of educational attainment in Oakland for adults over 25
9.0% of adults in Oakland completed < 9th grade.
6.0% of adults in Oakland completed 9-12th grade.
16.0% of adults in Oakland completed high school / ged.
15.0% of adults in Oakland completed some college.
5.0% of adults in Oakland completed associate's degree.
27.0% of adults in Oakland completed bachelor's degree.
15.0% of adults in Oakland completed master's degree.
4.0% of adults in Oakland completed professional degree.
3.0% of adults in Oakland completed doctorate degree.
| Education | Oakland | CA | USA |
|---|---|---|---|
| < 9th Grade | 9.0% | 8.0% | 5.0% |
| 9-12th Grade | 6.0% | 7.0% | 6.0% |
| High School / GED | 16.0% | 20.0% | 26.0% |
| Some College | 15.0% | 20.0% | 19.0% |
| Associate's Degree | 5.0% | 8.0% | 9.0% |
| Bachelor's Degree | 27.0% | 22.0% | 21.0% |
| Master's Degree | 15.0% | 10.0% | 10.0% |
| Professional Degree | 4.0% | 3.0% | 2.0% |
| Doctorate Degree | 3.0% | 2.0% | 2.0% |
Household Income For Oakland, California
5.3% of households in Oakland earn Less than $10,000.
4.5% of households in Oakland earn $10,000 to $14,999.
5.7% of households in Oakland earn $15,000 to $24,999.
5.4% of households in Oakland earn $25,000 to $34,999.
7.8% of households in Oakland earn $35,000 to $49,999.
12.0% of households in Oakland earn $50,000 to $74,999.
10.3% of households in Oakland earn $75,000 to $99,999.
15.7% of households in Oakland earn $100,000 to $149,999.
10.6% of households in Oakland earn $150,000 to $199,999.
22.8% of households in Oakland earn $200,000 or more.
| Income | Oakland | CA | USA |
|---|---|---|---|
| Less than $10,000 | 5.3% | 4.4% | 4.9% |
| $10,000 to $14,999 | 4.5% | 3.0% | 3.6% |
| $15,000 to $24,999 | 5.7% | 5.2% | 6.6% |
| $25,000 to $34,999 | 5.4% | 5.5% | 6.8% |
| $35,000 to $49,999 | 7.8% | 8.4% | 10.4% |
| $50,000 to $74,999 | 12.0% | 13.3% | 15.7% |
| $75,000 to $99,999 | 10.3% | 11.8% | 12.7% |
| $100,000 to $149,999 | 15.7% | 17.9% | 17.4% |
| $150,000 to $199,999 | 10.6% | 11.1% | 9.3% |
| $200,000 or more | 22.8% | 19.4% | 12.6% |


