Compare Portland to…
Portland SnackAbility
Overall SnackAbility
Crime in Portland summary. We use data from the FBI to determine the crime rates in Portland. Key points include:
There were 38,919 total crimes in Portland in the last reporting year.
The overall crime rate per 100,000 people in Portland is 6,246.4 / 100k people.
The violent crime rate per 100,000 people in Portland is 720.1 / 100k people.
The property crime rate per 100,000 people in Portland is 5,526.2 / 100k people.
Overall, crime in Portland is 194.75% above the national average.
Total Crimes
Above National Average
Crime In Portland Comparison Table
| Statistic | Count Raw |
Portland / 100k People |
Oregon / 100k People |
National / 100k People |
|---|---|---|---|---|
| Total Crimes Per 100K | 38,919 | 6,246.4 | 2,719.1 | 2,119.2 |
| Violent Crime | 4,487 | 720.1 | 331.0 | 359.0 |
| Murder | 67 | 10.8 | 3.7 | 5.0 |
| Robbery | 1,105 | 177.3 | 57.0 | 61.0 |
| Aggravated Assault | 2,998 | 481.2 | 229.1 | 256.0 |
| Property Crime | 34,432 | 5,526.2 | 2,388.0 | 1,760.0 |
| Burglary | 4,532 | 727.4 | 306.5 | 229.0 |
| Larceny | 24,432 | 3,921.3 | 1,789.5 | 1,272.0 |
| Car Theft | 5,468 | 877.6 | 292.1 | 259.0 |
Source: FBI Uniform Crime Reporting (2024)
Cost of living in Portland summary. We use data on the cost of living to determine how expensive it is to live in Portland. Real estate prices drive most of the variance in cost of living around Oregon. Key points include:
The cost of living in Portland is 139 with 100 being average.
The cost of living in Portland is 1.4x higher than the national average.
The median home value in Portland is $534,638.
The median income in Portland is $90,919.
Portland's Overall Cost Of Living
Higher Than The National Average
Cost Of Living In Portland Comparison Table
| Living Expense | Portland | Oregon | National Average |
|---|---|---|---|
| Overall | 139 | 109 | 100 |
| Services | 105 | 104 | 100 |
| Groceries | 108 | 106 | 100 |
| Health | 210 | 125 | 100 |
| Housing | 111 | 104 | 100 |
| Transportation | 112 | 106 | 100 |
| Utilities | 112 | 105 | 100 |
Source: Cost of living index, normalized to US average = 100
Portland, OR Weather
The average high in Portland is 62.7° and the average low is 43.7°.
There are 99.7 days of precipitation each year.
Expect an average of 43.7 inches of precipitation each year with 3.1 inches of snow.
| Stat | Portland |
|---|---|
| Average Annual High | 62.7 |
| Average Annual Low | 43.7 |
| Annual Precipitation Days | 99.7 |
| Average Annual Precipitation | 43.7 |
| Average Annual Snowfall | 3.1 |
Average High
Days of Rain
Source: NOAA climate normals (30-year)
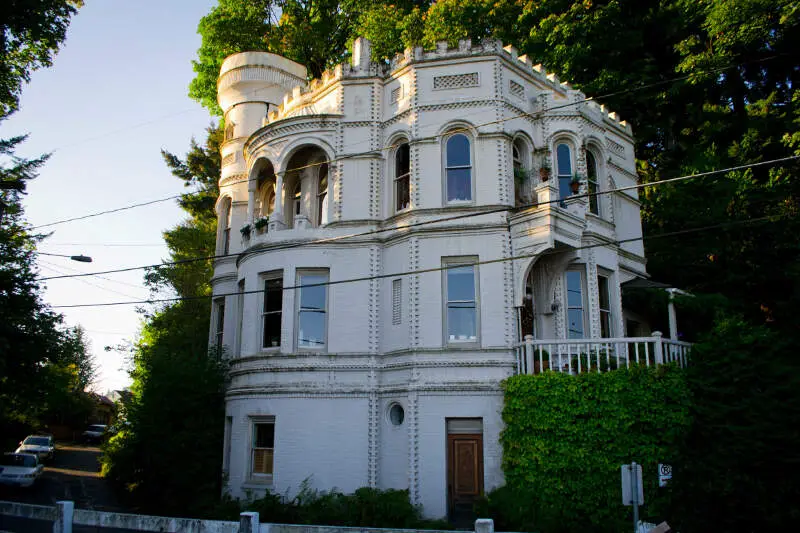
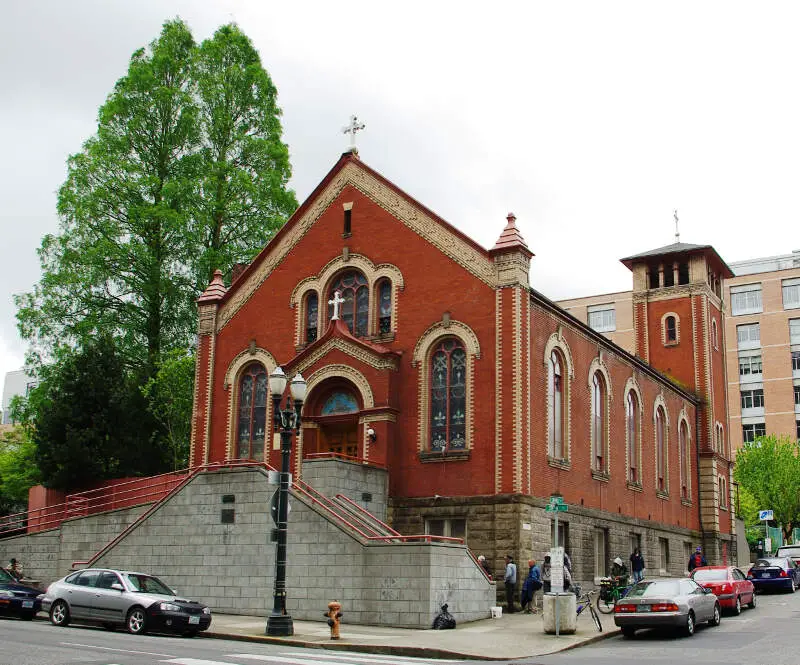
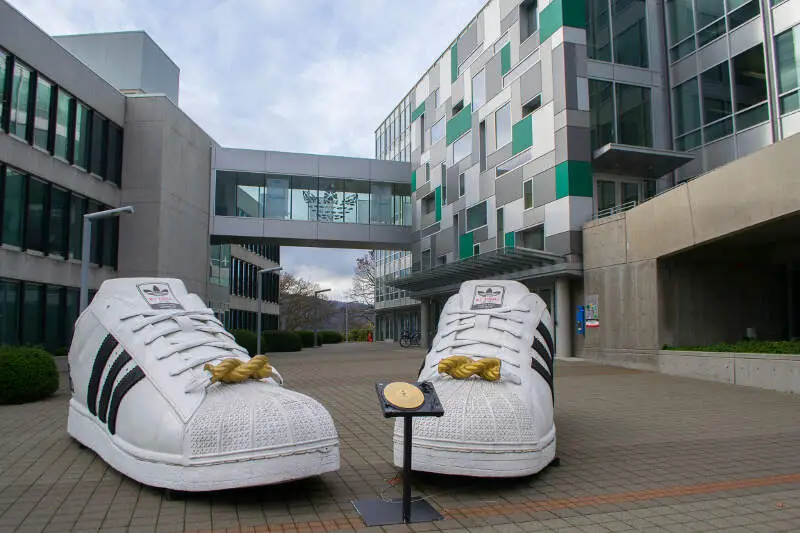
Portland, OR Photos


4 Reviews & Comments About Portland

I think Portland is the absolute F*****G worst place to live. The west side of Oregon is mostly just terrible.
Sure there are places like Coos Bay and Newport which are nice but I hate that side of the state. I've lived in Baker City on the East side of the state for 18 years and it's probably the nicest place you could live in Oregon. Portland however is so awful I actively avoid it if I have to go to say, Seattle. I'd gladly add an extra hour or two to my journey to avoid that vile city. The majority of people are Bums and Hipsters. And the drivers are rude as f**k and traffic is always atrocious. I'll never go back as long as I live. Rant over.
Every time I visit Portland I am reminded of how much I love it. The atmosphere ia always vibrant and the people are so nice! There are so many things to do that you will never be bored.
Breweries on every corner. I love to go from brewery to brewery and taste all the different beers. Portland is the epitomy of melting pot. There are so many diverse groups and fron that comes a large market of ethnic foods. You can find any ethnic food you can think of.
Real slow on homeless problem,drugs,murder,on biking trail,assults,r**e,little patrol awful.
Omsi is awesome,bad neighborhood but awesome exibits,down town is new buildings but crime is awful,beggars NO WALKING PATROL POLICE gov.is slow to act on riots and never calls National Guard!!! Looting,burning during supposed rally or protests.awful mayor n horrible governor.
I have lived in Portland for 15 years, but am from eastern Oregon. Having experience living in both rural and metropolitan areas, I can tell you that there are a lot of things that I miss about eastern Oregon, not the least of which is the wonderful, down-to-earth, people that live there. Most live there by choice to get away from the rat race in metro living. You can breathe fresh air, drive without the jerk behind you tailgating and cussing you out, enjoy the beautiful expanse of wilderness, and you can actually see the stars at nighttime... hmmmm, sounds to me like eastern Oregon is a terrible place to live ;) Don't ever move there! LOL
Rankings & Articles For Portland


Locations Around Portland
Map Of Portland, OR
Best Places Around Portland
Oregon, WI
Population 11,547
Washougal, WA
Population 17,490
Battle Ground, WA
Population 21,886
Hazel Dell, WA
Population 23,237
Vancouver, WA
Population 195,300
Camas, WA
Population 27,007
Mount Vista, WA
Population 10,764
Five Corners, WA
Population 21,194
Lake Oswego, OR
Population 40,381
Portland Demographics And Statistics
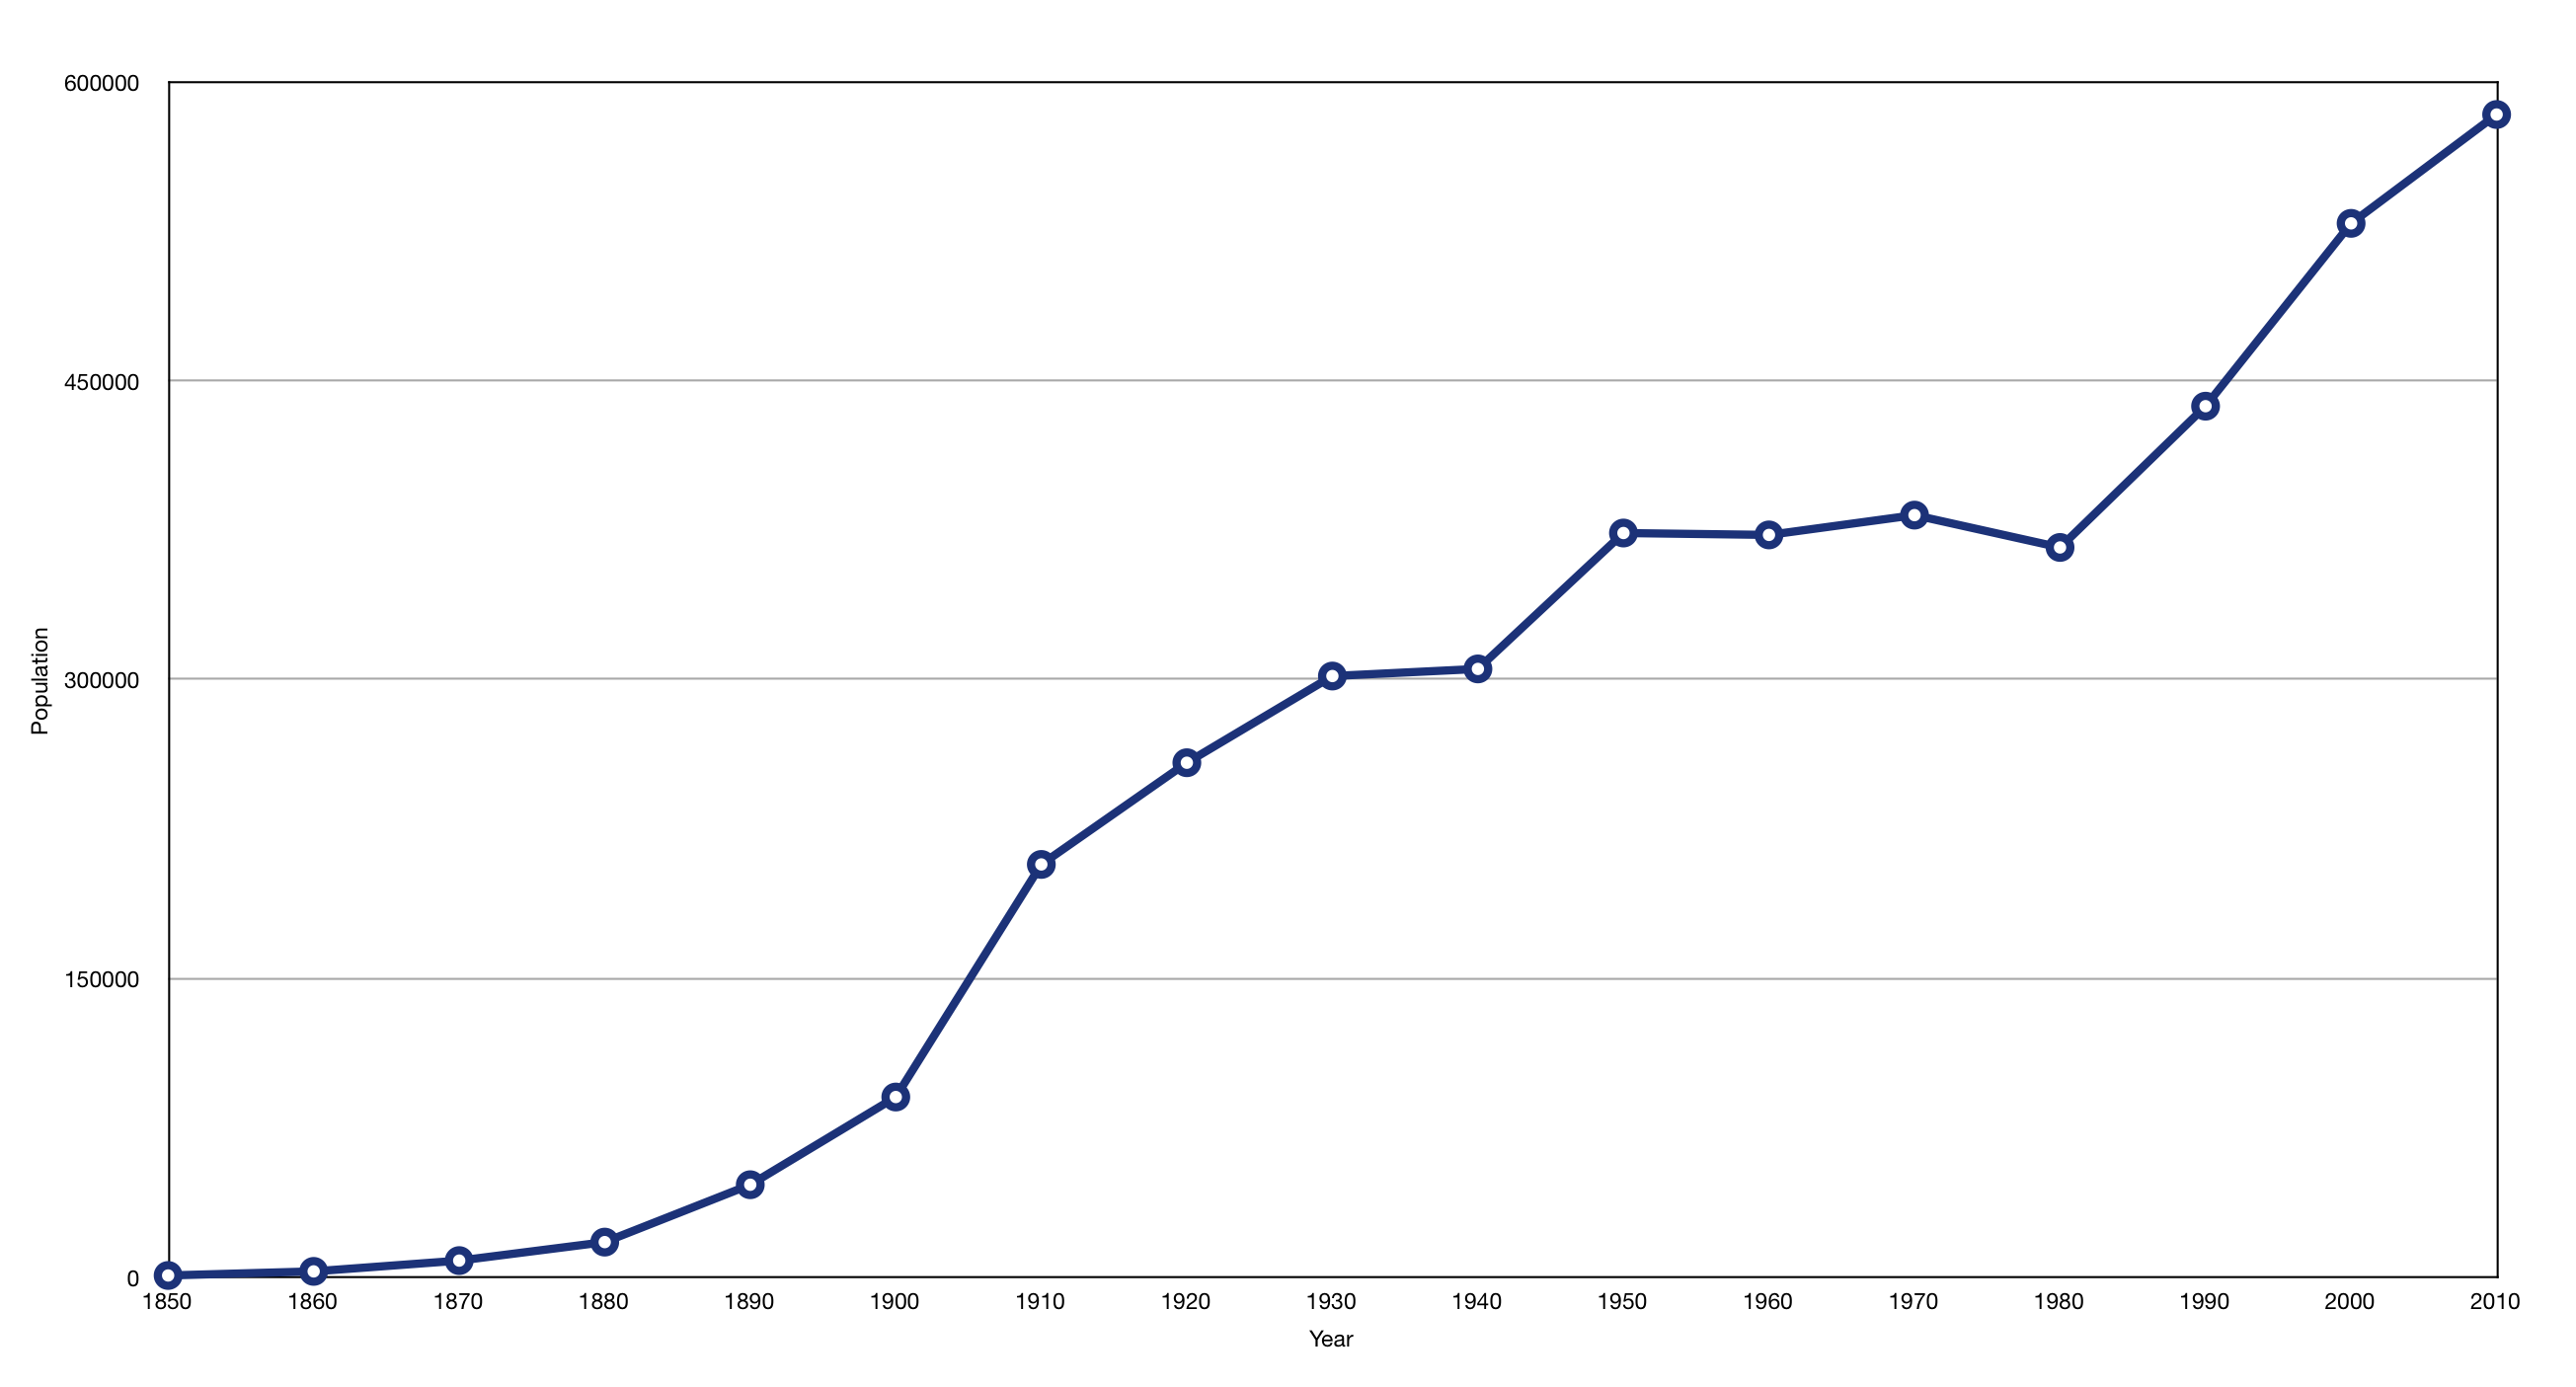
Population over time in Portland
The current population in Portland is 641,165. The population has increased 13.1% from 2010.
| Year | Population | % Change |
|---|---|---|
| 2024 | 641,165 | -0.2% |
| 2023 | 642,715 | -0.5% |
| 2022 | 646,101 | -0.2% |
| 2021 | 647,176 | -0.5% |
| 2020 | 650,380 | 0.8% |
| 2019 | 645,291 | 0.9% |
| 2018 | 639,387 | 1.4% |
| 2017 | 630,331 | 1.6% |
| 2016 | 620,589 | 1.4% |
| 2015 | 612,206 | 1.6% |
| 2014 | 602,568 | 1.3% |
| 2013 | 594,687 | 1.5% |
| 2012 | 585,888 | 1.6% |
| 2011 | 576,543 | 1.7% |
| 2010 | 566,686 | - |
Race / Ethnicity in Portland
See the full breakdown
Portland is:
65.8% White with 421,689 White residents.
5.5% African American with 35,307 African American residents.
0.4% American Indian with 2,422 American Indian residents.
8.0% Asian with 51,090 Asian residents.
0.6% Hawaiian with 3,726 Hawaiian residents.
0.6% Other with 3,751 Other residents.
7.2% Two Or More with 46,419 Two Or More residents.
12.0% Hispanic with 76,761 Hispanic residents.
| Race | Portland | OR | USA |
|---|---|---|---|
| White | 65.8% | 71.4% | 57.4% |
| African American | 5.5% | 1.8% | 11.9% |
| American Indian | 0.4% | 0.6% | 0.5% |
| Asian | 8.0% | 4.4% | 5.9% |
| Hawaiian | 0.6% | 0.4% | 0.2% |
| Other | 0.6% | 0.6% | 0.6% |
| Two Or More | 7.2% | 6.1% | 4.3% |
| Hispanic | 12.0% | 14.7% | 19.3% |
Gender in Portland
See the full breakdown
Portland is 50.3% female with 322,392 female residents.
Portland is 49.7% male with 318,773 male residents.
| Gender | Portland | OR | USA |
|---|---|---|---|
| Female | 50.3% | 50.1% | 50.5% |
| Male | 49.7% | 49.9% | 49.5% |
Highest level of educational attainment in Portland for adults over 25
See the full breakdown
2.0% of adults in Portland completed < 9th grade.
4.0% of adults in Portland completed 9-12th grade.
15.0% of adults in Portland completed high school / ged.
18.0% of adults in Portland completed some college.
7.0% of adults in Portland completed associate's degree.
32.0% of adults in Portland completed bachelor's degree.
15.0% of adults in Portland completed master's degree.
4.0% of adults in Portland completed professional degree.
3.0% of adults in Portland completed doctorate degree.
| Education | Portland | OR | USA |
|---|---|---|---|
| < 9th Grade | 2.0% | 3.0% | 4.0% |
| 9-12th Grade | 4.0% | 5.0% | 6.0% |
| High School / GED | 15.0% | 22.0% | 26.0% |
| Some College | 18.0% | 24.0% | 19.0% |
| Associate's Degree | 7.0% | 9.0% | 9.0% |
| Bachelor's Degree | 32.0% | 23.0% | 22.0% |
| Master's Degree | 15.0% | 10.0% | 10.0% |
| Professional Degree | 4.0% | 2.0% | 2.0% |
| Doctorate Degree | 3.0% | 2.0% | 2.0% |
Household Income For Portland, Oregon
See the full breakdown
4.9% of households in Portland earn Less than $10,000.
3.8% of households in Portland earn $10,000 to $14,999.
5.5% of households in Portland earn $15,000 to $24,999.
5.6% of households in Portland earn $25,000 to $34,999.
8.9% of households in Portland earn $35,000 to $49,999.
13.7% of households in Portland earn $50,000 to $74,999.
11.6% of households in Portland earn $75,000 to $99,999.
17.4% of households in Portland earn $100,000 to $149,999.
11.0% of households in Portland earn $150,000 to $199,999.
17.5% of households in Portland earn $200,000 or more.
| Income | Portland | OR | USA |
|---|---|---|---|
| Less than $10,000 | 4.9% | 4.5% | 5.0% |
| $10,000 to $14,999 | 3.8% | 3.2% | 3.4% |
| $15,000 to $24,999 | 5.5% | 6.1% | 6.3% |
| $25,000 to $34,999 | 5.6% | 6.2% | 6.6% |
| $35,000 to $49,999 | 8.9% | 10.0% | 10.1% |
| $50,000 to $74,999 | 13.7% | 15.4% | 15.5% |
| $75,000 to $99,999 | 11.6% | 13.2% | 12.6% |
| $100,000 to $149,999 | 17.4% | 18.5% | 17.5% |
| $150,000 to $199,999 | 11.0% | 10.1% | 9.6% |
| $200,000 or more | 17.5% | 12.7% | 13.4% |
Source: U.S. Census ACS 5-year estimates (2024)


