

Life in Schuylkill County research summary. HomeSnacks has been researching the quality of life in Schuylkill County over the past eight years using Census data, FBI crime data, cost of living data, and other primary sources. Based on the most recently available data, we found the following about life in Schuylkill County:
The population in Schuylkill County is 143,201.
The median home value in Schuylkill County is $130,539.
The median income in Schuylkill County is $63,574.
The median rent in Schuylkill County is $801.
The unemployment rate in Schuylkill County is 5.3%.
The poverty rate in Schuylkill County is 12.3%.
The average high in Schuylkill County is 66.4° and there are 106.5 inches of rainfall annually.
The average high in Schuylkill County is 66.4°.
There are 79.66 nice days each year.
Expect an average of 106.5 inches of rain each year with 13.8 inches of snow.
There is an average of 4:21 hours of sun each day in Schuylkill County.
| Stat | Schuylkill County |
|---|---|
| Mean High | 66.4 |
| Nice Days | 79.66 |
| Rainfall | 106.5 |
| Snowfall | 13.8 |
| Sunny_hours | 4:21 |

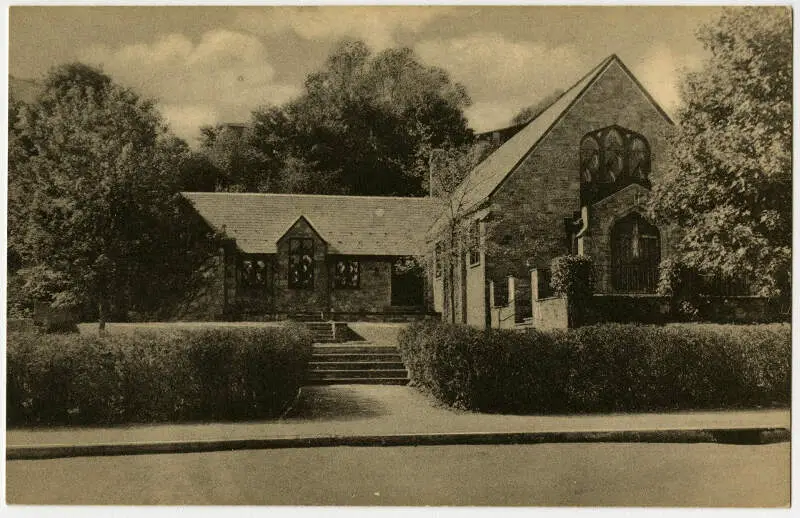
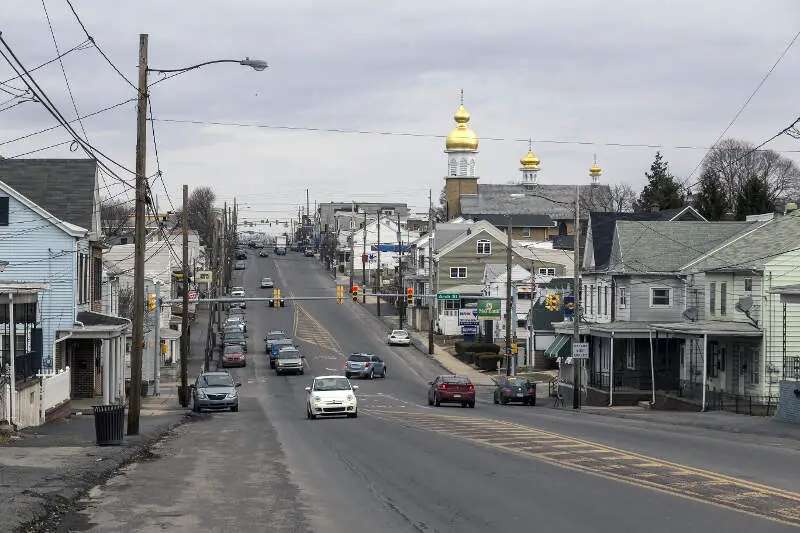
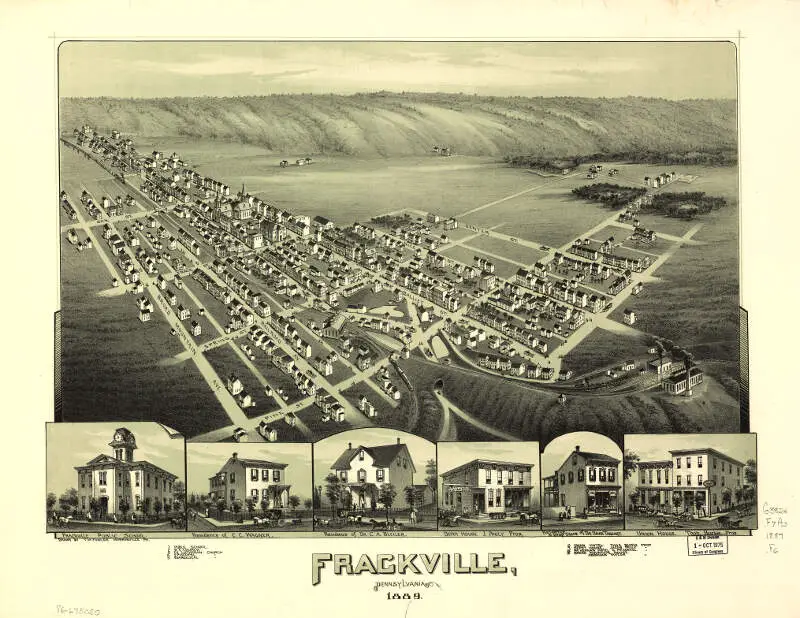
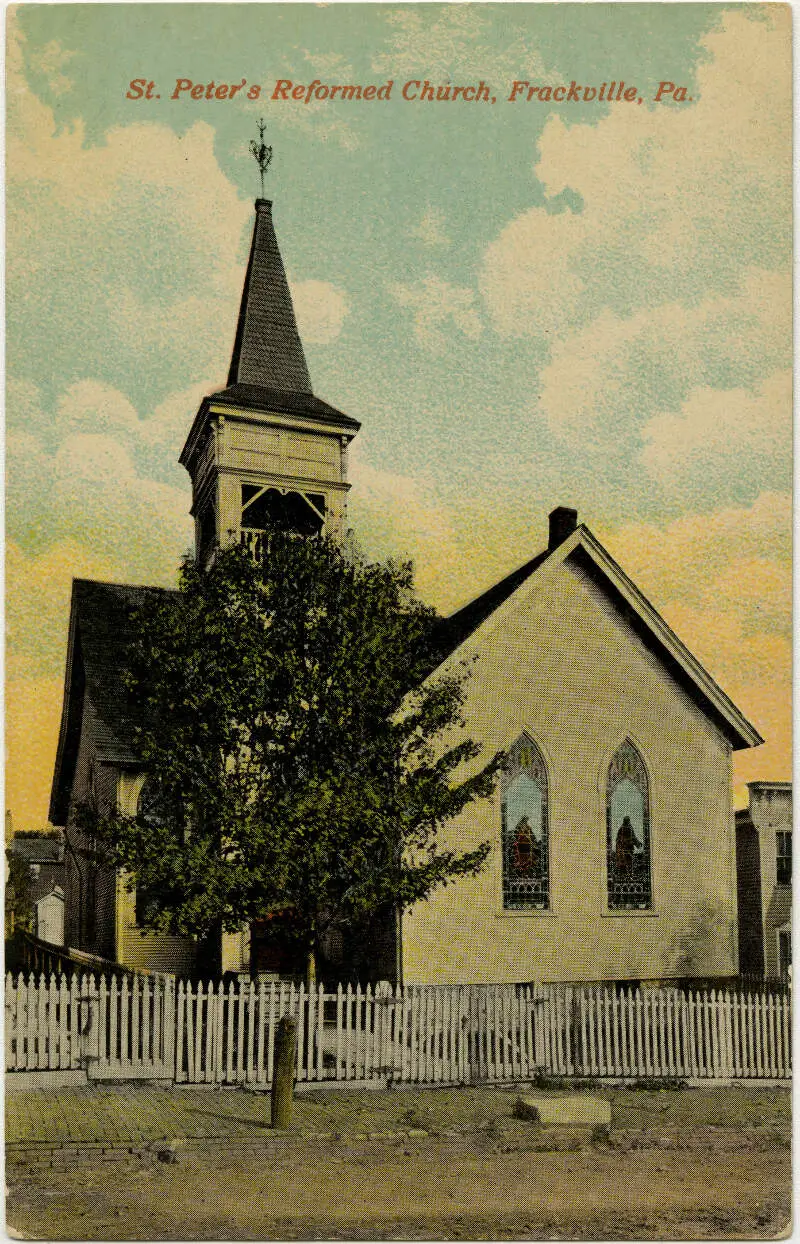
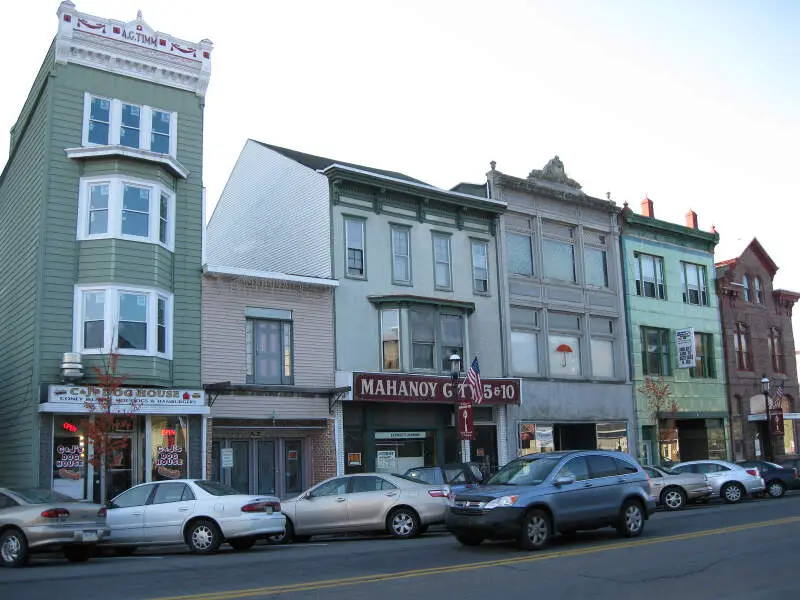
The current population in Schuylkill County is 143,201. The population has increased 0.4% from 2019.
| Year | Population | % Change |
|---|---|---|
| 2022 | 143,308 | 1.0% |
| 2021 | 141,935 | -0.5% |
| 2020 | 142,674 | - |
Schuylkill County is 48.4% female with 69,286 female residents.
Schuylkill County is 51.6% male with 73,915 male residents.
| Gender | Schuylkill County | PA | USA |
|---|---|---|---|
| Female | 48.4% | 50.6% | 50.4% |
| Male | 51.6% | 49.4% | 49.6% |
Schuylkill County is:
88.6% White with 126,821 White residents.
2.6% African American with 3,785 African American residents.
0.0% American Indian with 31 American Indian residents.
0.4% Asian with 626 Asian residents.
0.0% Hawaiian with 13 Hawaiian residents.
0.1% Other with 135 Other residents.
2.1% Two Or More with 2,977 Two Or More residents.
6.2% Hispanic with 8,813 Hispanic residents.
| Race | Schuylkill County | PA | USA |
|---|---|---|---|
| White | 88.6% | 74.5% | 58.9% |
| African American | 2.6% | 10.4% | 12.1% |
| American Indian | 0.0% | 0.1% | 0.6% |
| Asian | 0.4% | 3.6% | 5.7% |
| Hawaiian | 0.0% | 0.0% | 0.2% |
| Other | 0.1% | 0.4% | 0.4% |
| Two Or More | 2.1% | 3.0% | 3.5% |
| Hispanic | 6.2% | 8.1% | 18.7% |
4.3% of households in Schuylkill County earn Less than $10,000.
4.6% of households in Schuylkill County earn $10,000 to $14,999.
9.8% of households in Schuylkill County earn $15,000 to $24,999.
8.3% of households in Schuylkill County earn $25,000 to $34,999.
13.0% of households in Schuylkill County earn $35,000 to $49,999.
19.0% of households in Schuylkill County earn $50,000 to $74,999.
13.7% of households in Schuylkill County earn $75,000 to $99,999.
16.6% of households in Schuylkill County earn $100,000 to $149,999.
6.6% of households in Schuylkill County earn $150,000 to $199,999.
4.2% of households in Schuylkill County earn $200,000 or more.
| Income | Schuylkill County | PA | USA |
|---|---|---|---|
| Less than $10,000 | 4.3% | 4.8% | 4.9% |
| $10,000 to $14,999 | 4.6% | 3.9% | 3.8% |
| $15,000 to $24,999 | 9.8% | 7.4% | 7.0% |
| $25,000 to $34,999 | 8.3% | 7.6% | 7.4% |
| $35,000 to $49,999 | 13.0% | 11.0% | 10.7% |
| $50,000 to $74,999 | 19.0% | 16.3% | 16.1% |
| $75,000 to $99,999 | 13.7% | 13.0% | 12.8% |
| $100,000 to $149,999 | 16.6% | 17.2% | 17.1% |
| $150,000 to $199,999 | 6.6% | 8.5% | 8.8% |
| $200,000 or more | 4.2% | 10.2% | 11.4% |
3.0% of adults in Schuylkill County completed < 9th grade.
8.0% of adults in Schuylkill County completed 9-12th grade.
45.0% of adults in Schuylkill County completed high school / ged.
15.0% of adults in Schuylkill County completed some college.
11.0% of adults in Schuylkill County completed associate's degree.
12.0% of adults in Schuylkill County completed bachelor's degree.
5.0% of adults in Schuylkill County completed master's degree.
1.0% of adults in Schuylkill County completed professional degree.
0.0% of adults in Schuylkill County completed doctorate degree.
| Education | Schuylkill County | PA | USA |
|---|---|---|---|
| < 9th Grade | 3% | 2% | 3% |
| 9-12th Grade | 8% | 5% | 6% |
| High School / GED | 45% | 34% | 26% |
| Some College | 15% | 16% | 20% |
| Associate's Degree | 11% | 9% | 9% |
| Bachelor's Degree | 12% | 20% | 21% |
| Master's Degree | 5% | 10% | 10% |
| Professional Degree | 1% | 2% | 2% |
| Doctorate Degree | 0% | 2% | 2% |
HomeSnacks is based in Durham, NC.
We aim to deliver bite-sized pieces of infotainment about where you live.
We use data, analytics, and a sense of humor to determine quality of life for places across the nation.