You won’t find Dollar General and McDonald’s dotting the landscape in Pennsylvania’s most expensive places. It’s only the best of the best for the playgrounds of Pennsylvania’s rich and famous. Many of Pennsylvania’s most expensive places are some of the state’s best.
How did we calculate the list of the most expensive places in Pennsylvania? We used Saturday Night Science to compare the cost of living index for the 182 Pennsylvania places over 5,000 people. The area around Philadelphia is home to Pennsylvania’s most expensive places.
It’s going to take more than a million Hershey Kisses to keep up with the Joneses in this Mid-Atlantic state: it’s going to take at least 45,424/year.
$243,625 median income · $1,000,519 median home · #1 home prices in Pennsylvania
Fox Chapel is a borough in Allegheny County, Pennsylvania, USA, and is a suburb of Pittsburgh located 6 miles northeast of downtown.
Data | Crime | Cost of living | Movers
$176,875 median income · $539,476 median home · #8 home prices in Pennsylvania
Franklin Park is a borough in Allegheny County, Pennsylvania, United States. The population was 13,470 at the 2010 census.
Data | Crime | Cost of living | Movers
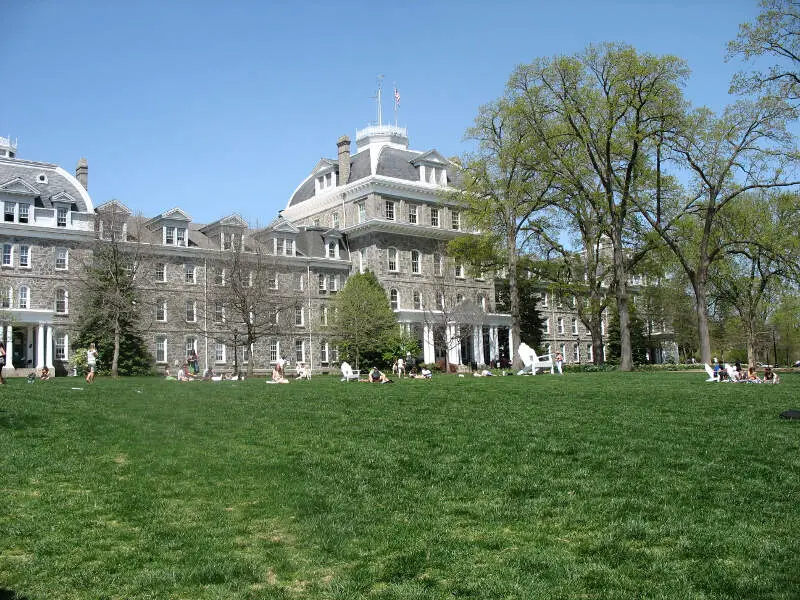
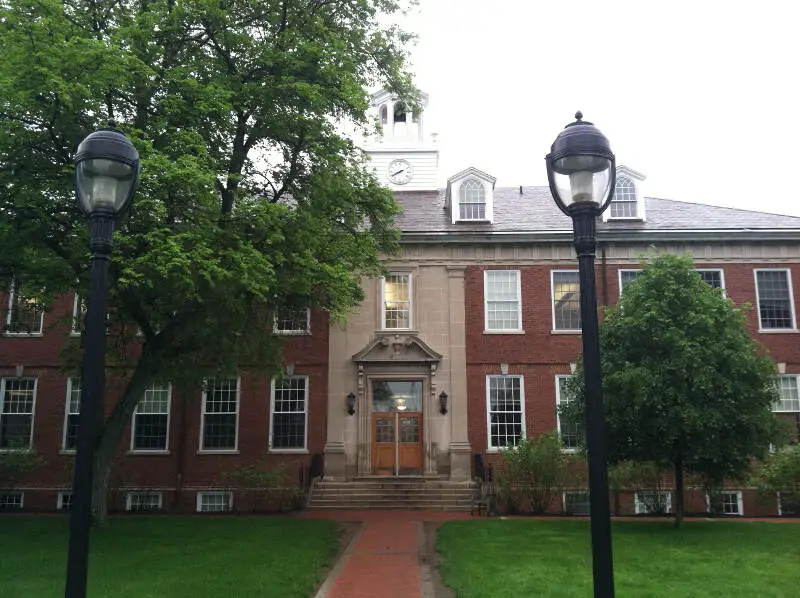
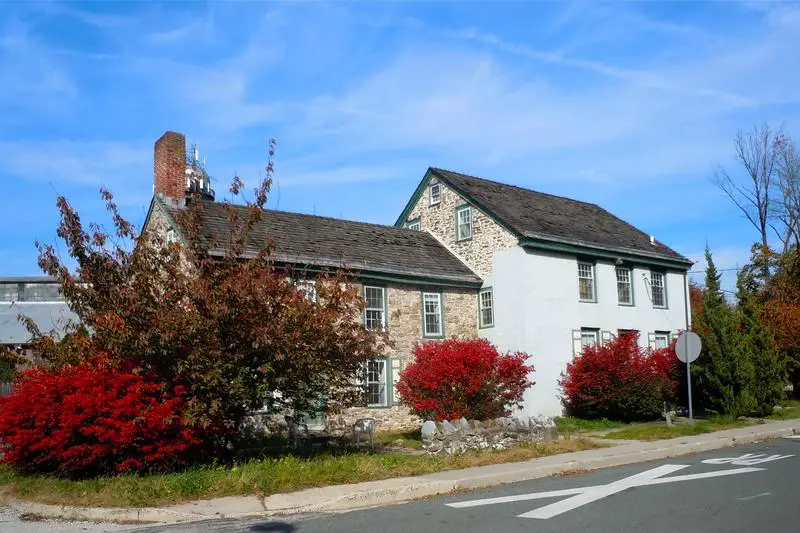
$152,361 median income · $467,860 median home · #13 home prices in Pennsylvania
Swarthmore is a borough in Delaware County, Pennsylvania, United States. Swarthmore was originally named “Westdale” in honor of noted painter Benjamin West, who was one of the early residents of the town. The name was changed to “Swarthmore” after the establishment of Swarthmore College. “Swarthmore” can be pronounced with the first “r” either vocalized or dropped due to differences in rhotic and non-rhotic accents, but locally it is usually pronounced without the first “r”. The borough population was 6,194 as of the 2010 census.
Data | Crime | Cost of living | Movers
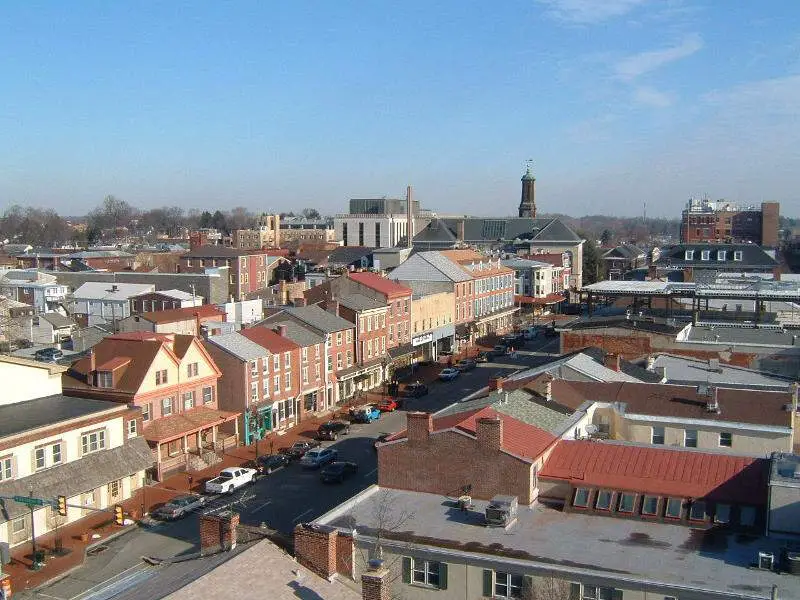
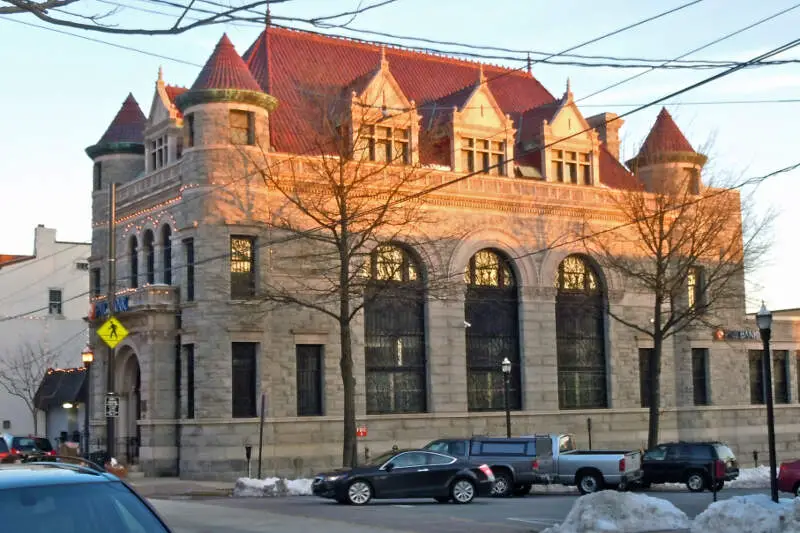
$78,385 median income · $657,113 median home · #3 home prices in Pennsylvania
West Chester is a borough and the county seat of Chester County, Pennsylvania, in the U.S. state of Pennsylvania. The population was 18,461 at the 2010 census.
Data | Crime | Cost of living | Movers
$122,721 median income · $482,552 median home · #12 home prices in Pennsylvania
Data | Crime | Cost of living | Movers
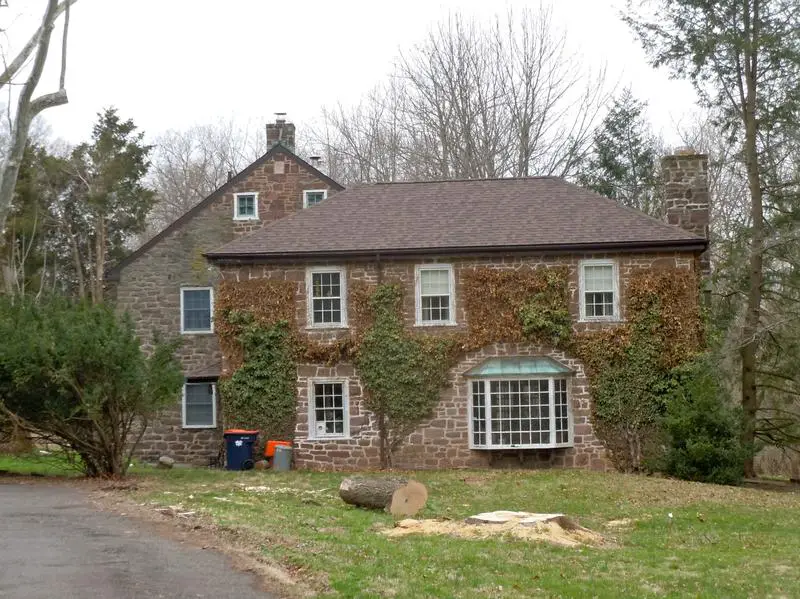
$89,092 median income · $632,298 median home · #4 home prices in Pennsylvania
The borough of Media is the county seat of Delaware County, in the U.S. state of Pennsylvania and is located 13 miles west of Philadelphia. Media was incorporated in 1850 at the same time that it was named the county seat. The population was 5,327 at the 2010 census, down from 5,533 at the 2000 census. Its school district is the Rose Tree Media School District with Penncrest High School and Springton Lake Middle School. In June 2006, it became the first fair trade town in America. Media promotes itself by its motto: “Everybody’s Hometown”.
Data | Crime | Cost of living | Movers
$91,466 median income · $568,662 median home · #6 home prices in Pennsylvania
Collegeville, sometimes referred to as “Little Philly” is a borough in Montgomery County, Pennsylvania, a suburb of Philadelphia on the Perkiomen Creek. Collegeville was incorporated in 1896. It is the location of Ursinus College, opened in 1869. The population was 5,089 at the 2010 census.
Data | Crime | Cost of living | Movers
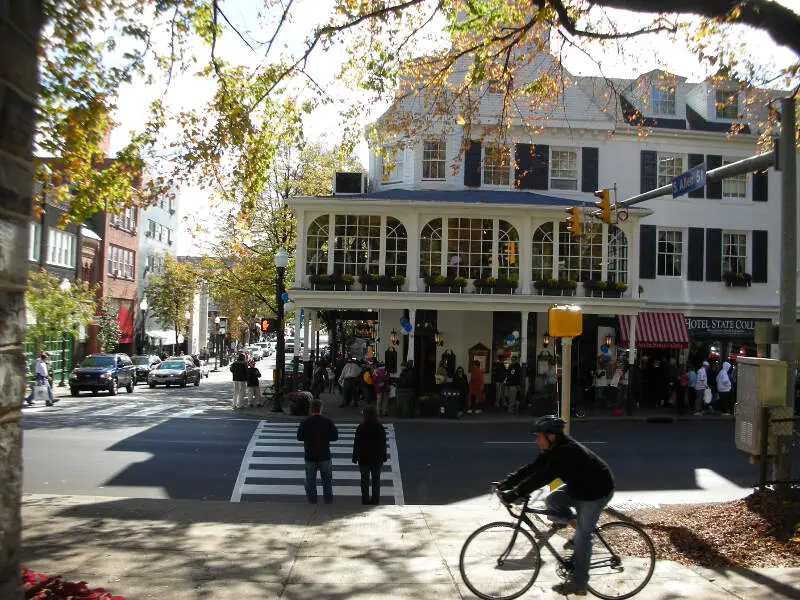
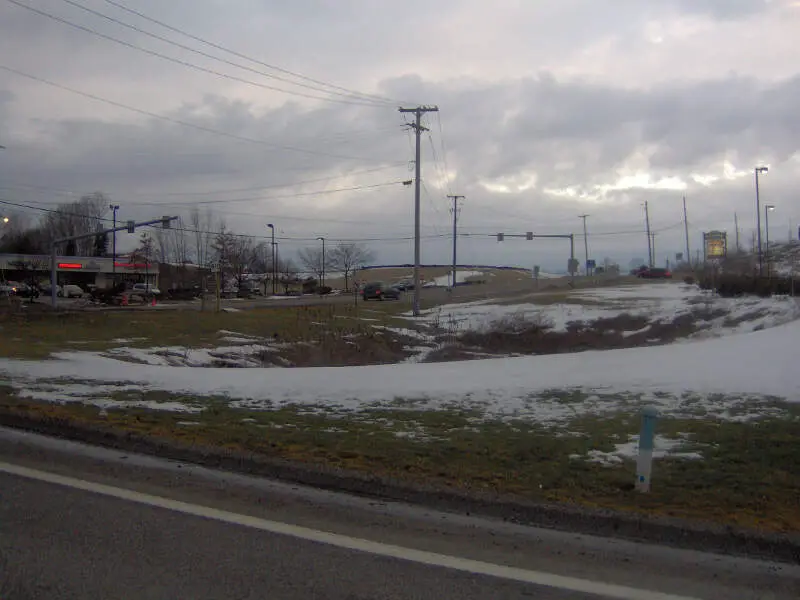
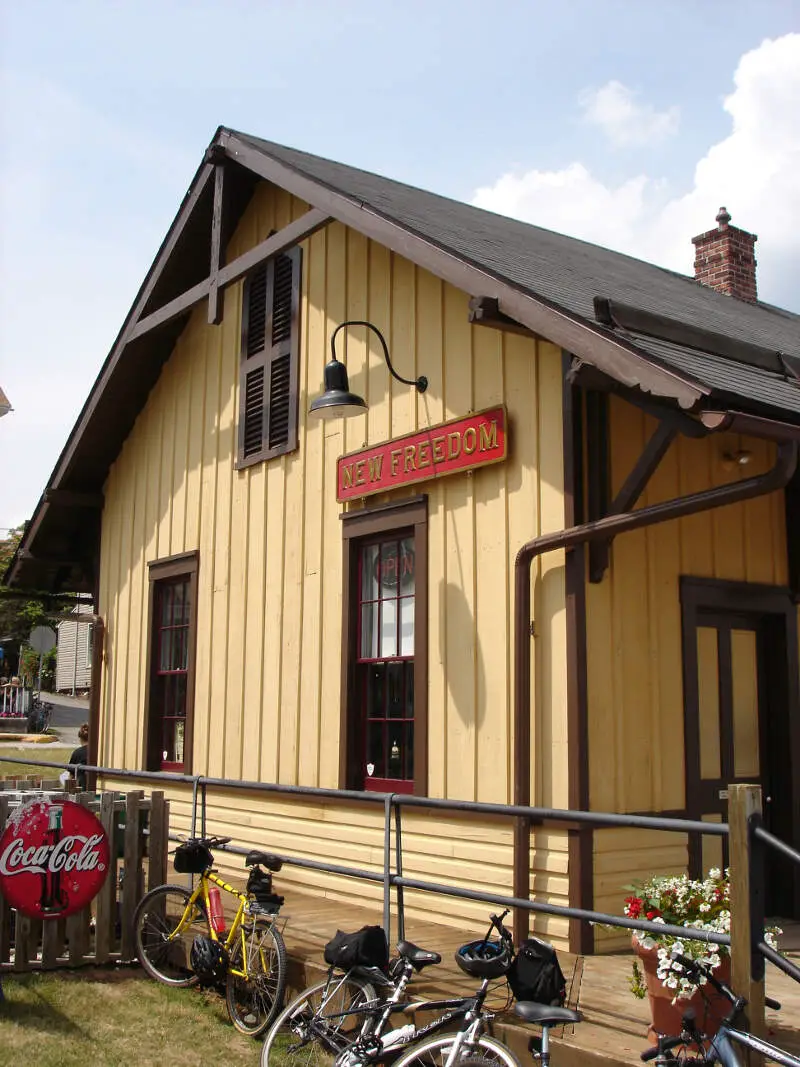
$45,424 median income · $408,500 median home · #20 home prices in Pennsylvania
State College is a home rule municipality in Centre County in the Commonwealth of Pennsylvania. It is the largest designated borough in Pennsylvania. It is the principal borough of the six municipalities that make up the State College Metropolitan Statistical Area, the largest settlement in Centre County and one of the principal cities of the greater State College-DuBois Combined Statistical Area with a combined population of 236,577 as of the 2010 United States Census. In the 2010 census, the borough population was 42,034 with approximately 105,000 living in the borough plus the surrounding townships often referred to locally as the “Centre Region.” Many of these Centre Region communities also carry a “State College, PA” address although are not part of the borough of State College.
Data | Crime | Cost of living | Movers
$120,037 median income · $417,281 median home · #19 home prices in Pennsylvania
Data | Crime | Cost of living | Movers
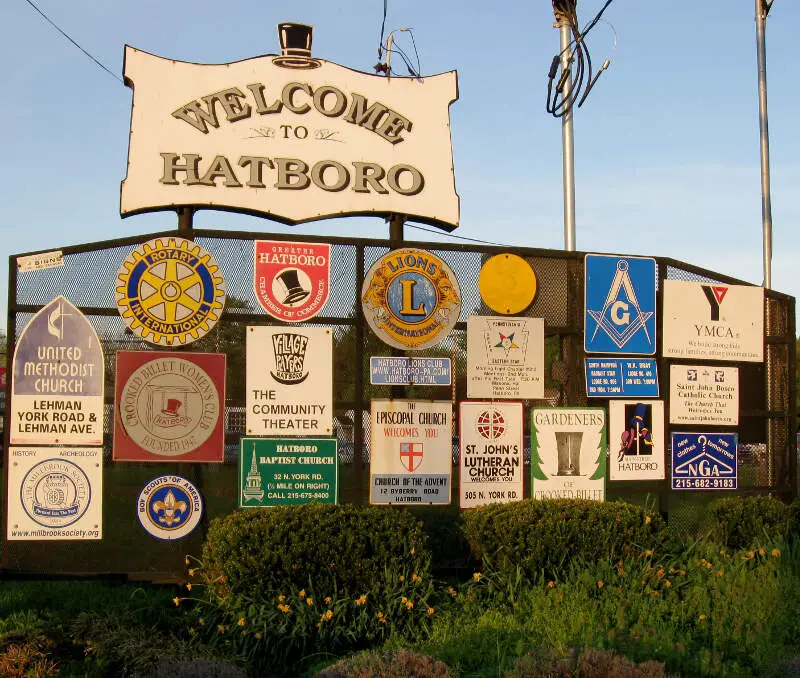
$112,565 median income · $440,910 median home · #18 home prices in Pennsylvania
Hatboro is a borough in Montgomery County, Pennsylvania, United States. The population was 7,360 at the 2010 census.
Data | Crime | Cost of living | Movers
The receipts
Compare the top ten
Pick a metric. The bars rescale. The red line is Pennsylvania’s statewide median.
Pennsylvania statewide median: $282,736
Pennsylvania statewide median: $77,971
On the map
Mapping the most expensive places in Pennsylvania
Saturday Night Science
Methodology: How We Determined The Most Expensive Places To Live In The Keystone State For 2026
The two most important things to think about when it comes to being able to afford a city in Pennsylvania are how much money you make and how much you have to spend to live there.
You need to understand your costs in the context of how much money you make.
For example, if the median household earns $100,000 and spends $40,000 on housing, it’s actually cheaper to live there than a place with a median income of $50,000 and housing costs of $21,000. You might spend more on housing, but you have more money overall to play with.
With that example in mind, we derived several statistics from the latest Census American Community Survey 2020-2024 around incomes and costs. They are:
- Overall Cost Of Living Index
- Median Home Price / Median Income (lower is better)
- Median Income / Median Rent (Higher is better)
- Median Home Price
You can then compare these metrics in each of the places in Pennsylvania to figure out which is the most expensive.
You are left with a “Cost of Living Index” by taking the average rank of each of these metrics for each city.
So we used that cost of living index to rank all of the 182 places in Pennsylvania that have more than 5,000 people.
The place with the highest cost of living in Pennsylvania according to the data is Fox Chapel. We updated this article for 2026. This article is our eleventh time ranking the most expensive places to live in Pennsylvania. The median Pennsylvania home is 60 years old — old enough that it pays to compare home warranty plans before something expensive breaks.
The full plate
Most Expensive Cities In Pennsylvania
Click any column to sort. Search by city name.
| Rank | City | Cost Of Living | Population | Median Income | Average Home Price | Home/Income Ratio |
|---|---|---|---|---|---|---|
| 1 | Fox Chapel | 185 | 5,246 | $243,625 | $1,000,519 | 4.1x |
| 2 | Franklin Park | 133 | 15,235 | $176,875 | $539,476 | 3.1x |
| 3 | Swarthmore | 132 | 6,550 | $152,361 | $467,860 | 3.1x |
| 4 | West Chester | 128 | 20,666 | $78,385 | $657,113 | 8.4x |
| 5 | Conshohocken | 124 | 9,282 | $122,721 | $482,552 | 3.9x |
| 6 | Media | 122 | 5,870 | $89,092 | $632,298 | 7.1x |
| 7 | Collegeville | 121 | 5,247 | $91,466 | $568,662 | 6.2x |
| 8 | State College | 120 | 41,050 | $45,424 | $408,500 | 9.0x |
| 9 | New Freedom | 119 | 5,066 | $120,037 | $417,281 | 3.5x |
| 10 | Hatboro | 117 | 8,283 | $112,565 | $440,910 | 3.9x |
| 11 | Ambler | 116 | 6,847 | $77,394 | $686,428 | 8.9x |
| 12 | Wyomissing | 115 | 11,172 | $93,203 | $377,346 | 4.0x |
| 13 | Morrisville | 113 | 9,752 | $99,526 | $547,936 | 5.5x |
| 14 | Phoenixville | 112 | 19,452 | $102,138 | $521,604 | 5.1x |
| 15 | Perkasie | 111 | 9,216 | $93,845 | $512,871 | 5.5x |
| 16 | Kennett Square | 110 | 6,243 | $80,505 | $620,982 | 7.7x |
| 17 | Lansdale | 109 | 19,011 | $88,229 | $496,720 | 5.6x |
| 18 | Oakmont | 109 | 6,702 | $92,782 | $333,787 | 3.6x |
| 19 | Jefferson Hills | 107 | 12,317 | $116,064 | $350,948 | 3.0x |
| 20 | Souderton | 106 | 7,181 | $93,537 | $462,110 | 4.9x |
| 21 | Emmaus | 105 | 11,889 | $83,917 | $385,740 | 4.6x |
| 22 | Brookhaven | 105 | 8,331 | $91,042 | $265,657 | 2.9x |
| 23 | Camp Hill | 105 | 8,169 | $115,761 | $331,050 | 2.9x |
| 24 | Bridgeport | 105 | 5,174 | $82,705 | $352,990 | 4.3x |
| 25 | Lititz | 104 | 9,619 | $88,576 | $458,674 | 5.2x |
| 26 | Ridley Park | 104 | 7,261 | $93,594 | $309,370 | 3.3x |
| 27 | Oxford | 104 | 5,825 | $67,733 | $465,377 | 6.9x |
| 28 | Philadelphia | 103 | 1,579,706 | $61,953 | $231,815 | 3.7x |
| 29 | Lansdowne | 103 | 11,122 | $73,232 | $277,114 | 3.8x |
| 30 | Gettysburg | 103 | 8,254 | $54,365 | $366,471 | 6.7x |
| 31 | New Holland | 103 | 5,780 | $63,182 | $408,128 | 6.5x |
| 32 | Chambersburg | 102 | 22,319 | $56,576 | $286,441 | 5.1x |
| 33 | Economy | 102 | 9,005 | $95,313 | $278,625 | 2.9x |
| 34 | Prospect Park | 102 | 6,417 | $63,077 | $288,070 | 4.6x |
| 35 | Carlisle | 101 | 21,852 | $61,720 | $329,620 | 5.3x |
| 36 | Northampton | 101 | 10,400 | $90,762 | $345,140 | 3.8x |
| 37 | Bellefonte | 101 | 6,009 | $62,540 | $309,022 | 4.9x |
| 38 | Lewisburg | 101 | 5,257 | $54,767 | $326,711 | 6.0x |
| 39 | Bethlehem | 100 | 77,956 | $68,879 | $351,353 | 5.1x |
| 40 | Bristol | 100 | 9,902 | $76,042 | $339,367 | 4.5x |
| 41 | Millersville | 100 | 8,982 | $67,866 | $353,092 | 5.2x |
| 42 | Pleasant Hills | 100 | 8,399 | $102,167 | $265,880 | 2.6x |
| 43 | Mount Joy | 100 | 8,344 | $90,061 | $296,067 | 3.3x |
| 44 | New Cumberland | 100 | 7,580 | $82,154 | $292,639 | 3.6x |
| 45 | Norwood | 100 | 5,934 | $96,134 | $287,954 | 3.0x |
| 46 | Birdsboro | 100 | 5,116 | $86,290 | $331,845 | 3.8x |
| 47 | Clarks Summit | 100 | 5,073 | $92,083 | $323,510 | 3.5x |
| 48 | Plum | 99 | 26,723 | $98,705 | $252,851 | 2.6x |
| 49 | Waynesboro | 99 | 11,047 | $66,956 | $275,318 | 4.1x |
| 50 | East Stroudsburg | 99 | 9,319 | $59,821 | $309,993 | 5.2x |
| 51 | Glenolden | 99 | 7,220 | $72,786 | $241,350 | 3.3x |
| 52 | Clifton Heights | 99 | 6,832 | $70,931 | $259,887 | 3.7x |
| 53 | Sayre | 99 | 5,431 | $50,801 | $193,071 | 3.8x |
| 54 | Pittsburgh | 98 | 304,759 | $65,742 | $237,533 | 3.6x |
| 55 | Allentown | 98 | 125,976 | $55,494 | $309,699 | 5.6x |
| 56 | Hanover | 98 | 16,584 | $61,293 | $291,772 | 4.8x |
| 57 | Dunmore | 98 | 14,181 | $71,302 | $217,857 | 3.1x |
| 58 | Lower Burrell | 98 | 11,633 | $84,602 | $200,396 | 2.4x |
| 59 | Mechanicsburg | 98 | 9,720 | $84,421 | $401,857 | 4.8x |
| 60 | Wilson | 98 | 8,183 | $82,902 | $234,076 | 2.8x |
| 61 | Nazareth | 98 | 6,043 | $56,855 | $443,943 | 7.8x |
| 62 | Moosic | 98 | 5,973 | $80,187 | $238,010 | 3.0x |
| 63 | Crafton | 98 | 5,961 | $64,006 | $208,119 | 3.3x |
| 64 | Shippensburg | 98 | 5,620 | $51,503 | $197,415 | 3.8x |
| 65 | Shillington | 98 | 5,492 | $79,922 | $260,081 | 3.3x |
| 66 | Manheim | 98 | 5,027 | $81,273 | $273,737 | 3.4x |
| 67 | Whitehall | 97 | 14,811 | $89,404 | $262,406 | 2.9x |
| 68 | Catasauqua | 97 | 6,541 | $85,049 | $284,193 | 3.3x |
| 69 | Sharon Hill | 97 | 6,002 | $75,130 | $192,594 | 2.6x |
| 70 | Selinsgrove | 97 | 5,593 | $65,650 | $239,848 | 3.7x |
| 71 | Bangor | 97 | 5,163 | $70,076 | $324,590 | 4.6x |
| 72 | Baldwin | 96 | 21,057 | $80,983 | $231,521 | 2.9x |
| 73 | Ephrata | 96 | 13,772 | $69,735 | $249,296 | 3.6x |
| 74 | Collingdale | 96 | 8,897 | $51,886 | $201,851 | 3.9x |
| 75 | Bellevue | 96 | 8,128 | $68,827 | $236,965 | 3.4x |
| 76 | Dormont | 96 | 8,063 | $80,526 | $246,408 | 3.1x |
| 77 | Palmyra | 96 | 7,755 | $77,469 | $343,038 | 4.4x |
| 78 | Archbald | 96 | 7,404 | $71,936 | $242,130 | 3.4x |
| 79 | Hollidaysburg | 96 | 5,558 | $69,458 | $243,009 | 3.5x |
| 80 | Edinboro | 96 | 5,440 | $48,173 | $288,726 | 6.0x |
| 81 | Greensburg | 95 | 14,741 | $64,914 | $238,469 | 3.7x |
| 82 | Coatesville | 95 | 13,353 | $59,256 | $384,165 | 6.5x |
| 83 | Old Forge | 95 | 8,573 | $71,812 | $207,907 | 2.9x |
| 84 | Carnegie | 95 | 7,978 | $67,656 | $224,034 | 3.3x |
| 85 | Folcroft | 95 | 6,772 | $61,306 | $214,934 | 3.5x |
| 86 | Blakely | 95 | 6,662 | $55,855 | $220,301 | 3.9x |
| 87 | Forest Hills | 95 | 6,286 | $89,688 | $222,967 | 2.5x |
| 88 | South Williamsport | 95 | 6,211 | $64,583 | $191,786 | 3.0x |
| 89 | Stroudsburg | 95 | 5,894 | $66,674 | $346,453 | 5.2x |
| 90 | Bloomsburg | 94 | 13,024 | $51,536 | $257,067 | 5.0x |
| 91 | Yeadon | 94 | 12,181 | $49,759 | $228,207 | 4.6x |
| 92 | Castle Shannon | 94 | 8,209 | $64,071 | $211,413 | 3.3x |
| 93 | Taylor | 94 | 6,265 | $71,599 | $192,995 | 2.7x |
| 94 | Dickson City | 94 | 6,023 | $59,963 | $213,635 | 3.6x |
| 95 | Exeter | 94 | 5,541 | $57,639 | $225,840 | 3.9x |
| 96 | Olyphant | 94 | 5,381 | $66,423 | $228,298 | 3.4x |
| 97 | Lehighton | 94 | 5,268 | $64,651 | $277,947 | 4.3x |
| 98 | Easton | 93 | 29,739 | $69,348 | $371,500 | 5.4x |
| 99 | Kingston | 93 | 13,397 | $55,347 | $220,513 | 4.0x |
| 100 | Columbia | 93 | 10,278 | $54,437 | $290,830 | 5.3x |
Source: U.S. Census ACS 2020-2024, Zillow research. 182 places with more than 5,000 residents.
Summary
Summary: Taking A Chunk Out Of Your Paycheck In Pennsylvania For 2026
Well, there you have it, the places in Pennsylvania that have the highest cost of living, with Fox Chapel ranking as the most expensive city in the Keystone State.
The most expensive cities in Pennsylvania are Fox Chapel, Franklin Park, Swarthmore, West Chester, Conshohocken, Media, Collegeville, State College, New Freedom, and Hatboro. Not sold on Pennsylvania? Take the two-minute Find Your Place quiz and see which state actually fits you.
Questions and answers
Most Expensive Places In Pennsylvania FAQs
What is the most expensive place to live in Pennsylvania?
Fox Chapel is the most expensive place to live in Pennsylvania for 2026. The median home there runs $1,000,519, and it posts the highest cost of living of the 182 places we scored.
What are the 10 most expensive cities in Pennsylvania?
The ten most expensive cities in Pennsylvania are Fox Chapel, Franklin Park, Swarthmore, West Chester, Conshohocken, Media, Collegeville, State College, New Freedom, and Hatboro. We ranked all 182 places with more than 5,000 residents on home prices, incomes, and an overall cost of living index.
How expensive are homes in Fox Chapel?
The median home value in Fox Chapel is $1,000,519, versus $282,736 across Pennsylvania as a whole. Across the ten most expensive cities, the median home runs $511,014.
What salary do you need to live in the most expensive parts of Pennsylvania?
The median household income in the ten most expensive Pennsylvania cities starts at $45,424, and in Fox Chapel it is $243,625. If your paycheck is closer to the statewide median of $77,971, these places will squeeze your budget.
What is the cheapest place to live in Pennsylvania?
Johnstown is the cheapest of the 182 Pennsylvania places we ranked on cost of living. It sits at the very bottom of the same index that put Fox Chapel on top.


