
You’re probably never going to make enough money to live in the richest counties in Kansas.
The median household income in Johnson County, the richest county in Kansas is $109,208, significantly higher than the US median of $74,580, which means based purely on math most people never make enough to live there.
And that’s okay because it’s still fun to look at the people living in the lap of luxury.
So we used Saturday Night Science and the most recent Census to rank home prices and incomes for all 105 counties in the Sunflower State. Let’s star gaze together.
Table Of Contents: Top Ten | Methodology | Table | Summary
The 10 Richest Counties In Kansas For 2026
What is the richest county in Kansas? The richest county in Kansas is Johnson County. In contrast, the poorest county in state is Edwards County, according to the Census data.
Now you know exactly where to move in Kansas. Keep on reading for more about the top ten and a detailed methodology.
Or, check out the best places to live in Kansas and the cheapest places to live in Kansas.
The Richest Counties In Kansas For 2026
1. Johnson County
Biggest Place: Overland Park
Population: 620,631
Median Income: $109,208 (highest)
Median Home Price: $459,391 (highest)
More on Johnson County: Data
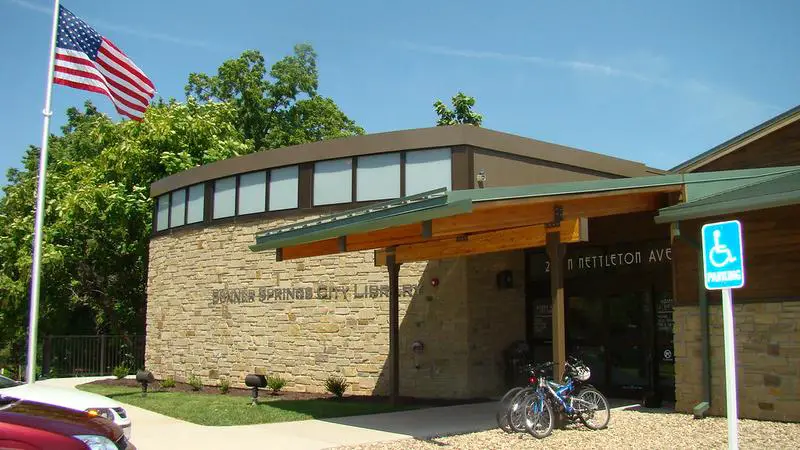
2. Leavenworth County
Biggest Place: Leavenworth
Population: 83,123
Median Income: $89,218 (3rd highest)
Median Home Price: $344,041 (3rd highest)
More on Leavenworth County: Data
3. Pottawatomie County
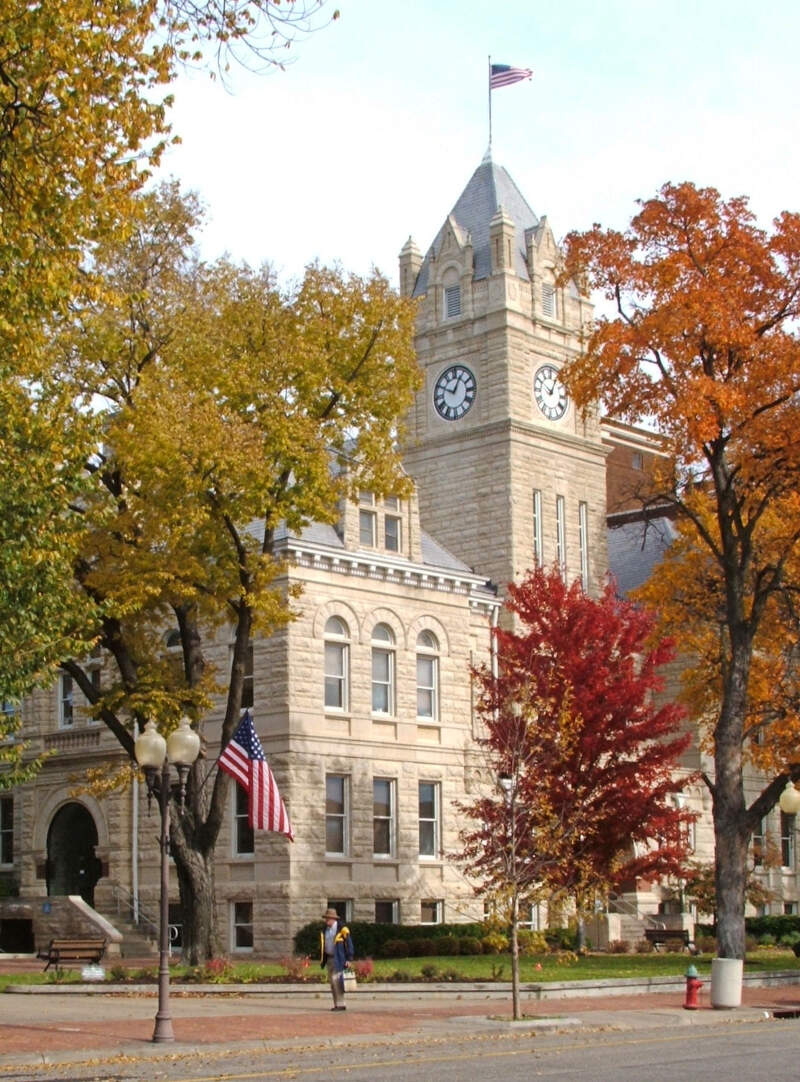
Biggest Place: Manhattan
Population: 26,204
Median Income: $92,325 (2nd highest)
Median Home Price: $324,482 (5th highest)
More on Pottawatomie County: Data
4. Miami County
Biggest Place: Spring Hill
Population: 34,938
Median Income: $89,000 (5th highest)
Median Home Price: $371,974 (2nd highest)
More on Miami County: Data
5. Jefferson County
Biggest Place: Valley Falls
Population: 18,349
Median Income: $81,278 (8th highest)
Median Home Price: $281,948 (6th highest)
More on Jefferson County: Data
6. Butler County
Biggest Place: Andover
Population: 68,287
Median Income: $81,610 (6th highest)
Median Home Price: $244,142 (11th highest)
More on Butler County: Data
7. Gray County
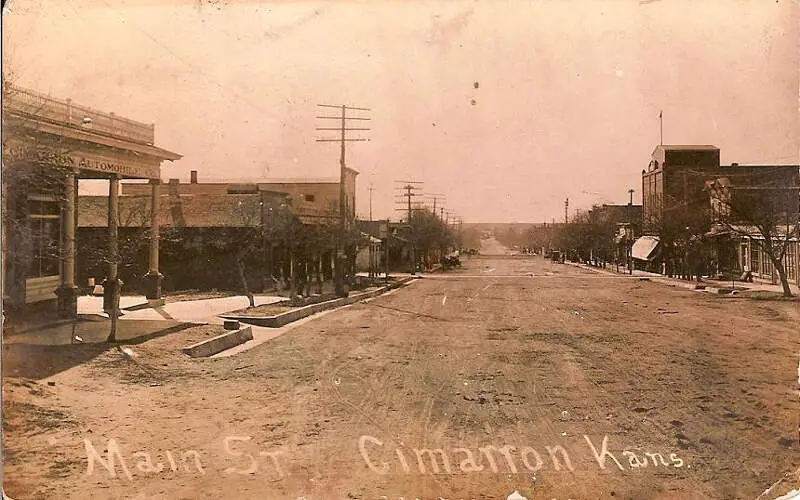
Biggest Place: Cimarron
Population: 5,701
Median Income: $79,122 (10th highest)
Median Home Price: $242,078 (12th highest)
More on Gray County: Data
8. Wabaunsee County
Biggest Place: Wamego
Population: 7,009
Median Income: $76,908 (15th highest)
Median Home Price: $258,358 (8th highest)
More on Wabaunsee County: Data
9. Franklin County
Biggest Place: Ottawa
Population: 26,106
Median Income: $77,207 (14th highest)
Median Home Price: $257,409 (9th highest)
More on Franklin County: Data
10. Nemaha County
Biggest Place: Sabetha
Population: 10,160
Median Income: $77,348 (13th highest)
Median Home Price: $241,965 (13th highest)
More on Nemaha County: Data
Methodology: How do you determine which Kansas county is the richest?
To determine the richest county in Kansas, we have to look at a handful of metrics that correlate with how rich people are. To do that, we made assumptions about what makes a county rich. For reference, we are trying to make the kind of argument you’d make at a bar using facts, Saturday Night Science.
With that in mind, we went to the American Community Survey data and Zillow for the most recent reporting period for data on the following:
- Average Home Price
- Median Income
We then ranked each county in Kansas for each of the criteria from one to 105, with one being the richest.
Taking the average rank across the two criteria, we created a Rich Score with the county posting the lowest overall score being the “Richest County In Kansas.”
The result is some of the places with the most expensive real estate and highest earners in the Sunflower State.
We updated this article for 2026. This report is our first time ranking the richest counties to live in Kansas. We have also ranked the richest states and richest cities in the United States.
Summary: The Richest Counties In Kansas For 2026
Living in Kansas can vary from one part of the state to the next, with pretty extreme variance in home prices and incomes across counties.
The richest counties in Kansas are Johnson County, Leavenworth County, Pottawatomie County, Miami County, Jefferson County, Butler County, Gray County, Wabaunsee County, Franklin County, and Nemaha County.
Now you know the parts of the state where Goodwill will have the best goodies, and that’s what you came here to learn at the end of the day.
You are welcome.
Here’s a look at the poorest counties in Kansas according to the data:
- Edwards County
- Harper County
- Comanche County
For more Kansas reading, check out:
- Cheapest Places To Live In Kansas
- Best Counties To Live In Kansas
- Richest Cities In Kansas
- Safest Places In Kansas
Detailed List Of The Richest Counties In Kansas
| Rank | County | Population | Median Income | Average Home Price |
|---|---|---|---|---|
| 1 | Johnson County | 620,631 | $109,208 | $459,391 |
| 2 | Leavenworth County | 83,123 | $89,218 | $344,041 |
| 3 | Pottawatomie County | 26,204 | $92,325 | $324,482 |
| 4 | Miami County | 34,938 | $89,000 | $371,974 |
| 5 | Jefferson County | 18,349 | $81,278 | $281,948 |
| 6 | Butler County | 68,287 | $81,610 | $244,142 |
| 7 | Gray County | 5,701 | $79,122 | $242,078 |
| 8 | Wabaunsee County | 7,009 | $76,908 | $258,358 |
| 9 | Franklin County | 26,106 | $77,207 | $257,409 |
| 10 | Nemaha County | 10,160 | $77,348 | $241,965 |
| 11 | Jackson County | 13,341 | $75,215 | $250,556 |
| 12 | Kearny County | 3,864 | $89,135 | $192,117 |
| 13 | Mcpherson County | 30,205 | $78,851 | $222,474 |
| 14 | Douglas County | 120,302 | $69,746 | $333,701 |
| 15 | Sheridan County | 2,426 | $73,750 | $234,560 |
| 16 | Osage County | 15,744 | $74,467 | $207,645 |
| 17 | Finney County | 38,084 | $73,009 | $234,021 |
| 18 | Harvey County | 33,756 | $74,368 | $188,877 |
| 19 | Ford County | 34,074 | $70,781 | $209,375 |
| 20 | Sedgwick County | 528,226 | $69,365 | $222,530 |
| 21 | Wichita County | 2,091 | $79,063 | $168,344 |
| 22 | Coffey County | 8,308 | $70,346 | $193,849 |
| 23 | Anderson County | 7,834 | $70,614 | $192,521 |
| 24 | Ottawa County | 5,819 | $74,018 | $175,169 |
| 25 | Shawnee County | 178,025 | $67,104 | $200,188 |
| 26 | Thomas County | 7,885 | $71,325 | $175,114 |
| 27 | Kiowa County | 2,422 | $75,539 | $160,796 |
| 28 | Logan County | 2,707 | $75,662 | $157,808 |
| 29 | Scott County | 5,027 | $68,839 | $184,067 |
| 30 | Greeley County | 1,304 | $80,565 | $149,133 |
| 31 | Doniphan County | 7,503 | $74,028 | $165,153 |
| 32 | Trego County | 2,777 | $81,528 | $143,347 |
| 33 | Ellis County | 28,920 | $63,084 | $241,381 |
| 34 | Dickinson County | 18,445 | $68,417 | $170,171 |
| 35 | Haskell County | 3,641 | $66,162 | $175,817 |
| 36 | Stanton County | 2,038 | $71,700 | $154,679 |
| 37 | Riley County | 71,946 | $61,098 | $268,301 |
| 38 | Wyandotte County | 167,654 | $63,631 | $204,978 |
| 39 | Saline County | 53,668 | $65,422 | $175,858 |
| 40 | Clay County | 8,048 | $66,176 | $167,257 |
| 41 | Marshall County | 9,993 | $68,419 | $156,076 |
| 42 | Hamilton County | 2,471 | $70,250 | $148,171 |
| 43 | Washington County | 5,533 | $65,482 | $162,841 |
| 44 | Grant County | 7,229 | $66,476 | $152,692 |
| 45 | Gove County | 2,799 | $66,029 | $155,145 |
| 46 | Stevens County | 5,162 | $64,178 | $166,425 |
| 47 | Meade County | 3,903 | $71,852 | $121,289 |
| 48 | Geary County | 35,815 | $59,317 | $216,269 |
| 49 | Atchison County | 16,208 | $61,112 | $181,316 |
| 50 | Rawlins County | 2,516 | $67,742 | $136,296 |
| 51 | Lyon County | 32,186 | $59,912 | $186,020 |
| 52 | Ellsworth County | 6,360 | $65,560 | $137,040 |
| 53 | Marion County | 11,754 | $64,695 | $138,581 |
| 54 | Morris County | 5,340 | $58,686 | $188,209 |
| 55 | Sumner County | 22,353 | $63,951 | $144,021 |
| 56 | Seward County | 21,486 | $63,827 | $145,403 |
| 57 | Kingman County | 7,186 | $59,842 | $171,002 |
| 58 | Mitchell County | 5,779 | $64,246 | $135,931 |
| 59 | Pratt County | 9,127 | $66,022 | $123,328 |
| 60 | Wallace County | 1,417 | $63,207 | $146,652 |
| 61 | Brown County | 9,343 | $62,233 | $154,025 |
| 62 | Linn County | 9,767 | $59,069 | $169,750 |
| 63 | Sherman County | 5,858 | $61,750 | $150,841 |
| 64 | Hodgeman County | 1,652 | $59,955 | $160,390 |
| 65 | Ness County | 2,653 | $68,616 | $105,898 |
| 66 | Cheyenne County | 2,628 | $55,429 | $179,571 |
| 67 | Reno County | 61,553 | $60,645 | $151,596 |
| 68 | Morton County | 2,611 | $66,447 | $105,640 |
| 69 | Rice County | 9,350 | $63,925 | $116,693 |
| 70 | Chase County | 2,561 | $56,484 | $165,880 |
| 71 | Rooks County | 4,813 | $62,500 | $122,903 |
| 72 | Russell County | 6,679 | $62,392 | $115,682 |
| 73 | Stafford County | 3,978 | $64,226 | $102,314 |
| 74 | Phillips County | 4,813 | $62,123 | $116,450 |
| 75 | Bourbon County | 14,394 | $59,238 | $131,362 |
| 76 | Pawnee County | 6,144 | $63,517 | $107,044 |
| 77 | Elk County | 2,453 | $64,609 | $96,811 |
| 78 | Allen County | 12,483 | $60,689 | $112,160 |
| 79 | Cowley County | 34,411 | $57,878 | $124,850 |
| 80 | Cherokee County | 19,151 | $57,668 | $125,218 |
| 81 | Lincoln County | 2,923 | $57,500 | $128,552 |
| 82 | Barton County | 25,097 | $58,851 | $120,135 |
| 83 | Osborne County | 3,452 | $63,011 | $97,412 |
| 84 | Clark County | 1,974 | $63,043 | $85,923 |
| 85 | Cloud County | 8,898 | $58,770 | $115,389 |
| 86 | Smith County | 3,552 | $59,135 | $110,245 |
| 87 | Greenwood County | 5,919 | $60,042 | $104,222 |
| 88 | Wilson County | 8,505 | $60,677 | $102,252 |
| 89 | Crawford County | 39,008 | $52,844 | $135,489 |
| 90 | Barber County | 4,069 | $61,926 | $88,343 |
| 91 | Republic County | 4,646 | $56,833 | $113,992 |
| 92 | Norton County | 5,359 | $54,050 | $120,829 |
| 93 | Rush County | 2,947 | $59,970 | $92,823 |
| 94 | Neosho County | 15,656 | $56,618 | $108,187 |
| 95 | Jewell County | 2,916 | $52,634 | $117,434 |
| 96 | Graham County | 2,389 | $50,650 | $116,545 |
| 97 | Lane County | 1,461 | $54,526 | $109,476 |
| 98 | Decatur County | 2,726 | $53,870 | $108,892 |
| 99 | Woodson County | 3,109 | $50,326 | $114,987 |
| 100 | Montgomery County | 30,940 | $55,697 | $97,438 |