
You’re probably never going to make enough money to live in the richest counties in Tennessee.
The median household income in Williamson County, the richest county in Tennessee is $135,594, significantly higher than the US median of $74,580, which means based purely on math most people never make enough to live there.
And that’s okay because it’s still fun to look at the people living in the lap of luxury.
So we used Saturday Night Science and the most recent Census to rank home prices and incomes for all 94 counties in the Volunteer State. Let’s star gaze together.
Table Of Contents: Top Ten | Methodology | Table | Summary
The 10 Richest Counties In Tennessee For 2026
What is the richest county in Tennessee? The richest county in Tennessee is Williamson County. In contrast, the poorest county in state is Lake County, according to the Census data.
Now you know exactly where to move in Tennessee. Keep on reading for more about the top ten and a detailed methodology.
Or, check out the best places to live in Tennessee and the cheapest places to live in Tennessee.
The Richest Counties In Tennessee For 2026
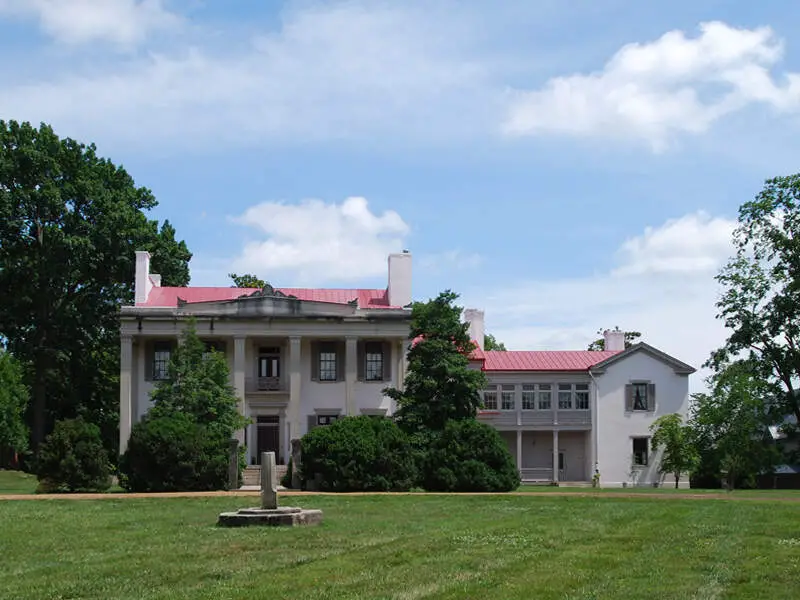
1. Williamson County
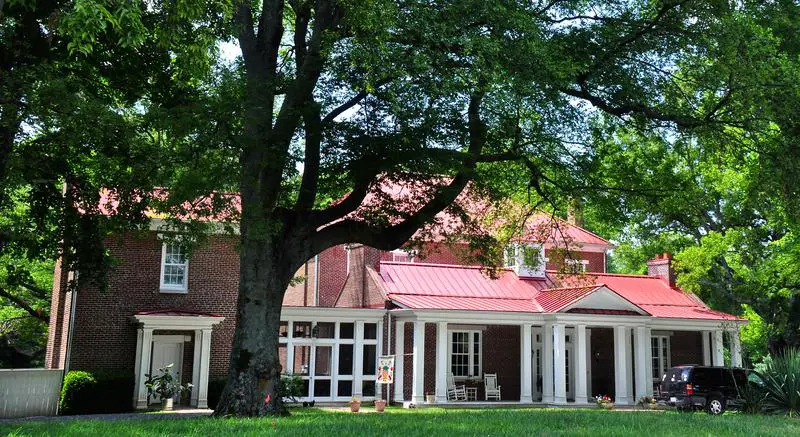
Biggest Place: Franklin
Population: 260,351
Median Income: $135,594 (highest)
Median Home Price: $925,694 (highest)
More on Williamson County: Data
2. Wilson County
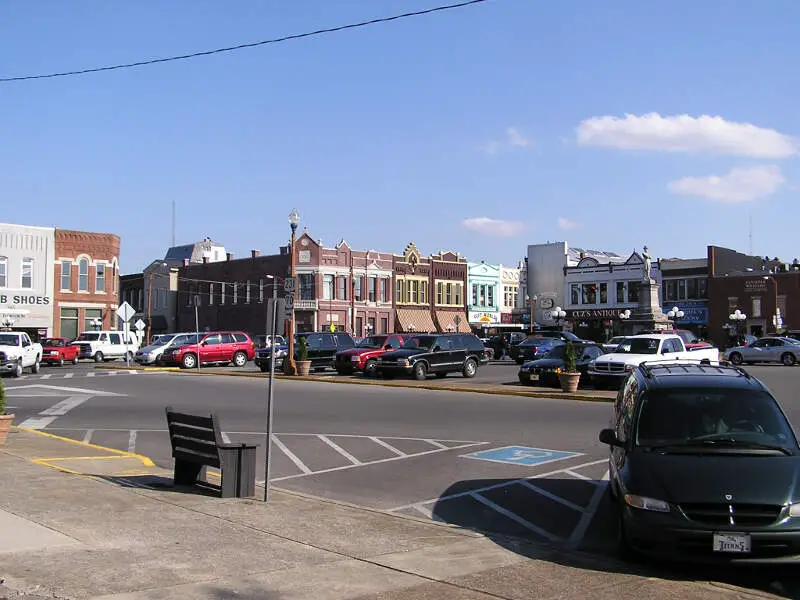
Biggest Place: Lebanon
Population: 158,805
Median Income: $95,839 (2nd highest)
Median Home Price: $501,381 (2nd highest)
More on Wilson County: Data
3. Sumner County
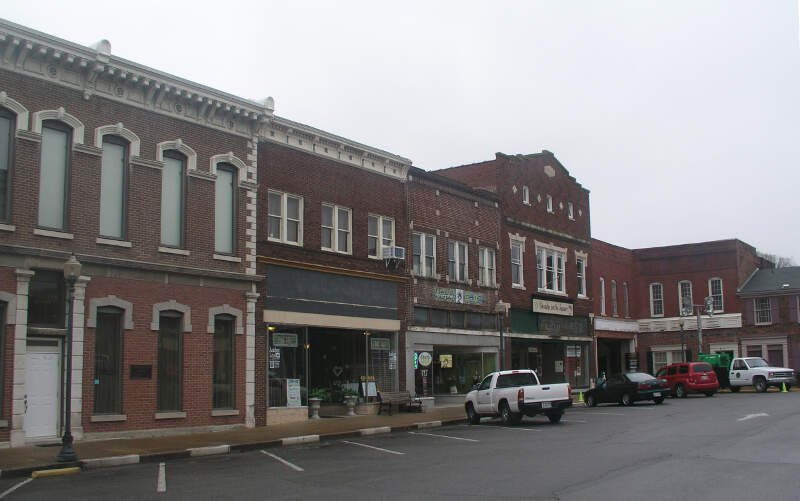
Biggest Place: Hendersonville
Population: 204,424
Median Income: $90,301 (3rd highest)
Median Home Price: $443,791 (4th highest)
More on Sumner County: Data
4. Loudon County
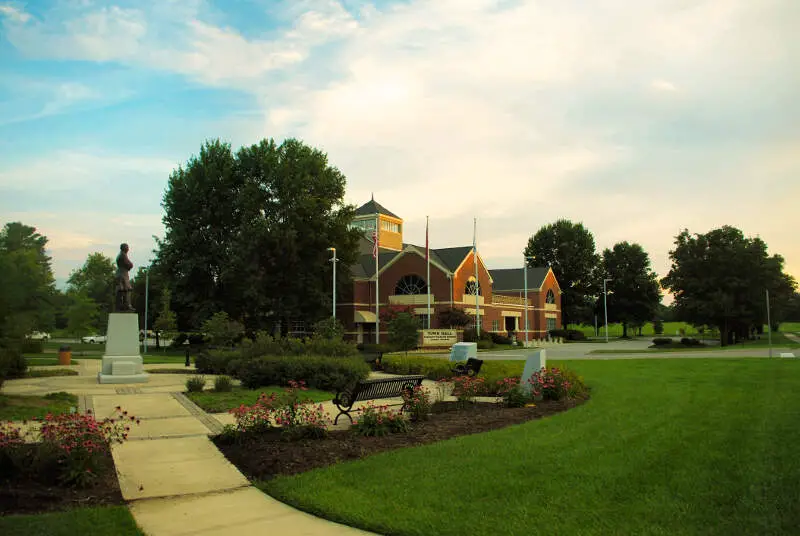
Biggest Place: Farragut
Population: 58,580
Median Income: $84,185 (7th highest)
Median Home Price: $444,727 (3rd highest)
More on Loudon County: Data
5. Rutherford County

Biggest Place: Murfreesboro
Population: 360,646
Median Income: $85,470 (6th highest)
Median Home Price: $416,884 (6th highest)
More on Rutherford County: Data
6. Cheatham County
Biggest Place: Ashland City
Population: 41,829
Median Income: $89,852 (4th highest)
Median Home Price: $393,930 (9th highest)
More on Cheatham County: Data
7. Davidson County
Biggest Place: Alexander
Population: 715,388
Median Income: $77,853 (9th highest)
Median Home Price: $432,819 (5th highest)
More on Davidson County: Data
8. Fayette County
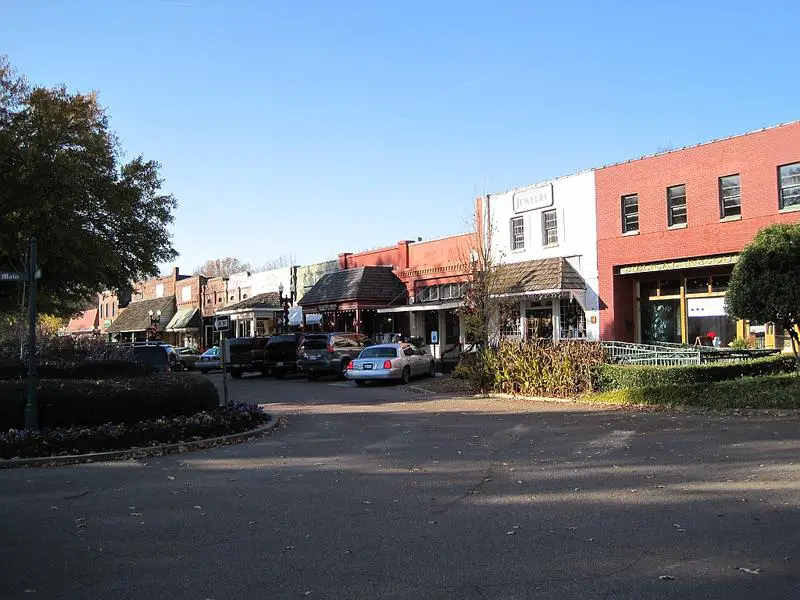
Biggest Place: Collierville
Population: 43,267
Median Income: $88,456 (5th highest)
Median Home Price: $373,539 (12th highest)
More on Fayette County: Data
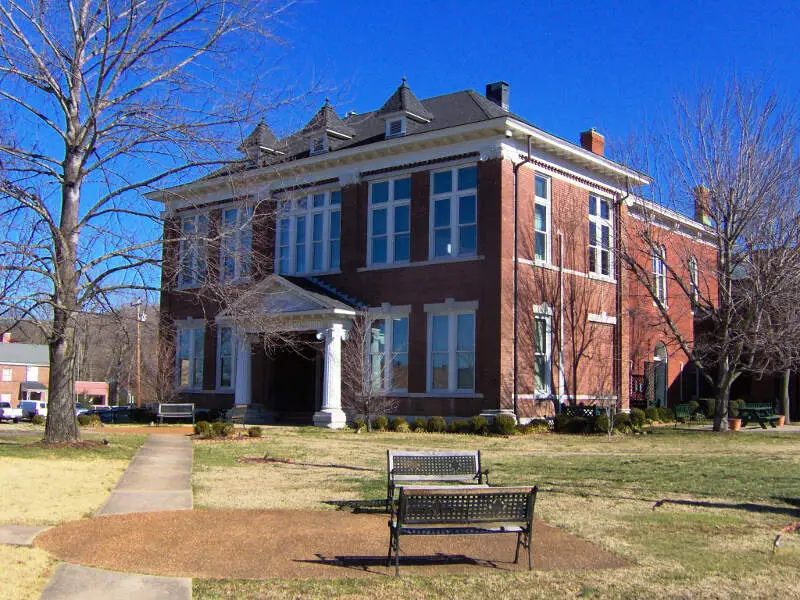
9. Maury County
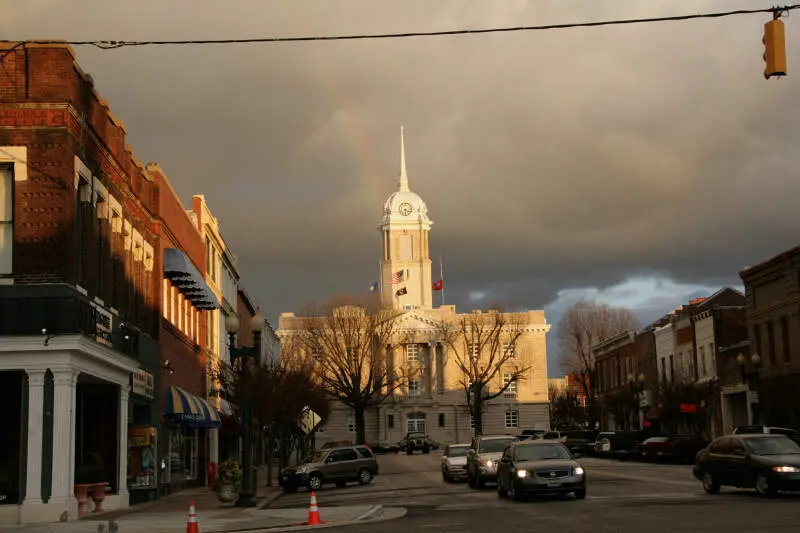
Biggest Place: Spring Hill
Population: 107,791
Median Income: $76,130 (12th highest)
Median Home Price: $403,962 (8th highest)
More on Maury County: Data
10. Blount County

Biggest Place: Maryville
Population: 139,333
Median Income: $77,365 (10th highest)
Median Home Price: $390,058 (10th highest)
More on Blount County: Data
Methodology: How do you determine which Tennessee county is the richest?
To determine the richest county in Tennessee, we have to look at a handful of metrics that correlate with how rich people are. To do that, we made assumptions about what makes a county rich. For reference, we are trying to make the kind of argument you’d make at a bar using facts, Saturday Night Science.
With that in mind, we went to the American Community Survey data and Zillow for the most recent reporting period for data on the following:
- Average Home Price
- Median Income
We then ranked each county in Tennessee for each of the criteria from one to 94, with one being the richest.
Taking the average rank across the two criteria, we created a Rich Score with the county posting the lowest overall score being the “Richest County In Tennessee.”
The result is some of the places with the most expensive real estate and highest earners in the Volunteer State.
We updated this article for 2026. This report is our first time ranking the richest counties to live in Tennessee. We have also ranked the richest states and richest cities in the United States.
Summary: The Richest Counties In Tennessee For 2026
Living in Tennessee can vary from one part of the state to the next, with pretty extreme variance in home prices and incomes across counties.
The richest counties in Tennessee are Williamson County, Wilson County, Sumner County, Loudon County, Rutherford County, Cheatham County, Davidson County, Fayette County, Maury County, and Blount County.
Now you know the parts of the state where Goodwill will have the best goodies, and that’s what you came here to learn at the end of the day.
You are welcome.
Here’s a look at the poorest counties in Tennessee according to the data:
- Lake County
- Hardeman County
- Hancock County
For more Tennessee reading, check out:
- Richest Cities In Tennessee
- Safest Places In Tennessee
- Cheapest Places To Live In Tennessee
- Best Counties To Live In Tennessee
Detailed List Of The Richest Counties In Tennessee
| Rank | County | Population | Median Income | Average Home Price |
|---|---|---|---|---|
| 1 | Williamson County | 260,351 | $135,594 | $925,694 |
| 2 | Wilson County | 158,805 | $95,839 | $501,381 |
| 3 | Sumner County | 204,424 | $90,301 | $443,791 |
| 4 | Loudon County | 58,580 | $84,185 | $444,727 |
| 5 | Rutherford County | 360,646 | $85,470 | $416,884 |
| 6 | Cheatham County | 41,829 | $89,852 | $393,930 |
| 7 | Davidson County | 715,388 | $77,853 | $432,819 |
| 8 | Fayette County | 43,267 | $88,456 | $373,539 |
| 9 | Maury County | 107,791 | $76,130 | $403,962 |
| 10 | Blount County | 139,333 | $77,365 | $390,058 |
| 11 | Robertson County | 75,539 | $83,047 | $371,615 |
| 12 | Knox County | 494,148 | $74,222 | $376,195 |
| 13 | Hamilton County | 376,192 | $76,183 | $353,406 |
| 14 | Dickson County | 55,983 | $75,003 | $360,953 |
| 15 | Trousdale County | 11,957 | $72,747 | $347,633 |
| 16 | Montgomery County | 234,153 | $75,613 | $319,063 |
| 17 | Marshall County | 36,049 | $71,049 | $330,153 |
| 18 | Bedford County | 52,237 | $67,225 | $331,980 |
| 19 | Sevier County | 99,652 | $62,581 | $405,646 |
| 20 | Jefferson County | 56,864 | $66,114 | $332,341 |
| 21 | Bradley County | 111,065 | $66,552 | $316,294 |
| 22 | Anderson County | 79,153 | $66,183 | $313,014 |
| 23 | Roane County | 55,208 | $71,885 | $294,450 |
| 24 | Smith County | 20,389 | $66,293 | $306,361 |
| 25 | Franklin County | 43,990 | $63,494 | $316,147 |
| 26 | Tipton County | 61,553 | $74,127 | $273,680 |
| 27 | Washington County | 136,261 | $62,809 | $304,282 |
| 28 | Coffee County | 59,710 | $61,505 | $311,376 |
| 29 | Union County | 20,431 | $62,727 | $289,193 |
| 30 | Cannon County | 14,818 | $59,443 | $324,570 |
| 31 | Lincoln County | 35,946 | $64,667 | $264,660 |
| 32 | Cumberland County | 63,553 | $60,375 | $304,475 |
| 33 | Meigs County | 13,343 | $61,375 | $296,449 |
| 34 | Putnam County | 82,558 | $58,912 | $314,380 |
| 35 | Giles County | 30,620 | $62,307 | $256,691 |
| 36 | Marion County | 29,250 | $61,824 | $258,198 |
| 37 | Sequatchie County | 16,809 | $58,750 | $284,706 |
| 38 | Polk County | 17,898 | $62,522 | $250,708 |
| 39 | Macon County | 26,240 | $59,177 | $265,840 |
| 40 | Monroe County | 47,695 | $56,895 | $283,485 |
| 41 | Mcminn County | 54,884 | $61,470 | $256,616 |
| 42 | Stewart County | 14,027 | $63,114 | $240,462 |
| 43 | Humphreys County | 19,214 | $60,616 | $251,840 |
| 44 | Sullivan County | 160,624 | $58,807 | $258,380 |
| 45 | Hickman County | 25,436 | $68,247 | $195,354 |
| 46 | Hamblen County | 65,669 | $55,454 | $272,389 |
| 47 | Shelby County | 919,173 | $63,767 | $218,751 |
| 48 | Morgan County | 21,361 | $65,954 | $213,662 |
| 49 | Rhea County | 33,992 | $55,033 | $261,404 |
| 50 | Lewis County | 12,992 | $56,285 | $253,213 |
| 51 | Dekalb County | 20,959 | $53,153 | $274,066 |
| 52 | Warren County | 42,166 | $55,487 | $256,687 |
| 53 | White County | 28,160 | $52,188 | $279,209 |
| 54 | Greene County | 71,628 | $56,194 | $251,736 |
| 55 | Madison County | 99,295 | $60,042 | $230,026 |
| 56 | Hawkins County | 57,964 | $56,936 | $246,876 |
| 57 | Houston County | 8,353 | $59,576 | $225,090 |
| 58 | Bledsoe County | 15,032 | $54,720 | $251,802 |
| 59 | Crockett County | 13,944 | $62,165 | $190,969 |
| 60 | Grainger County | 24,266 | $50,538 | $279,053 |
| 61 | Gibson County | 50,869 | $62,755 | $177,802 |
| 62 | Lawrence County | 45,385 | $54,706 | $247,471 |
| 63 | Johnson County | 18,196 | $53,129 | $248,687 |
| 64 | Van Buren County | 6,437 | $54,931 | $233,203 |
| 65 | Overton County | 23,065 | $48,959 | $260,910 |
| 66 | Unicoi County | 17,756 | $52,218 | $244,865 |
| 67 | Fentress County | 19,309 | $51,149 | $249,388 |
| 68 | Henderson County | 27,980 | $55,136 | $211,985 |
| 69 | Campbell County | 39,761 | $51,557 | $240,234 |
| 70 | Chester County | 17,611 | $59,341 | $165,036 |
| 71 | Dyer County | 36,508 | $58,154 | $171,208 |
| 72 | Pickett County | 5,079 | $49,030 | $248,096 |
| 73 | Carter County | 56,712 | $50,135 | $236,345 |
| 74 | Perry County | 8,697 | $55,972 | $170,545 |
| 75 | Cocke County | 36,813 | $48,016 | $244,569 |
| 76 | Henry County | 32,412 | $50,613 | $219,604 |
| 77 | Weakley County | 33,016 | $51,880 | $188,641 |
| 78 | Wayne County | 16,168 | $52,294 | $179,071 |
| 79 | Claiborne County | 32,466 | $49,379 | $224,433 |
| 80 | Jackson County | 12,029 | $47,951 | $229,197 |
| 81 | Carroll County | 28,641 | $51,787 | $180,313 |
| 82 | Benton County | 16,006 | $51,746 | $186,163 |
| 83 | Mcnairy County | 25,970 | $53,473 | $168,779 |
| 84 | Hardin County | 27,249 | $49,956 | $208,541 |
| 85 | Obion County | 30,453 | $54,613 | $162,496 |
| 86 | Clay County | 7,670 | $39,972 | $215,088 |
| 87 | Grundy County | 13,819 | $47,593 | $205,918 |
| 88 | Haywood County | 17,475 | $50,472 | $170,827 |
| 89 | Scott County | 22,113 | $44,711 | $179,780 |
| 90 | Decatur County | 11,579 | $45,375 | $177,068 |
| 91 | Lauderdale County | 24,784 | $49,879 | $133,108 |
| 92 | Hancock County | 6,852 | $34,960 | $178,521 |
| 93 | Hardeman County | 25,433 | $46,069 | $156,488 |
| 94 | Lake County | 6,579 | $28,814 | $112,423 |