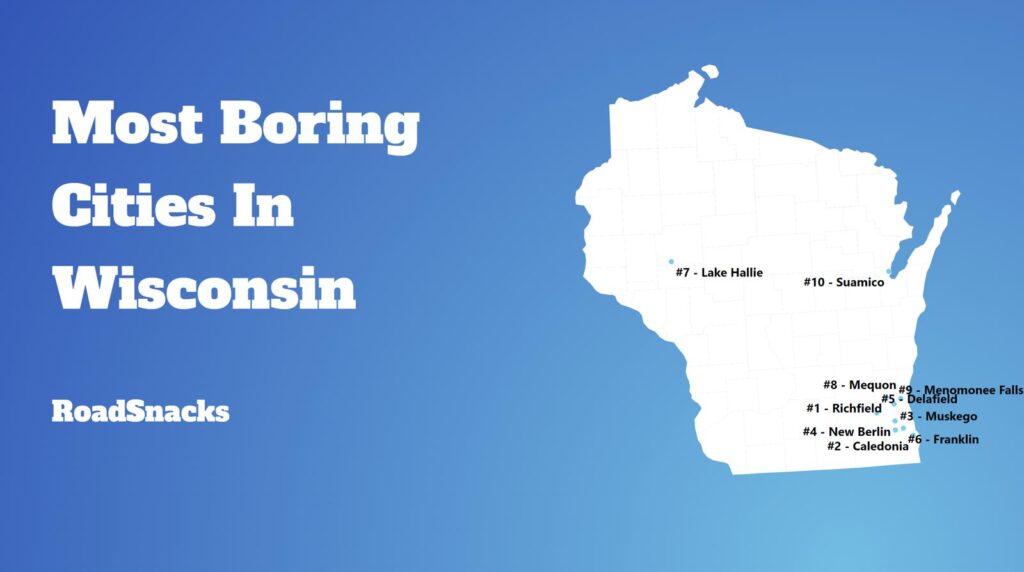
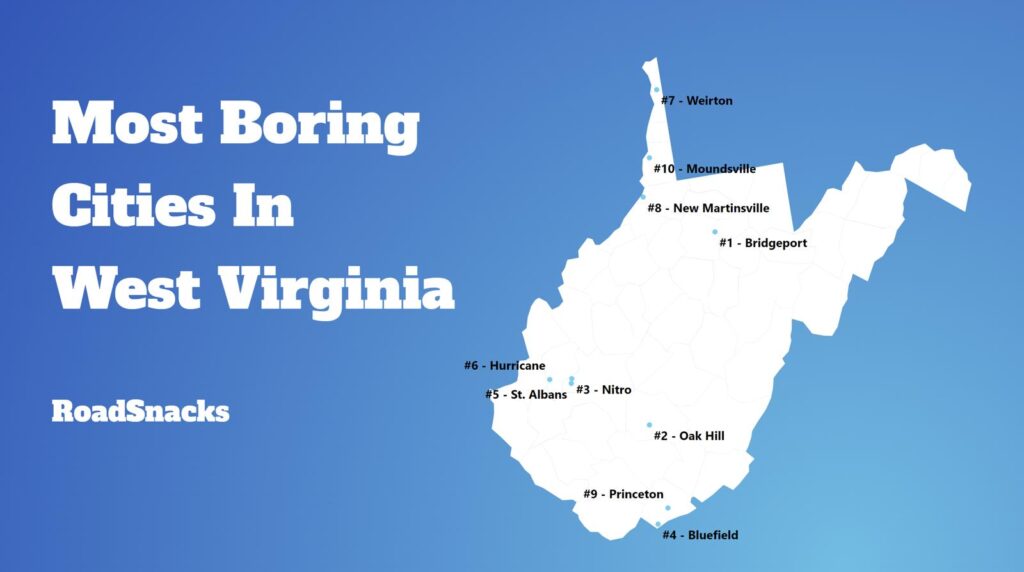
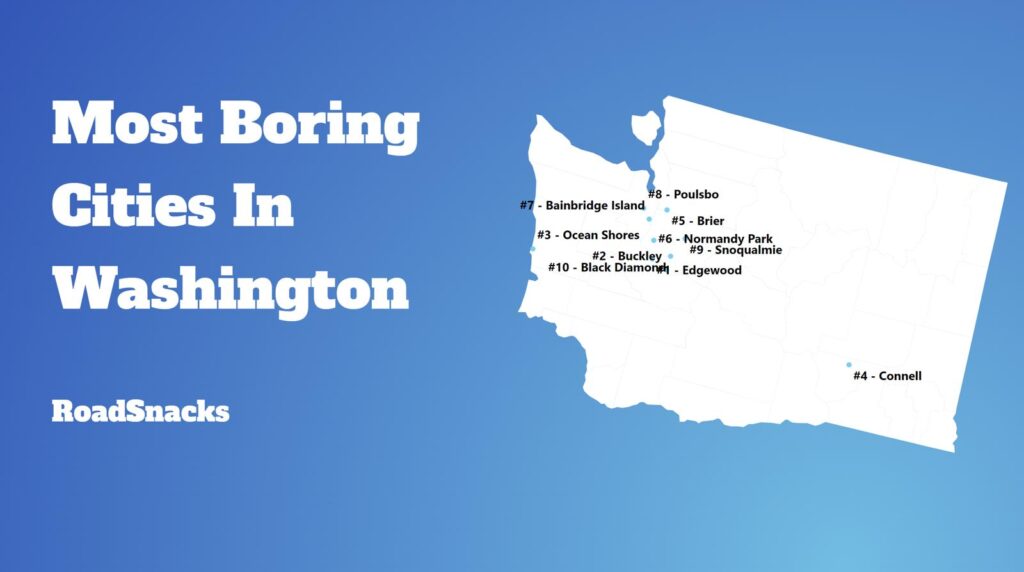
There’s no denying it: there are plenty of places in Ohio that are downright beautiful and full of excitement.
Unfortunately, not all towns and cities in Buckeye State are so lucky.
Just like in all U.S. States, there are definitely some boring places within Ohio’s’ borders. You know the places where everyone has an AARP card and the most exciting thing they do all day is post a picture of their grandchild on Facebook.
Like Brecksville, for instance. In our latest analysis, we found that this city was the most boring city in all of Ohio according to Saturday Night Science. But don’t feel bad if you’re a resident of Brecksville. There are plenty of other boring, lackluster places in Ohio as well.
Here they are. Try not to jump out of your seat with excitement.
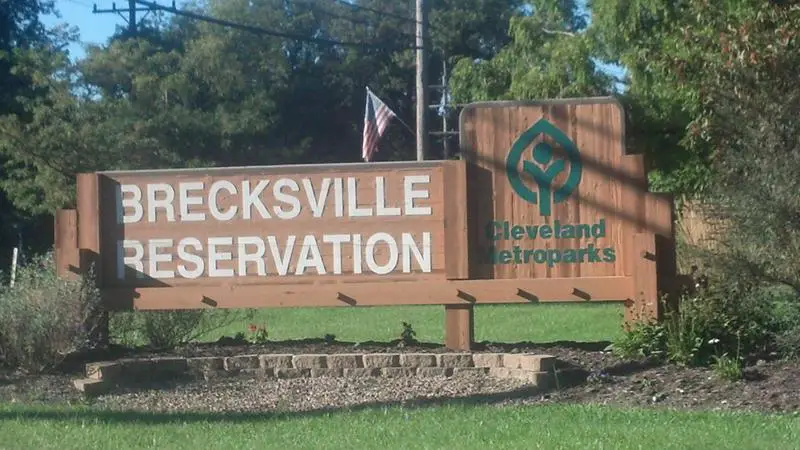
49.4 median age · 44.0% married households · #9 oldest in Ohio
 Located in
Cuyahoga County, Ohio
Located in
Cuyahoga County, Ohio
Brecksville is a city in Cuyahoga County, Ohio, United States, and a suburb in the Greater Cleveland area. The city’s population was 13,656 at the 2010 census.
Data | Crime | Cost of living | Movers
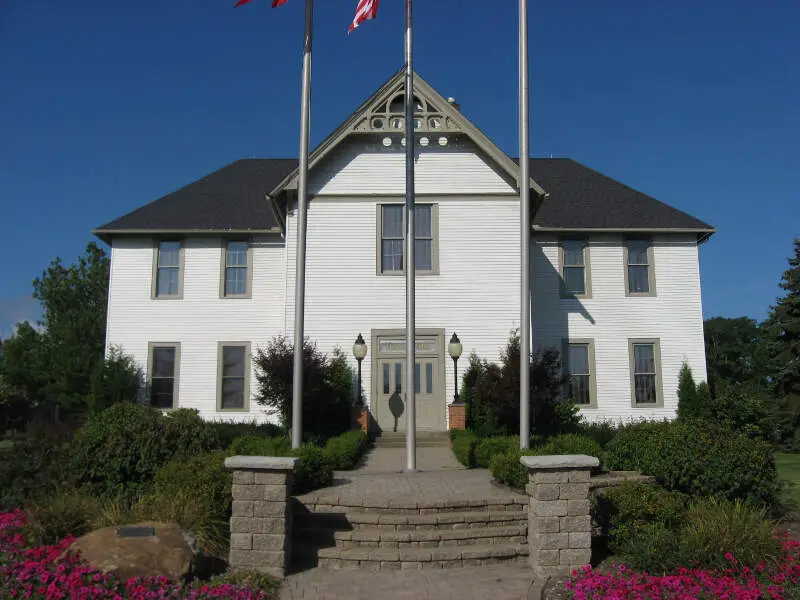
48.0 median age · 38.0% married households · #15 oldest in Ohio
 Located in
Portage County, Ohio
Located in
Portage County, Ohio
Data | Crime | Cost of living | Movers
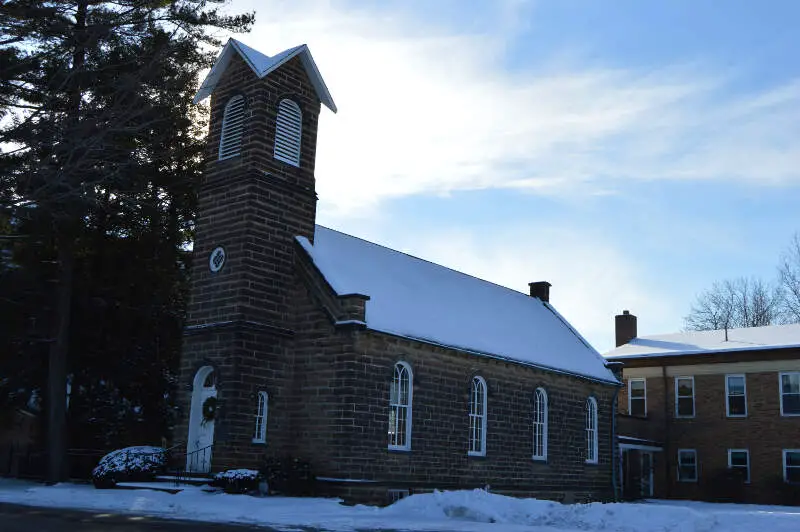
48.4 median age · 48.0% married households · #12 oldest in Ohio
 Located in
Cuyahoga County, Ohio
Located in
Cuyahoga County, Ohio
Data | Crime | Cost of living | Movers
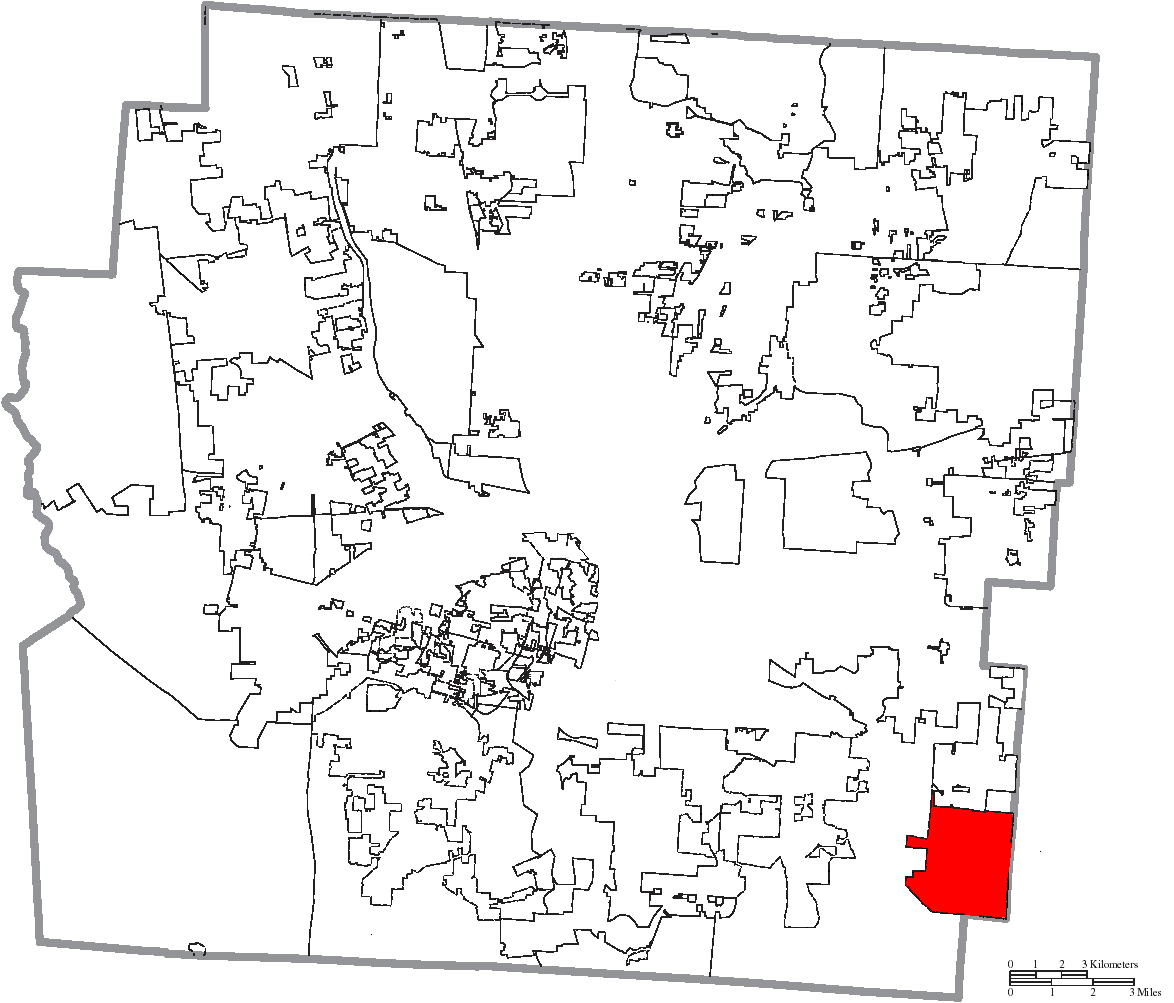
42.7 median age · 47.0% married households · #71 oldest in Ohio
 Located in
Franklin County, Ohio
Located in
Franklin County, Ohio
Canal Winchester is a city in Fairfield and Franklin counties in the U.S. state of Ohio. The population was 7,101 at the 2010 census.
Data | Crime | Cost of living | Movers
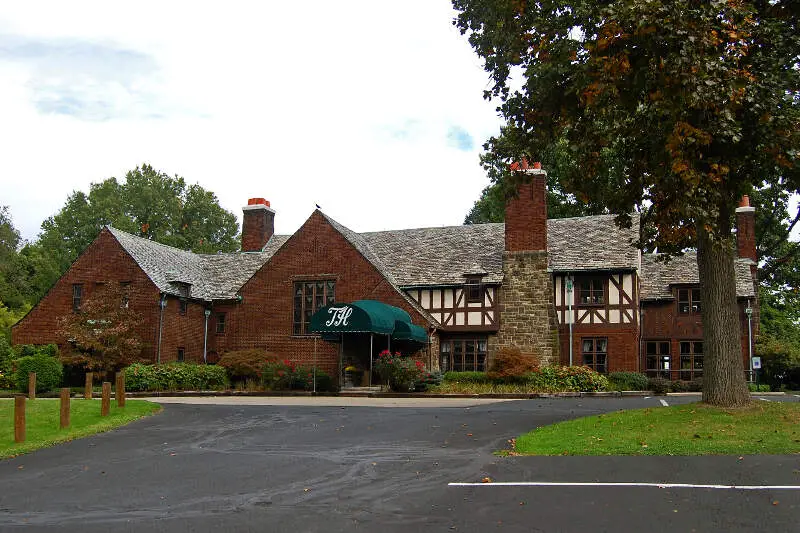
47.9 median age · 49.0% married households · #17 oldest in Ohio
 Located in
Summit County, Ohio
Located in
Summit County, Ohio
Data | Crime | Cost of living | Movers
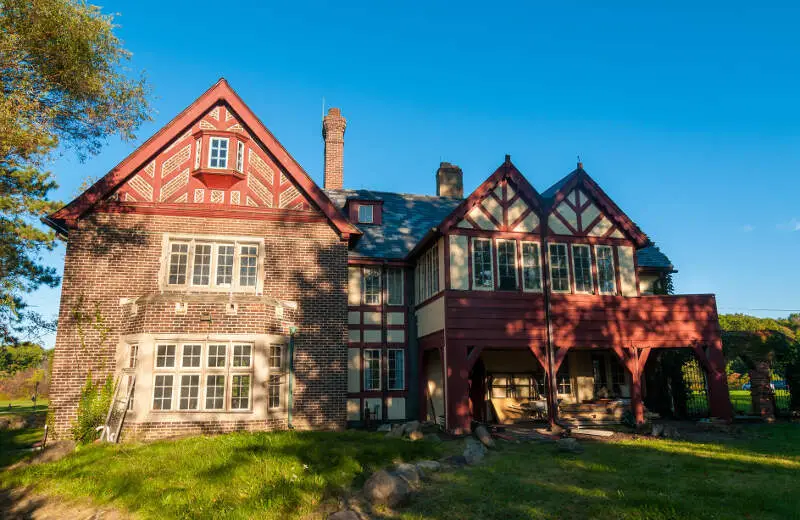
44.7 median age · 41.0% married households · #42 oldest in Ohio
 Located in
Summit County, Ohio
Located in
Summit County, Ohio
Macedonia is a city in Summit County, Ohio, United States. The population was 11,188 at the 2010 census. Macedonia is part of the Akron Metropolitan Statistical Area.
Data | Crime | Cost of living | Movers
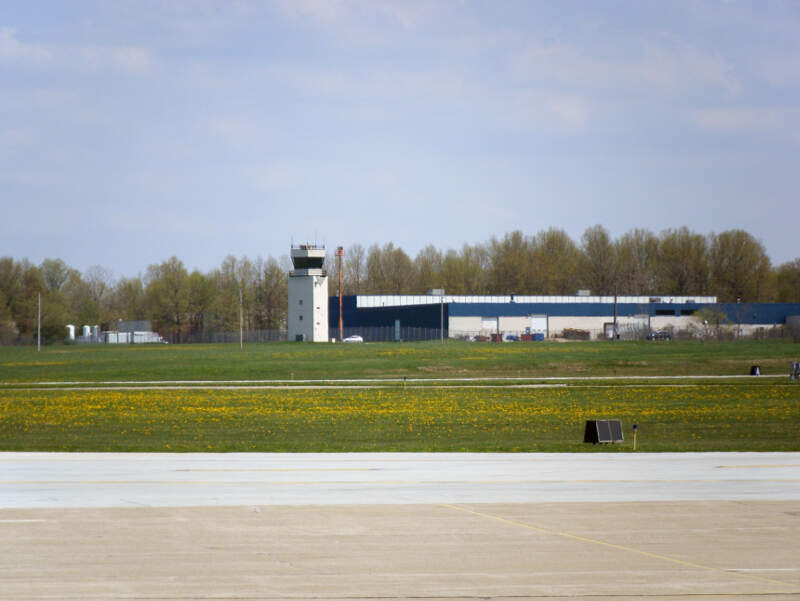
44.9 median age · 43.0% married households · #40 oldest in Ohio
 Located in
Cuyahoga County, Ohio
Located in
Cuyahoga County, Ohio
Data | Crime | Cost of living | Movers
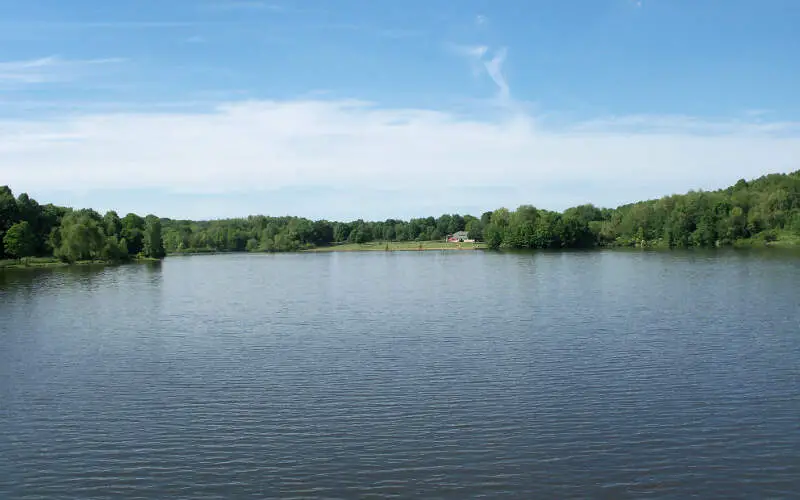
47.1 median age · 42.0% married households · #19 oldest in Ohio
 Located in
Wayne County, Ohio
Located in
Wayne County, Ohio
Norton is a city in Summit and Wayne counties in the U.S. state of Ohio. The population was 12,085 at the 2010 census.
Data | Crime | Cost of living | Movers
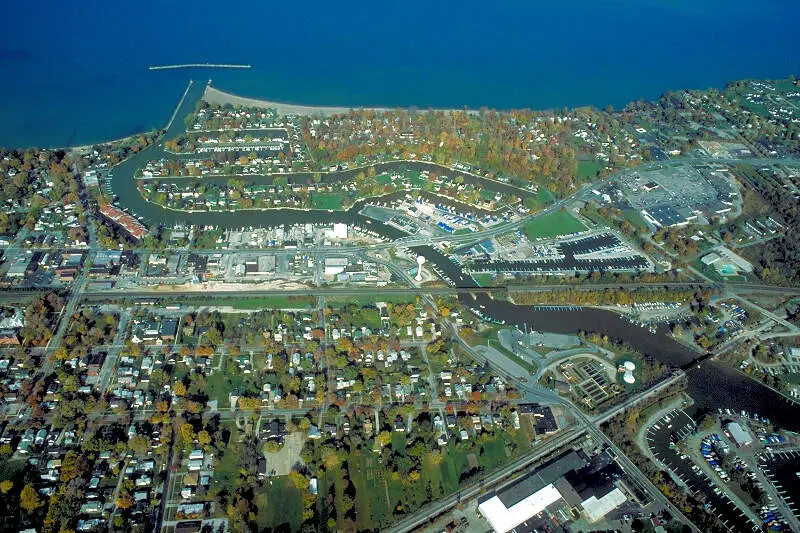
50.6 median age · 44.0% married households · #6 oldest in Ohio
 Located in
Lorain County, Ohio
Located in
Lorain County, Ohio
Vermilion is a city in Erie and Lorain counties in the U.S. state of Ohio, on Lake Erie. The population was 10,594 at the 2010 census. The current mayor is Eileen Bulan. The Lorain County portion of Vermilion is part of the Cleveland-Elyria-Mentor Metropolitan Statistical Area, while the Erie County portion is part of the Sandusky Micropolitan Statistical Area.
Data | Crime | Cost of living | Movers
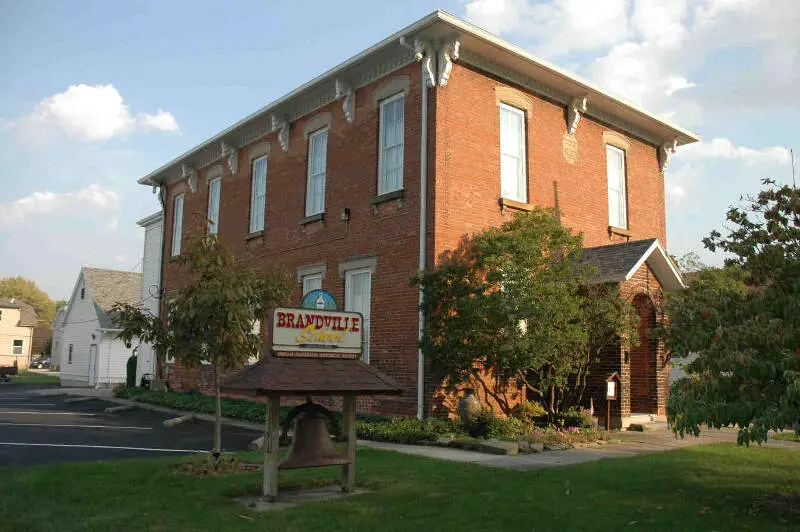
45.1 median age · 41.0% married households · #39 oldest in Ohio
 Located in
Lucas County, Ohio
Located in
Lucas County, Ohio
Data | Crime | Cost of living | Movers
The receipts
Compare the top ten
Pick a metric. The bars rescale. The red line is Ohio’s statewide median.
On the map
Where the quiet settles in Ohio
Saturday Night Science
Methodology: How we determined the boring cities in the Buckeye State
You would present the following case to your friends if you were argueing with them at a bar about the most boring place to live in Ohio. And that’s why we call it Saturday Night Science.
Because our data speaks more truth than feelings.
To figure out how boring a place is, we factored in things we generally think make people exciting, and then we figure out which cities have the least number of those exciting people.
We used the U.S. American Community Census data to gather the information presented here. Some of the things people tend to think of as making a city’s population boring include:
- % of Population Over 25 (higher is more boring)
- % of Married Household (higher is more boring)
- Average Age (higher is more boring)
- % of Households With Kids (higher is more boring)
- Population density (lower is more boring)
Then, our algorithm generates a ranking for each place in these categories. After crunching the numbers, all of the cities ranked from most boring to most exciting.
For this ranking, we used every Ohio city with at least 5,000 residents. This keeps us from prejudicing our rankings by including very small pockets of retired people.
Grab your rocker and hold on.
We updated this article for 2026, and it’s our eleventh time ranking the most boring cities in Ohio.
The full plate
Detailed List Of The Most Boring Cities In Ohio For 2026
Click any column to sort. Search by city name.
| Rank | City | Boring Score | Population | Average Age | % Married | % Kids |
|---|---|---|---|---|---|---|
| 1 | Brecksville | 36.80 | 13,692 | 49.4 | 44.0% | 28.5% |
| 2 | Aurora | 40.90 | 17,581 | 48.0 | 38.0% | 31.4% |
| 3 | Independence | 43.40 | 7,534 | 48.4 | 48.0% | 25.6% |
| 4 | Canal Winchester | 43.62 | 10,170 | 42.7 | 47.0% | 32.3% |
| 5 | New Franklin | 46.70 | 13,843 | 47.9 | 49.0% | 23.6% |
| 6 | Macedonia | 47.20 | 12,152 | 44.7 | 41.0% | 31.7% |
| 7 | Highland Heights | 48.00 | 8,623 | 44.9 | 43.0% | 30.6% |
| 8 | Norton | 48.40 | 11,524 | 47.1 | 42.0% | 24.3% |
| 9 | Vermilion | 48.50 | 10,343 | 50.6 | 44.0% | 24.1% |
| 10 | Oregon | 48.50 | 19,799 | 45.1 | 41.0% | 29.3% |
| 11 | Kirtland | 49.70 | 6,911 | 51.0 | 47.0% | 23.0% |
| 12 | Twinsburg | 53.10 | 19,410 | 44.1 | 38.0% | 30.9% |
| 13 | Solon | 55.50 | 23,943 | 45.3 | 36.0% | 35.0% |
| 14 | Clayton | 58.30 | 13,277 | 45.6 | 34.0% | 29.0% |
| 15 | Clyde | 59.50 | 6,331 | 46.0 | 35.0% | 27.3% |
| 16 | Hudson | 62.30 | 23,039 | 42.8 | 38.0% | 39.8% |
| 17 | Pepper Pike | 64.00 | 6,840 | 51.6 | 30.0% | 26.9% |
| 18 | Green | 64.30 | 27,393 | 42.1 | 41.0% | 29.1% |
| 19 | North Ridgeville | 64.30 | 36,627 | 41.5 | 40.0% | 31.9% |
| 20 | Columbiana | 64.50 | 6,903 | 51.3 | 38.0% | 13.9% |
| 21 | Avon Lake | 64.60 | 25,752 | 44.3 | 42.0% | 31.2% |
| 22 | Tallmadge | 65.40 | 18,335 | 46.2 | 39.0% | 23.4% |
| 23 | Broadview Heights | 65.70 | 19,771 | 44.3 | 37.0% | 28.9% |
| 24 | Northwood | 65.80 | 5,193 | 43.3 | 45.0% | 25.2% |
| 25 | Louisville | 68.70 | 9,602 | 42.4 | 49.0% | 30.5% |
| 26 | Avon | 70.10 | 25,317 | 41.0 | 43.0% | 36.6% |
| 27 | Galion | 71.50 | 10,339 | 42.9 | 37.0% | 29.9% |
| 28 | Mentor | 72.00 | 47,171 | 46.5 | 39.0% | 25.0% |
| 29 | North Royalton | 72.20 | 30,972 | 45.7 | 36.0% | 25.3% |
| 30 | Wellston | 72.60 | 5,452 | 40.1 | 36.0% | 34.8% |
| 31 | Streetsboro | 73.50 | 17,661 | 42.6 | 35.0% | 24.7% |
| 32 | Strongsville | 73.50 | 45,983 | 46.1 | 39.0% | 25.5% |
| 33 | Amherst | 74.10 | 12,906 | 42.8 | 43.0% | 27.6% |
| 34 | Wapakoneta | 74.20 | 9,894 | 40.7 | 43.0% | 28.1% |
| 35 | Bellbrook | 74.60 | 7,394 | 43.5 | 38.0% | 28.1% |
| 36 | Grafton | 75.00 | 5,657 | 41.8 | 21.0% | 36.8% |
| 37 | Heath | 75.50 | 10,644 | 43.2 | 36.0% | 27.9% |
| 38 | Canfield | 78.20 | 7,649 | 51.2 | 36.0% | 20.1% |
| 39 | Bucyrus | 78.60 | 11,594 | 42.4 | 39.0% | 28.1% |
| 40 | Seven Hills | 79.20 | 11,603 | 50.9 | 43.0% | 21.8% |
| 41 | Chardon | 79.60 | 5,249 | 38.9 | 38.0% | 30.9% |
| 42 | Cortland | 80.00 | 7,080 | 47.0 | 41.0% | 21.4% |
| 43 | Brookville | 80.30 | 5,779 | 47.0 | 36.0% | 22.9% |
| 44 | Conneaut | 80.60 | 12,357 | 40.4 | 27.0% | 31.0% |
| 45 | Worthington | 81.60 | 14,938 | 43.2 | 38.0% | 33.1% |
| 46 | Miamisburg | 82.20 | 19,948 | 40.0 | 36.0% | 33.8% |
| 47 | Fairlawn | 83.10 | 7,711 | 46.7 | 27.0% | 26.7% |
| 48 | Waterville | 84.62 | 6,017 | 41.3 | 37.0% | 32.6% |
| 49 | Huron | 84.70 | 6,757 | 48.0 | 38.0% | 17.5% |
| 50 | London | 85.00 | 10,484 | 41.9 | 36.0% | 23.2% |
| 51 | Stow | 85.40 | 34,240 | 41.5 | 39.0% | 28.6% |
| 52 | Bryan | 86.50 | 8,631 | 43.4 | 26.0% | 28.9% |
| 53 | Germantown | 88.25 | 5,825 | 40.9 | 44.0% | 32.2% |
| 54 | Powell | 88.90 | 14,451 | 42.8 | 35.0% | 45.3% |
| 55 | Mason | 89.90 | 35,509 | 42.4 | 28.0% | 36.0% |
| 56 | Kenton | 90.30 | 7,663 | 41.0 | 43.0% | 30.5% |
| 57 | Upper Sandusky | 90.50 | 6,558 | 37.2 | 39.0% | 30.5% |
| 58 | Geneva | 90.80 | 5,886 | 48.6 | 32.0% | 23.6% |
| 59 | Rossford | 91.60 | 6,323 | 40.6 | 40.0% | 21.3% |
| 60 | Hubbard | 91.60 | 7,598 | 46.1 | 37.0% | 23.1% |
| 61 | Montgomery | 92.70 | 10,855 | 43.3 | 34.0% | 36.7% |
| 62 | Union | 93.10 | 7,037 | 36.8 | 42.0% | 28.6% |
| 63 | Napoleon | 93.80 | 8,802 | 39.4 | 39.0% | 30.0% |
| 64 | Van Wert | 93.80 | 10,790 | 41.2 | 34.0% | 30.6% |
| 65 | Englewood | 93.80 | 13,356 | 41.4 | 39.0% | 26.7% |
| 66 | Dublin | 93.80 | 49,294 | 43.3 | 30.0% | 41.9% |
| 67 | Bellevue | 94.20 | 8,187 | 38.6 | 35.0% | 34.2% |
| 68 | Westlake | 94.20 | 34,104 | 46.9 | 32.0% | 25.6% |
| 69 | New Philadelphia | 94.80 | 17,520 | 43.2 | 38.0% | 24.5% |
| 70 | Olmsted Falls | 94.90 | 8,639 | 45.6 | 37.0% | 22.2% |
| 71 | Blue Ash | 95.20 | 13,455 | 38.8 | 31.0% | 33.0% |
| 72 | Middleburg Heights | 95.20 | 15,786 | 49.8 | 32.0% | 20.6% |
| 73 | Eaton | 96.70 | 8,339 | 43.3 | 29.0% | 25.3% |
| 74 | Girard | 97.40 | 9,505 | 43.7 | 31.0% | 26.4% |
| 75 | Urbana | 101.00 | 11,204 | 37.2 | 38.0% | 30.2% |
| 76 | Delphos | 102.00 | 7,143 | 40.2 | 44.0% | 25.2% |
| 77 | Marysville | 102.50 | 27,518 | 36.5 | 31.0% | 34.7% |
| 78 | Brook Park | 102.80 | 18,284 | 44.7 | 35.0% | 23.8% |
| 79 | Toronto | 102.90 | 5,293 | 45.7 | 37.0% | 19.1% |
| 80 | Defiance | 103.00 | 17,276 | 41.8 | 32.0% | 25.5% |
| 81 | Pataskala | 103.00 | 18,223 | 37.1 | 29.0% | 37.1% |
| 82 | Sharonville | 104.00 | 14,030 | 43.5 | 27.0% | 18.3% |
| 83 | Wadsworth | 104.00 | 24,492 | 40.0 | 39.0% | 27.6% |
| 84 | Brunswick | 104.30 | 35,246 | 41.0 | 38.0% | 28.9% |
| 85 | Monroe | 104.50 | 15,401 | 36.5 | 37.0% | 40.9% |
| 86 | Shelby | 105.10 | 8,865 | 39.1 | 38.0% | 26.8% |
| 87 | New Albany | 105.25 | 10,896 | 42.5 | 30.0% | 53.9% |
| 88 | Port Clinton | 105.30 | 5,970 | 44.3 | 35.0% | 26.9% |
| 89 | Wauseon | 105.70 | 7,505 | 38.3 | 36.0% | 39.3% |
| 90 | Massillon | 106.00 | 32,338 | 41.0 | 34.0% | 23.5% |
| 91 | Willoughby | 106.30 | 24,046 | 45.6 | 34.0% | 17.5% |
| 92 | Lebanon | 106.60 | 21,501 | 38.5 | 34.0% | 33.1% |
| 93 | Logan | 107.30 | 6,993 | 37.5 | 38.0% | 35.9% |
| 94 | Milford | 107.90 | 6,497 | 49.0 | 25.0% | 20.5% |
| 95 | North Olmsted | 108.80 | 31,924 | 44.5 | 36.0% | 24.6% |
| 96 | Maumee | 108.90 | 13,715 | 40.4 | 36.0% | 24.6% |
| 97 | Reading | 109.60 | 10,502 | 45.3 | 37.0% | 20.1% |
| 98 | Harrison | 110.10 | 13,084 | 37.1 | 44.0% | 34.6% |
| 99 | Medina | 110.20 | 25,950 | 40.7 | 35.0% | 28.9% |
| 100 | Westerville | 110.50 | 38,645 | 40.7 | 35.0% | 33.5% |
Source: U.S. Census ACS 2020-2024. 244 cities with more than 5,000 residents.
Summary
There You Have It – Now That You’re Asleep
On a ranking like this, there are usually no winners, but since Ohio isn’t necessarily the most boring state in the United States, the cities on this ranking can at least take solace that there are, in fact, more boring cities in the country.
The most boring cities in Ohio are Brecksville, Aurora, Independence, Canal Winchester, New Franklin, Macedonia, Highland Heights, Norton, Vermilion, and Oregon.
If you’re also curious enough, here are the most exciting places in Ohio, according to science. Not sold on Ohio? Take the two-minute Find Your Place quiz and see which state actually fits you.
Questions and answers
Most Boring Places In Ohio FAQs
What is the most boring place in Ohio?
Brecksville is the most boring place in Ohio for 2026, according to Saturday Night Science. 44.0% of its households are married, which is exactly the kind of statistic that earns boring points.
What are the most boring cities in Ohio?
The most boring places in Ohio are Brecksville, Aurora, Independence, Canal Winchester, New Franklin, Macedonia, Highland Heights, Norton, Vermilion, and Oregon. We ranked all 244 places with more than 5,000 residents.
What makes a town boring?
Older residents, lots of married households, lots of families with kids, and low population density. In other words, quiet — measured with Census American Community Survey data.
What is the most exciting place in Ohio?
Oxford sits at the other end of the Boring Score, making it the most exciting place in Ohio by our measure. Interpret that however you like.
Is being boring bad?
Not really. The traits that score boring points — settled neighbors, families, quiet streets — are the same things plenty of people move for. Take this as Saturday Night Science, not a verdict.