Massillon, OH
Demographics And Statistics
Living In Massillon, Ohio Summary
Life in Massillon research summary. HomeSnacks has been using Saturday Night Science to research the quality of life in Massillon over the past nine years using Census, FBI, Zillow, and other primary data sources. Based on the most recently available data, we found the following about life in Massillon:
The population in Massillon is 32,177.
The median home value in Massillon is $212,231.
The median income in Massillon is $55,308.
The cost of living in Massillon is 86 which is 0.9x lower than the national average.
The median rent in Massillon is $846.
The unemployment rate in Massillon is 3.6%.
The poverty rate in Massillon is 14.6%.
The average high in Massillon is 59.8° and the average low is 41.4°.
Massillon SnackAbility
Overall SnackAbility
Massillon, OH Crime Report
Crime in Massillon summary. We use data from the FBI to determine the crime rates in Massillon. Key points include:
There were 695 total crimes in Massillon in the last reporting year.
The overall crime rate per 100,000 people in Massillon is 2,133.9 / 100k people.
The violent crime rate per 100,000 people in Massillon is 316.3 / 100k people.
The property crime rate per 100,000 people in Massillon is 1,817.7 / 100k people.
Overall, crime in Massillon is 0.69% above the national average.
Total Crimes
Above National Average
Crime In Massillon Comparison Table
| Statistic | Count Raw |
Massillon / 100k People |
Ohio / 100k People |
National / 100k People |
|---|---|---|---|---|
| Total Crimes Per 100K | 695 | 2,133.9 | 1,844.9 | 2,119.2 |
| Violent Crime | 103 | 316.3 | 293.7 | 359.0 |
| Murder | 2 | 6.1 | 5.0 | 5.0 |
| Robbery | 7 | 21.5 | 45.5 | 61.0 |
| Aggravated Assault | 73 | 224.1 | 197.4 | 256.0 |
| Property Crime | 592 | 1,817.7 | 1,551.2 | 1,760.0 |
| Burglary | 64 | 196.5 | 206.0 | 229.0 |
| Larceny | 488 | 1,498.4 | 1,132.8 | 1,272.0 |
| Car Theft | 40 | 122.8 | 212.5 | 259.0 |
Massillon, OH Cost Of Living
Cost of living in Massillon summary. We use data on the cost of living to determine how expensive it is to live in Massillon. Real estate prices drive most of the variance in cost of living around Ohio. Key points include:
The cost of living in Massillon is 86 with 100 being average.
The cost of living in Massillon is 0.9x lower than the national average.
The median home value in Massillon is $212,231.
The median income in Massillon is $55,308.
Massillon's Overall Cost Of Living
Lower Than The National Average
Cost Of Living In Massillon Comparison Table
| Living Expense | Massillon | Ohio | National Average | |
|---|---|---|---|---|
| Overall | 86 | 93 | 100 | |
| Services | 93 | 101 | 100 | |
| Groceries | 99 | 103 | 100 | |
| Health | 97 | 97 | 100 | |
| Housing | 62 | 74 | 100 | |
| Transportation | 100 | 102 | 100 | |
| Utilities | 104 | 100 | 100 | |
Massillon, OH Weather
The average high in Massillon is 59.8° and the average low is 41.4°.
There are 85.5 days of precipitation each year.
Expect an average of 39.0 inches of precipitation each year with 39.7 inches of snow.
| Stat | Massillon |
|---|---|
| Average Annual High | 59.8 |
| Average Annual Low | 41.4 |
| Annual Precipitation Days | 85.5 |
| Average Annual Precipitation | 39.0 |
| Average Annual Snowfall | 39.7 |
Average High
Days of Rain
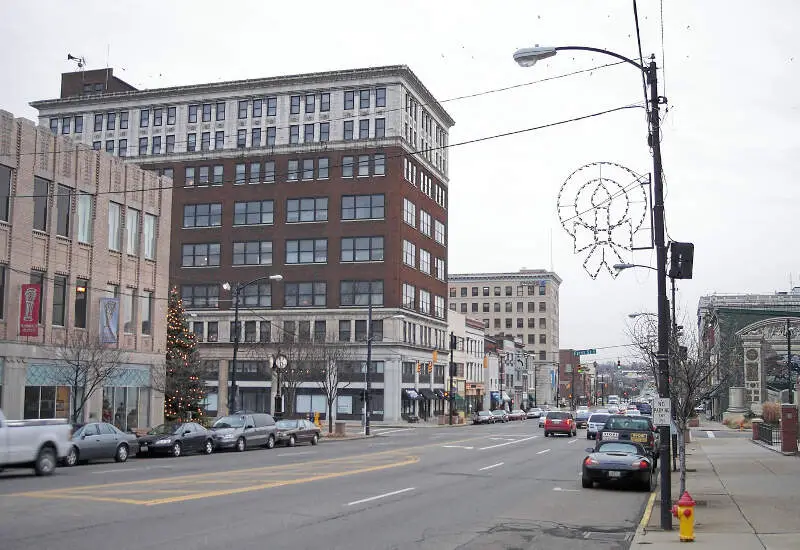
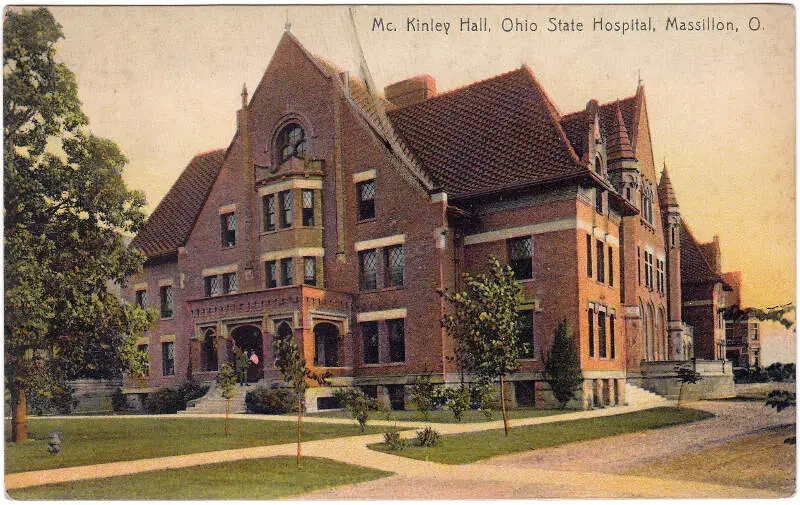
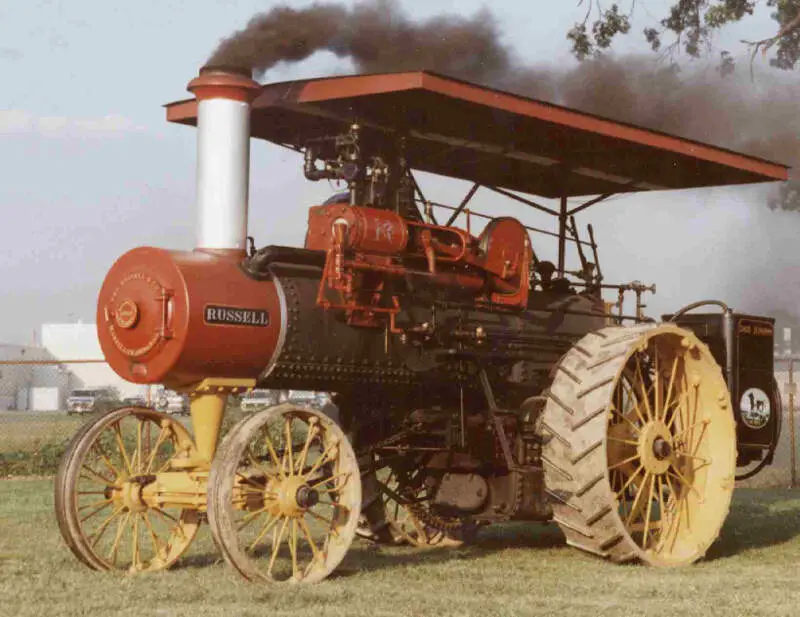
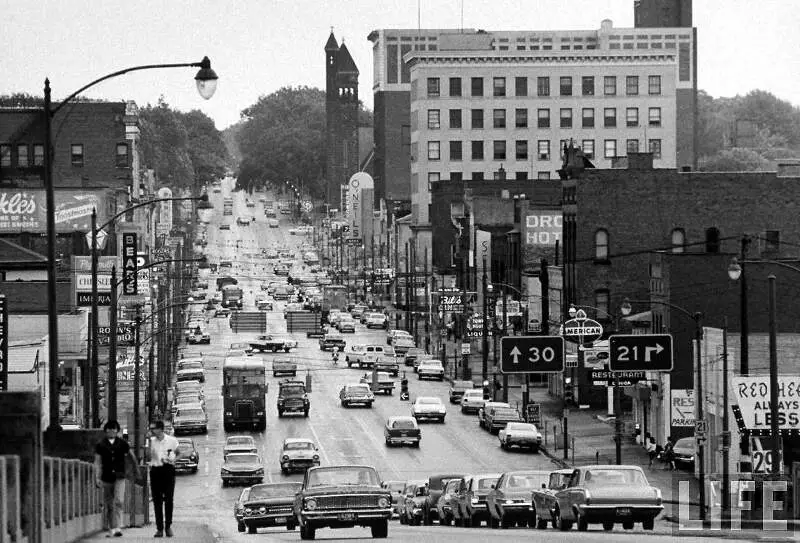
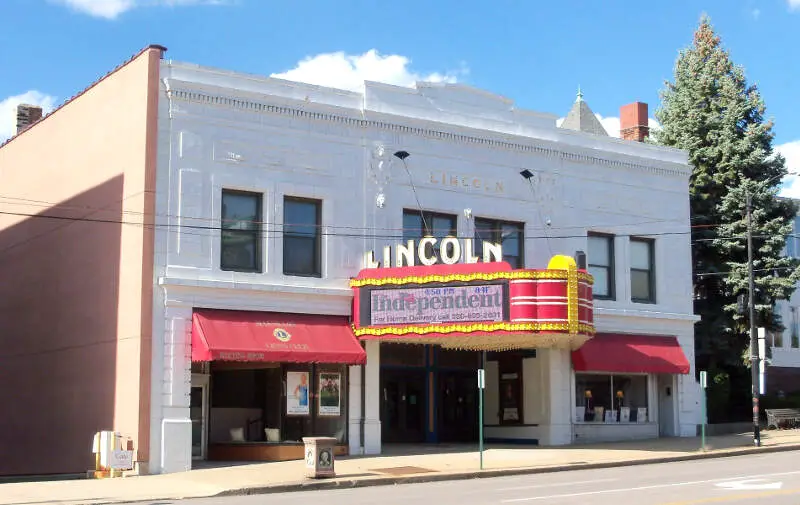
Massillon, OH Photos
Rankings for Massillon in Ohio


Locations Around Massillon
Map Of Massillon, OH
Best Places Around Massillon
New Franklin, OH
Population 13,830
Green, OH
Population 27,381
Dover, OH
Population 13,094
North Canton, OH
Population 17,746
Norton, OH
Population 11,576
Rittman, OH
Population 6,033
Louisville, OH
Population 9,560
Orrville, OH
Population 8,361
Canal Fulton, OH
Population 5,326
Portage Lakes, OH
Population 6,199
Massillon Demographics And Statistics
Population over time in Massillon
The current population in Massillon is 32,177. The population has increased 0.5% from 2010.
| Year | Population | % Change |
|---|---|---|
| 2023 | 32,177 | -0.0% |
| 2022 | 32,179 | -0.1% |
| 2021 | 32,199 | -0.9% |
| 2020 | 32,484 | 0.2% |
| 2019 | 32,415 | 0.2% |
| 2018 | 32,366 | 0.1% |
| 2017 | 32,320 | 0.2% |
| 2016 | 32,268 | 0.2% |
| 2015 | 32,215 | -0.0% |
| 2014 | 32,224 | 0.3% |
| 2013 | 32,130 | 0.0% |
| 2012 | 32,126 | 0.2% |
| 2011 | 32,077 | 0.2% |
| 2010 | 32,020 | - |
Race / Ethnicity in Massillon
Massillon is:
84.4% White with 27,173 White residents.
8.5% African American with 2,739 African American residents.
0.2% American Indian with 58 American Indian residents.
0.6% Asian with 183 Asian residents.
0.0% Hawaiian with 0 Hawaiian residents.
0.3% Other with 99 Other residents.
4.1% Two Or More with 1,307 Two Or More residents.
1.9% Hispanic with 618 Hispanic residents.
| Race | Massillon | OH | USA |
|---|---|---|---|
| White | 84.4% | 76.5% | 58.2% |
| African American | 8.5% | 12.1% | 12.0% |
| American Indian | 0.2% | 0.1% | 0.5% |
| Asian | 0.6% | 2.4% | 5.7% |
| Hawaiian | 0.0% | 0.0% | 0.2% |
| Other | 0.3% | 0.4% | 0.5% |
| Two Or More | 4.1% | 3.9% | 3.9% |
| Hispanic | 1.9% | 4.6% | 19.0% |
Gender in Massillon
Massillon is 50.2% female with 16,157 female residents.
Massillon is 49.8% male with 16,019 male residents.
| Gender | Massillon | OH | USA |
|---|---|---|---|
| Female | 50.2% | 50.7% | 50.5% |
| Male | 49.8% | 49.3% | 49.5% |
Highest level of educational attainment in Massillon for adults over 25
2.0% of adults in Massillon completed < 9th grade.
6.0% of adults in Massillon completed 9-12th grade.
43.0% of adults in Massillon completed high school / ged.
23.0% of adults in Massillon completed some college.
10.0% of adults in Massillon completed associate's degree.
11.0% of adults in Massillon completed bachelor's degree.
4.0% of adults in Massillon completed master's degree.
1.0% of adults in Massillon completed professional degree.
0.0% of adults in Massillon completed doctorate degree.
| Education | Massillon | OH | USA |
|---|---|---|---|
| < 9th Grade | 2.0% | 3.0% | 5.0% |
| 9-12th Grade | 6.0% | 6.0% | 6.0% |
| High School / GED | 43.0% | 32.0% | 26.0% |
| Some College | 23.0% | 19.0% | 19.0% |
| Associate's Degree | 10.0% | 9.0% | 9.0% |
| Bachelor's Degree | 11.0% | 19.0% | 21.0% |
| Master's Degree | 4.0% | 9.0% | 10.0% |
| Professional Degree | 1.0% | 2.0% | 2.0% |
| Doctorate Degree | 0.0% | 1.0% | 2.0% |
Household Income For Massillon, Ohio
3.9% of households in Massillon earn Less than $10,000.
5.1% of households in Massillon earn $10,000 to $14,999.
9.3% of households in Massillon earn $15,000 to $24,999.
10.5% of households in Massillon earn $25,000 to $34,999.
15.3% of households in Massillon earn $35,000 to $49,999.
20.5% of households in Massillon earn $50,000 to $74,999.
12.6% of households in Massillon earn $75,000 to $99,999.
16.2% of households in Massillon earn $100,000 to $149,999.
5.1% of households in Massillon earn $150,000 to $199,999.
1.6% of households in Massillon earn $200,000 or more.
| Income | Massillon | OH | USA |
|---|---|---|---|
| Less than $10,000 | 3.9% | 5.2% | 4.9% |
| $10,000 to $14,999 | 5.1% | 4.1% | 3.6% |
| $15,000 to $24,999 | 9.3% | 7.4% | 6.6% |
| $25,000 to $34,999 | 10.5% | 7.7% | 6.8% |
| $35,000 to $49,999 | 15.3% | 11.9% | 10.4% |
| $50,000 to $74,999 | 20.5% | 17.1% | 15.7% |
| $75,000 to $99,999 | 12.6% | 13.2% | 12.7% |
| $100,000 to $149,999 | 16.2% | 16.9% | 17.4% |
| $150,000 to $199,999 | 5.1% | 8.0% | 9.3% |
| $200,000 or more | 1.6% | 8.5% | 12.6% |


