Whitest cities in Illinois research summary. We analyzed Illinois’s most recent Census data to determine the whitest cities in Illinois based on the percentage of White residents.
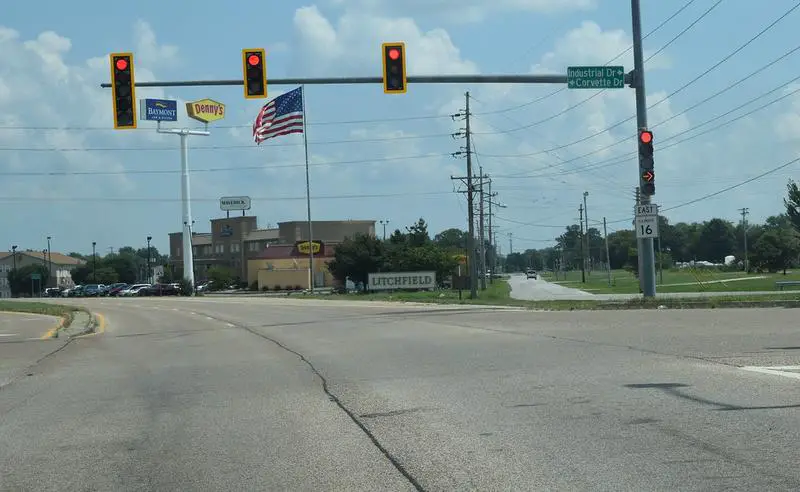
97.1% White · #1 whitest in Illinois
Litchfield is a city in Montgomery County, Illinois, United States. The population was 6,939 at the 2010 census, and 6,588 in 2009 and 7,012 in 2015. It is located in south central Illinois, south of Springfield and northeast of Metro-East.
Data | Crime | Cost of living | Movers
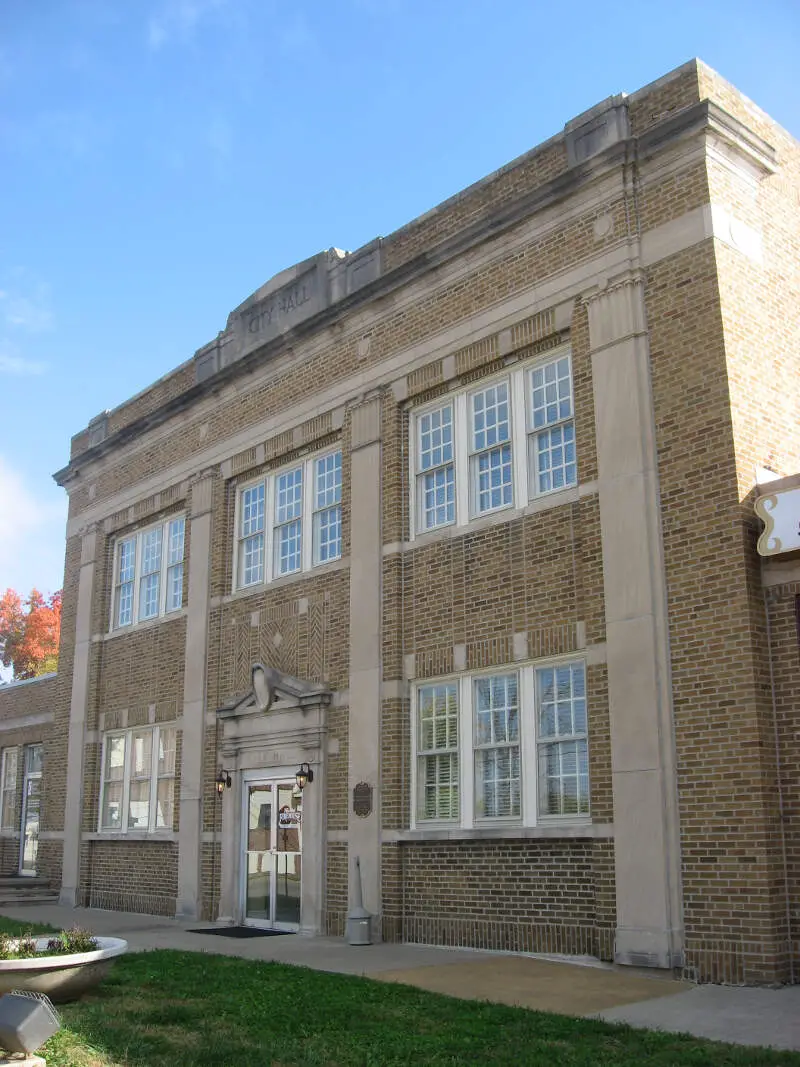
95.9% White · #2 whitest in Illinois
West Frankfort is a city in Franklin County, Illinois, United States. The population was 8,182 at the 2010 census. The city is part of the Metro Lakeland area.
Data | Crime | Cost of living | Movers
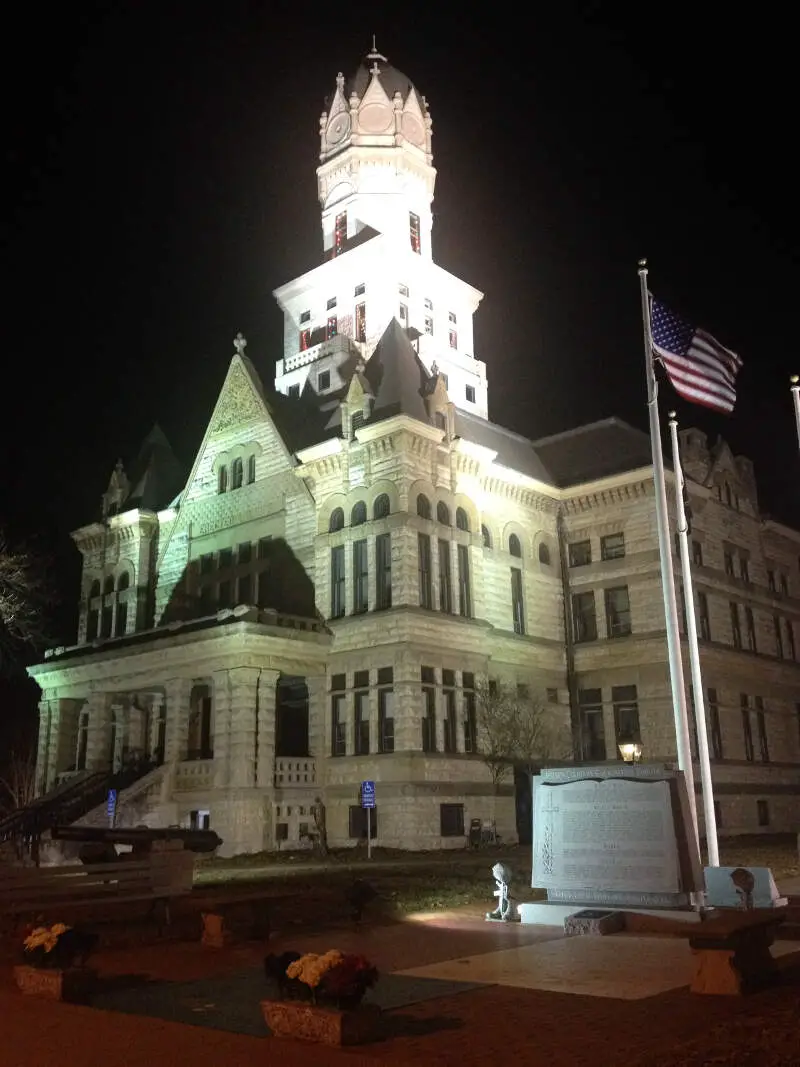
95.4% White · #3 whitest in Illinois
Jerseyville is a city in Jersey County, Illinois, United States. As of the 2010 U.S. census, the city had a total population of 8,465. It is the county seat of Jersey County, and is the largest city in the county.
Data | Crime | Cost of living | Movers
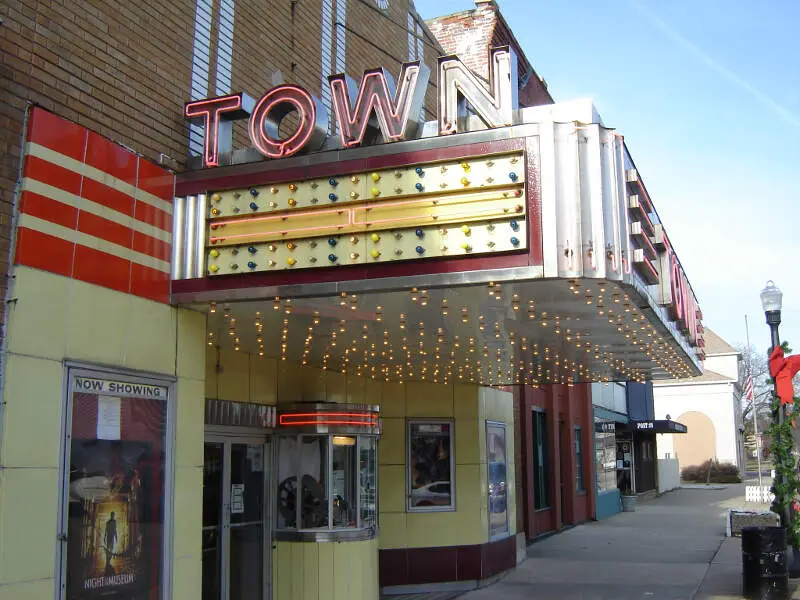
95.1% White · #4 whitest in Illinois
Chillicothe is a city on the Illinois River in Peoria County, Illinois, United States. The population was 6,097 at the 2010 census. Chillicothe is just north of the city of Peoria and is part of the Peoria Metropolitan Statistical Area.
Data | Crime | Cost of living | Movers
94.9% White · #5 whitest in Illinois
Columbia is a city in Monroe and St. Clair counties in the U.S. state of Illinois, about 12 miles south of St. Louis, Missouri. The population was 9,707 at the 2010 census.
Data | Crime | Cost of living | Movers
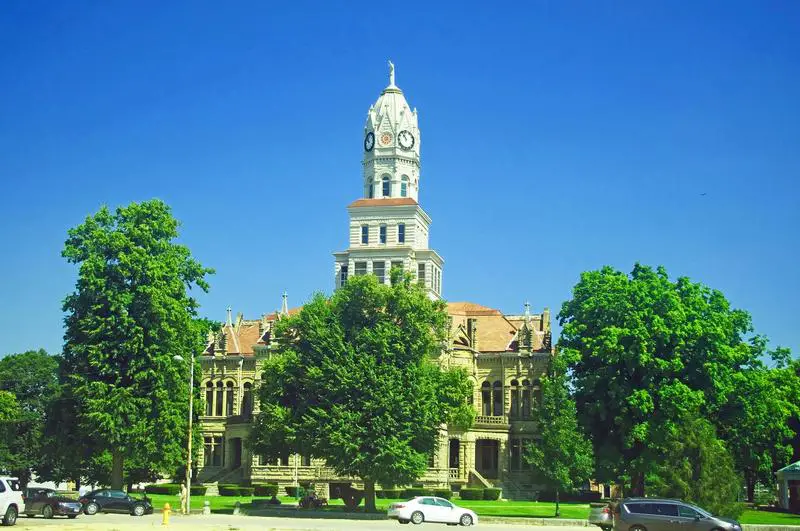
94.5% White · #6 whitest in Illinois
Monticello is a city in Piatt County, Illinois, United States. The population was 5,138 at the 2000 census, and 5,374 at a 2009 estimate. It is the county seat of Piatt County.
Data | Crime | Cost of living | Movers
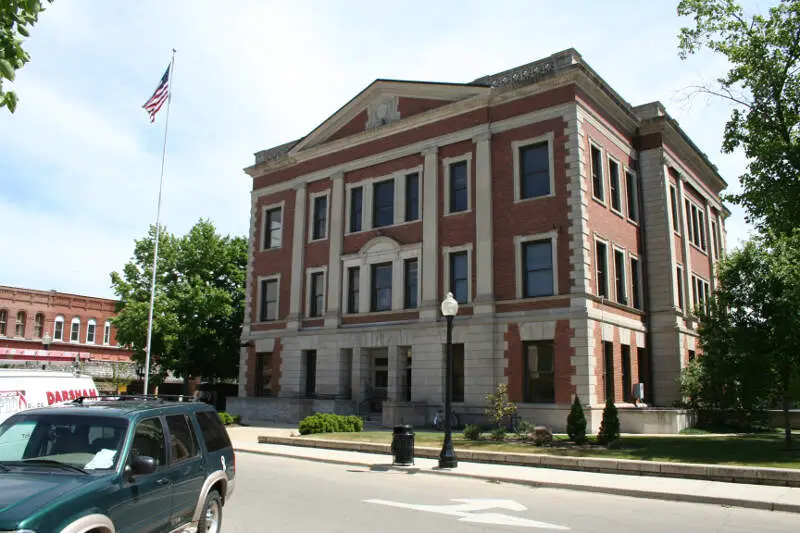
94.3% White · #7 whitest in Illinois
Paris is a city in Paris Township, Edgar County, Illinois, 165 miles south of Chicago and 90 miles west of Indianapolis. In 1900, 6,105 people lived in Paris; in 1910, 7,664; and in 1940, 9,281. The population was 8,837 at the 2010 census. It is the county seat of Edgar County.
Data | Crime | Cost of living | Movers
94.1% White · #8 whitest in Illinois
Waterloo is a city in Monroe County, Illinois, United States. The population was 9,811 at the 2010 census. It is the county seat of Monroe County.
Data | Crime | Cost of living | Movers
93.7% White · #9 whitest in Illinois
Washington is a city in Tazewell County, Illinois, United States. Washington is on U.S. Route 24 and Illinois Route 8, northeast of East Peoria. The population was 15,134 at the 2010 census, a 39.6 percent increase over 2000.
Data | Crime | Cost of living | Movers

92.4% White · #10 whitest in Illinois
Data | Crime | Cost of living | Movers
The receipts
Compare the top ten
Pick a metric. The bars rescale. The red line is Illinois’s statewide median.
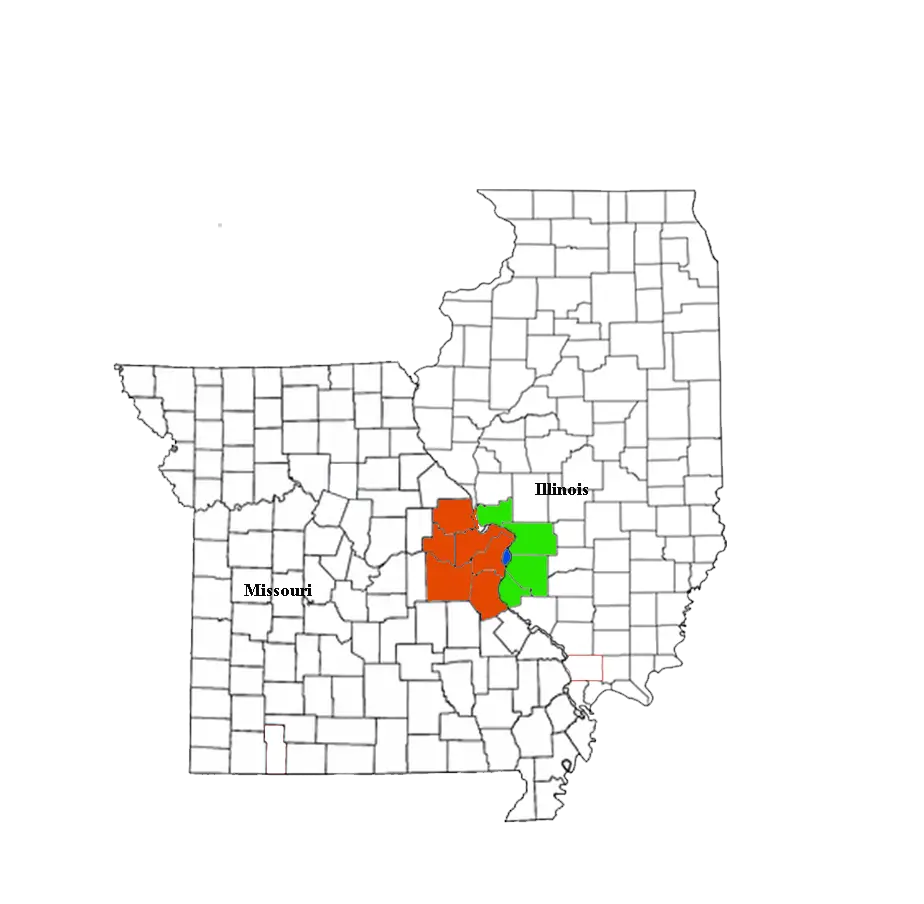
On the map
Where Illinois’s White population is concentrated
Saturday Night Science
Methodology: How we determined the whitest places in Illinois for 2026
To rank the whitest places in Illinois, we used Saturday Night Science to look at Census demographic data.
We had to look at the number of white people living in each city in Illinois on a per capita basis. In other words, the percentage of white people living in each city in Illinois.
We looked at table B03002: Hispanic OR LATINO ORIGIN BY RACE. Here are the category names as defined by the Census:
- Hispanic or Latino
- White alone*
- Black or African American alone*
- American Indian and Alaska Native alone*
- Asian alone*
- Native Hawaiian and Other Pacific Islander alone*
- Some other race alone*
- Two or more races*
Our particular column of interest here was the number of people who identified as White alone.
We limited our analysis to places with a population greater than 5,000 people. That left us with 324 cities.
We then calculated the percentage of residents that are White. The percentages ranked from 97.1% to 0.6%.
Finally, we ranked each city based on the percentage of the White population, with a higher percentage being more White. Litchfield took the distinction of being the most White, while Riverdale was the least White city.
We updated this article for 2026. This report represents our eleventh time ranking the whitest cities in Illinois.
The full plate
Cities In Illinois By White Population
Click any column to sort. Search by city name.
| Rank | City | Population | White Population | % White |
|---|---|---|---|---|
| 1 | Litchfield | 6,834 | 6,637 | 97.1% |
| 2 | West Frankfort | 7,118 | 6,825 | 95.9% |
| 3 | Jerseyville | 7,445 | 7,104 | 95.4% |
| 4 | Chillicothe | 5,900 | 5,610 | 95.1% |
| 5 | Columbia | 11,127 | 10,559 | 94.9% |
| 6 | Monticello | 6,304 | 5,958 | 94.5% |
| 7 | Paris | 8,276 | 7,806 | 94.3% |
| 8 | Waterloo | 11,129 | 10,470 | 94.1% |
| 9 | Washington | 15,919 | 14,914 | 93.7% |
| 10 | Harrisburg | 8,372 | 7,739 | 92.4% |
| 11 | Bethalto | 9,239 | 8,505 | 92.1% |
| 12 | Eureka | 5,007 | 4,609 | 92.1% |
| 13 | Mount Carmel | 6,854 | 6,300 | 91.9% |
| 14 | Morton | 16,595 | 15,244 | 91.9% |
| 15 | Pana | 5,217 | 4,786 | 91.7% |
| 16 | Olney | 8,577 | 7,867 | 91.7% |
| 17 | Effingham | 12,342 | 11,303 | 91.6% |
| 18 | Salem | 7,236 | 6,610 | 91.3% |
| 19 | Highland | 10,262 | 9,345 | 91.1% |
| 20 | East Peoria | 22,324 | 20,322 | 91.0% |
| 21 | Carlinville | 5,480 | 4,987 | 91.0% |
| 22 | Taylorville | 10,646 | 9,609 | 90.3% |
| 23 | Mount Zion | 5,660 | 5,107 | 90.2% |
| 24 | Glencoe | 8,701 | 7,844 | 90.2% |
| 25 | Carterville | 5,818 | 5,222 | 89.8% |
| 26 | Benton | 6,863 | 6,143 | 89.5% |
| 27 | Clinton | 6,985 | 6,235 | 89.3% |
| 28 | Mattoon | 16,586 | 14,789 | 89.2% |
| 29 | New Lenox | 28,006 | 24,933 | 89.0% |
| 30 | Manteno | 9,030 | 8,031 | 88.9% |
| 31 | Mokena | 20,021 | 17,805 | 88.9% |
| 32 | Troy | 11,647 | 10,355 | 88.9% |
| 33 | Pekin | 31,781 | 28,225 | 88.8% |
| 34 | Hoopeston | 5,034 | 4,460 | 88.6% |
| 35 | East Alton | 5,689 | 5,033 | 88.5% |
| 36 | Chatham | 14,639 | 12,908 | 88.2% |
| 37 | Winnetka | 12,484 | 11,005 | 88.2% |
| 38 | Western Springs | 13,446 | 11,850 | 88.1% |
| 39 | Bartonville | 5,841 | 5,143 | 88.0% |
| 40 | Godfrey | 17,712 | 15,588 | 88.0% |
| 41 | Geneseo | 6,673 | 5,868 | 87.9% |
| 42 | Lincoln | 13,281 | 11,657 | 87.8% |
| 43 | Johnsburg | 6,386 | 5,605 | 87.8% |
| 44 | Sugar Grove | 9,240 | 8,107 | 87.7% |
| 45 | Campton Hills | 10,877 | 9,515 | 87.5% |
| 46 | Palos Heights | 12,152 | 10,599 | 87.2% |
| 47 | Wood River | 10,279 | 8,898 | 86.6% |
| 48 | Princeton | 7,975 | 6,896 | 86.5% |
| 49 | Coal City | 5,317 | 4,582 | 86.2% |
| 50 | Elburn | 6,354 | 5,475 | 86.2% |
| 51 | Deerfield | 19,518 | 16,804 | 86.1% |
| 52 | Quincy | 39,109 | 33,631 | 86.0% |
| 53 | Du Quoin | 5,726 | 4,923 | 86.0% |
| 54 | Braidwood | 6,062 | 5,206 | 85.9% |
| 55 | Herrin | 12,226 | 10,493 | 85.8% |
| 56 | Peru | 9,775 | 8,389 | 85.8% |
| 57 | Maryville | 8,316 | 7,133 | 85.8% |
| 58 | Marengo | 7,040 | 6,007 | 85.3% |
| 59 | Northfield | 5,487 | 4,678 | 85.3% |
| 60 | Canton | 13,144 | 11,202 | 85.2% |
| 61 | Robinson | 7,084 | 5,994 | 84.6% |
| 62 | Lemont | 17,820 | 15,068 | 84.6% |
| 63 | Marion | 16,836 | 14,225 | 84.5% |
| 64 | Edwardsville | 26,474 | 22,359 | 84.5% |
| 65 | Lockport | 26,409 | 22,296 | 84.4% |
| 66 | Homer Glen | 24,529 | 20,650 | 84.2% |
| 67 | Peoria Heights | 5,825 | 4,903 | 84.2% |
| 68 | Wilmington | 5,494 | 4,613 | 84.0% |
| 69 | Lake Bluff | 6,041 | 5,054 | 83.7% |
| 70 | Geneva | 21,258 | 17,749 | 83.5% |
| 71 | Spring Grove | 5,917 | 4,935 | 83.4% |
| 72 | Morris | 14,898 | 12,356 | 82.9% |
| 73 | Charleston | 17,062 | 14,109 | 82.7% |
| 74 | Ottawa | 18,447 | 15,229 | 82.6% |
| 75 | Park Ridge | 38,667 | 31,804 | 82.3% |
| 76 | Barrington | 11,077 | 9,065 | 81.8% |
| 77 | Batavia | 27,151 | 22,218 | 81.8% |
| 78 | Glen Carbon | 13,977 | 11,431 | 81.8% |
| 79 | Willow Springs | 5,868 | 4,799 | 81.8% |
| 80 | Pontiac | 11,294 | 9,235 | 81.8% |
| 81 | Milan | 5,034 | 4,115 | 81.7% |
| 82 | Mahomet | 10,049 | 8,204 | 81.6% |
| 83 | Metropolis | 5,864 | 4,785 | 81.6% |
| 84 | Jacksonville | 18,014 | 14,676 | 81.5% |
| 85 | Sandwich | 7,219 | 5,848 | 81.0% |
| 86 | Downers Grove | 50,054 | 40,493 | 80.9% |
| 87 | Sycamore | 18,559 | 15,004 | 80.8% |
| 88 | Highland Park | 30,398 | 24,559 | 80.8% |
| 89 | Roscoe | 10,706 | 8,638 | 80.7% |
| 90 | Libertyville | 20,525 | 16,554 | 80.7% |
| 91 | Centralia | 11,856 | 9,562 | 80.7% |
| 92 | Lake Zurich | 19,832 | 15,988 | 80.6% |
| 93 | Greenville | 7,235 | 5,830 | 80.6% |
| 94 | Lake Forest | 19,416 | 15,577 | 80.2% |
| 95 | Rockton | 7,974 | 6,396 | 80.2% |
| 96 | Machesney Park | 22,630 | 18,145 | 80.2% |
| 97 | Manhattan | 11,026 | 8,826 | 80.0% |
| 98 | Channahon | 13,927 | 11,103 | 79.7% |
| 99 | Palos Hills | 18,081 | 14,340 | 79.3% |
| 100 | Cary | 17,923 | 14,191 | 79.2% |
Source: U.S. Census ACS 2020-2024. 324 cities with more than 5,000 residents.
Summary
Summary: White Populations Across Illinois
We measured the locations with the highest percentage of white people in Illinois. According to the most recent data, this list provides accurate information on the whitest places in Illinois.
The most White cities in Illinois are Litchfield, West Frankfort, Jerseyville, Chillicothe, Columbia, Monticello, Paris, Waterloo, Washington, and Harrisburg. Not sold on Illinois? Take the two-minute Find Your Place quiz and see which state actually fits you.
Questions and answers
Whitest Cities In Illinois FAQs
What is the whitest city in Illinois?
Litchfield is the whitest city in Illinois for 2026, with White residents making up 97.1% of the population. West Frankfort and Jerseyville are next.
What are the 10 whitest cities in Illinois?
The ten whitest cities in Illinois are Litchfield, West Frankfort, Jerseyville, Chillicothe, Columbia, Monticello, Paris, Waterloo, Washington, and Harrisburg. We ranked all 324 places with more than 5,000 residents by their White share of the population.
What percent of Litchfield is White?
White residents make up 97.1% of Litchfield, the highest share of the 324 Illinois places we measured. The numbers come from the Census Bureau’s American Community Survey.
What is the least White city in Illinois?
Riverdale is the least White city in Illinois, at 0.6% White residents. It sits at the opposite end of the same ranking.
Where does this data come from?
Every share is calculated from the Census Bureau’s American Community Survey (2020-2024), based on residents identifying as White alone. We rank each Illinois place with more than 5,000 residents.


