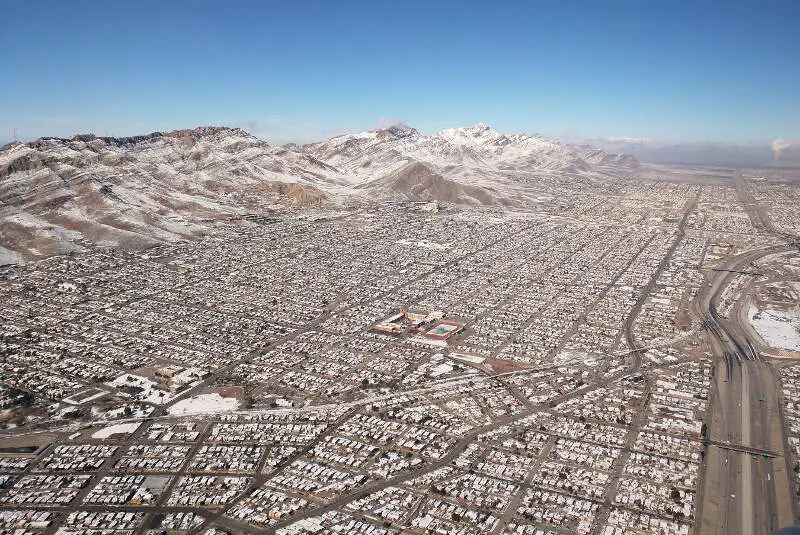
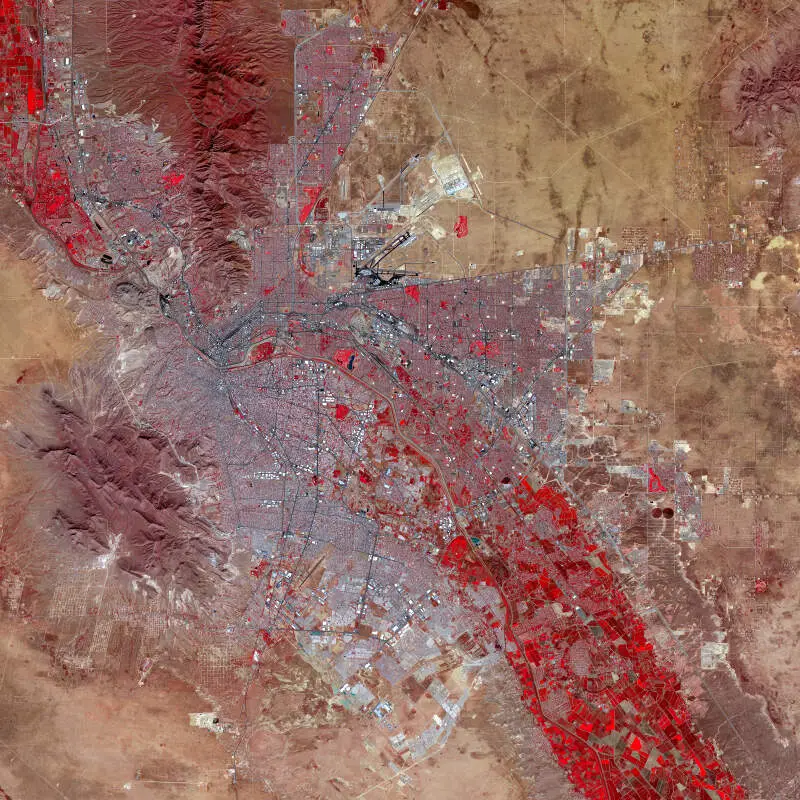
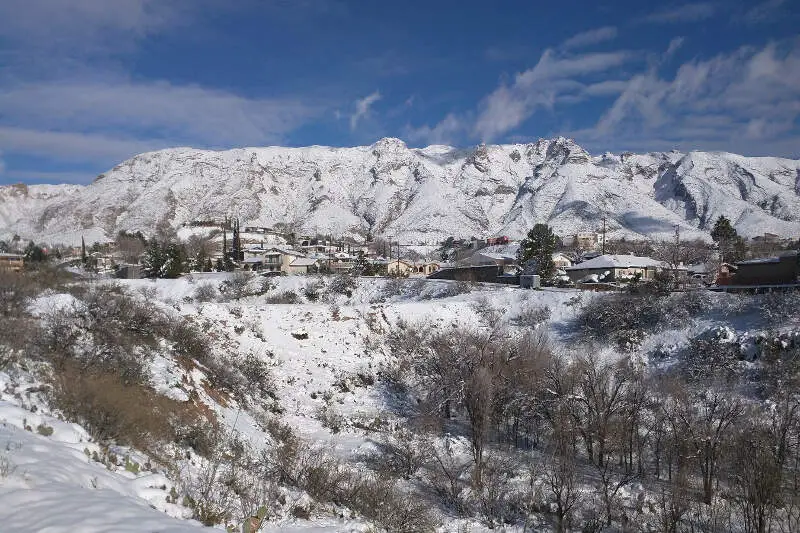
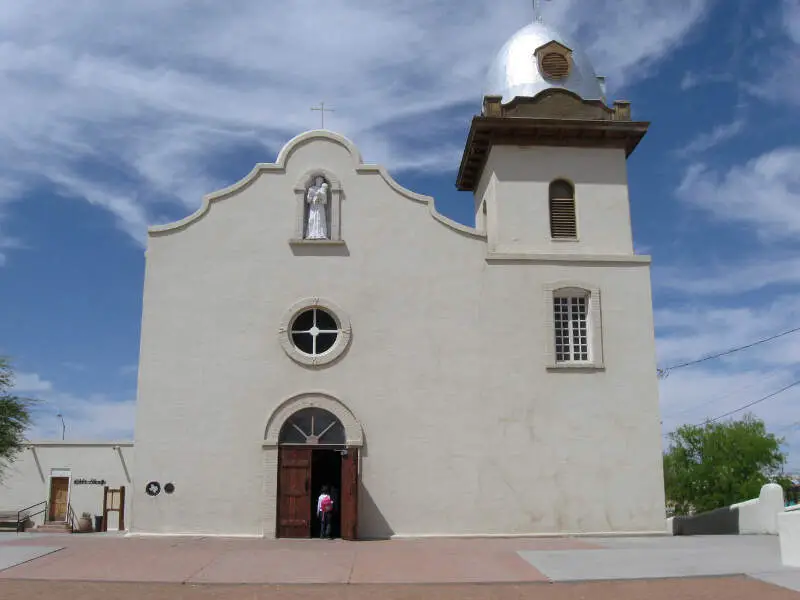
El Paso, TX
Demographics And Statistics
Living In El Paso, Texas Summary
Life in El Paso research summary. HomeSnacks has been using Saturday Night Science to research the quality of life in El Paso over the past nine years using Census, FBI, Zillow, and other primary data sources. Based on the most recently available data, we found the following about life in El Paso:
The population in El Paso is 678,147.
The median home value in El Paso is $229,134.
The median income in El Paso is $58,734.
The cost of living in El Paso is 90 which is 0.9x lower than the national average.
The median rent in El Paso is $1,041.
The unemployment rate in El Paso is 6.2%.
The poverty rate in El Paso is 18.4%.
The average high in El Paso is 78.1° and the average low is 49.7°.
El Paso SnackAbility
Overall SnackAbility
El Paso, TX Crime Report
Crime in El Paso summary. We use data from the FBI to determine the crime rates in El Paso. Key points include:
There were 12,032 total crimes in El Paso in the last reporting year.
The overall crime rate per 100,000 people in El Paso is 1,772.4 / 100k people.
The violent crime rate per 100,000 people in El Paso is 278.4 / 100k people.
The property crime rate per 100,000 people in El Paso is 1,494.0 / 100k people.
Overall, crime in El Paso is -16.37% below the national average.
Total Crimes
Below National Average
Crime In El Paso Comparison Table
| Statistic | Count Raw |
El Paso / 100k People |
Texas / 100k People |
National / 100k People |
|---|---|---|---|---|
| Total Crimes Per 100K | 12,032 | 1,772.4 | 2,429.9 | 2,119.2 |
| Violent Crime | 1,890 | 278.4 | 389.4 | 359.0 |
| Murder | 20 | 2.9 | 5.2 | 5.0 |
| Robbery | 252 | 37.1 | 63.5 | 61.0 |
| Aggravated Assault | 1,614 | 237.8 | 270.7 | 256.0 |
| Property Crime | 10,142 | 1,494.0 | 2,040.5 | 1,760.0 |
| Burglary | 952 | 140.2 | 284.3 | 229.0 |
| Larceny | 7,280 | 1,072.4 | 1,425.6 | 1,272.0 |
| Car Theft | 1,910 | 281.4 | 330.7 | 259.0 |
El Paso, TX Cost Of Living
Cost of living in El Paso summary. We use data on the cost of living to determine how expensive it is to live in El Paso. Real estate prices drive most of the variance in cost of living around Texas. Key points include:
The cost of living in El Paso is 90 with 100 being average.
The cost of living in El Paso is 0.9x lower than the national average.
The median home value in El Paso is $229,134.
The median income in El Paso is $58,734.
El Paso's Overall Cost Of Living
Lower Than The National Average
Cost Of Living In El Paso Comparison Table
| Living Expense | El Paso | Texas | National Average | |
|---|---|---|---|---|
| Overall | 90 | 92 | 100 | |
| Services | 95 | 97 | 100 | |
| Groceries | 96 | 97 | 100 | |
| Health | 89 | 93 | 100 | |
| Housing | 75 | 82 | 100 | |
| Transportation | 104 | 94 | 100 | |
| Utilities | 89 | 104 | 100 | |
El Paso, TX Weather
The average high in El Paso is 78.1° and the average low is 49.7°.
There are 23.2 days of precipitation each year.
Expect an average of 9.9 inches of precipitation each year with 6.7 inches of snow.
| Stat | El Paso |
|---|---|
| Average Annual High | 78.1 |
| Average Annual Low | 49.7 |
| Annual Precipitation Days | 23.2 |
| Average Annual Precipitation | 9.9 |
| Average Annual Snowfall | 6.7 |
Average High
Days of Rain
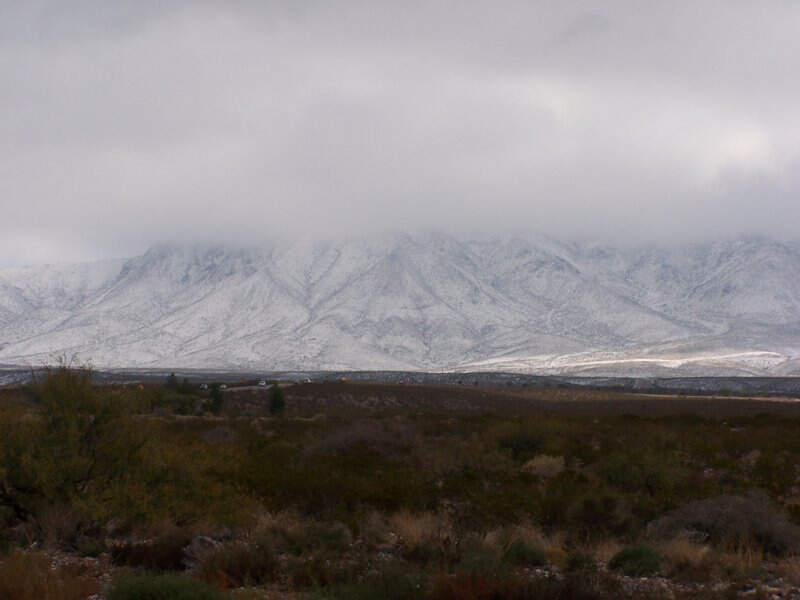
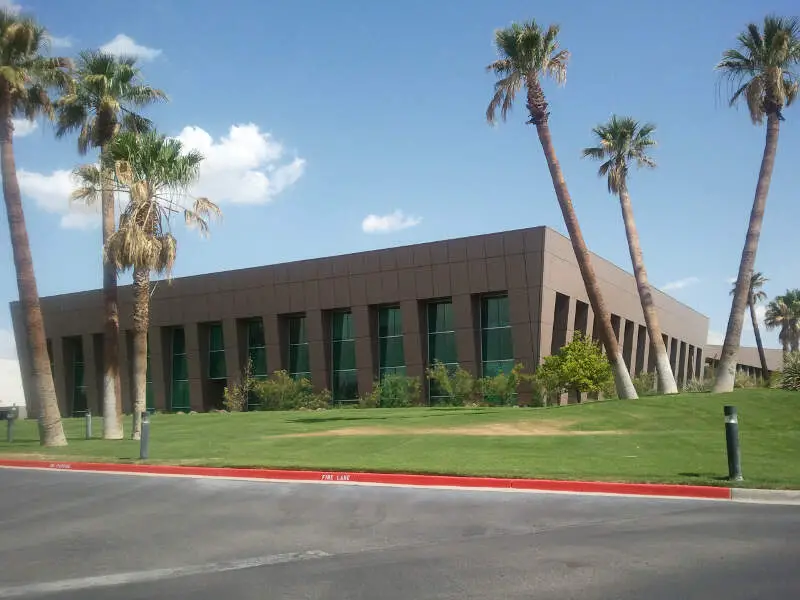
El Paso, TX Photos


2 Reviews & Comments About El Paso
/5

John Calaway - None
I don't mean to deliberately bash El Paso but I missed walking barefoot in green grass not on hot sidewalks or sand.
I lived in El Paso in 1980 to 1991 and again about 10 years later. I worked for GTE Sylvania for minimum wage. It took me about 6 months to get this job. I eventually was able to get to Houston. I remember quitting GTE and walking home and telling my wife that I quit my job and that we were getting the h**l out of that city.
I never saw an expression of such joy on her face. I later moved there again and could not find a job.
The job market there sucked. I had several friends there. There was not much to do out there. The last time I was there they had some concert event at a man made lake out in the middle of the desert. There were no trees just gusty wind and grainy sand.
I went into Cuidad Juarez one time and that was enough for me. Downtown El Paso near the 5 Points was dirty and nasty. I never went in that district again either. I had hard distinguishing if I was in America or Mexico.
I was able to determine that by seeing the American flag and that El Paso was cleaner. I remember driving down I 10 and seeing the Colonias and felt for the people of Mexico.
DOMINIC ARENAS - None
I live in El Paso m8 and I love it here
El Paso Articles

Rankings for El Paso in Texas


Locations Around El Paso
Map Of El Paso, TX
Best Places Around El Paso
Socorro, TX
Population 36,237
Sunland Park, NM
Population 17,085
Santa Teresa, NM
Population 5,973
Anthony, NM
Population 8,701
Chaparral, NM
Population 16,642
El Paso Demographics And Statistics
Population over time in El Paso
The current population in El Paso is 678,147. The population has increased 7.8% from 2010.
| Year | Population | % Change |
|---|---|---|
| 2023 | 678,147 | 0.1% |
| 2022 | 677,181 | 0.1% |
| 2021 | 676,395 | -0.5% |
| 2020 | 679,879 | 0.0% |
| 2019 | 679,813 | -0.1% |
| 2018 | 680,354 | 0.3% |
| 2017 | 678,266 | 0.0% |
| 2016 | 678,058 | 0.3% |
| 2015 | 676,325 | 1.0% |
| 2014 | 669,771 | 1.4% |
| 2013 | 660,795 | 1.5% |
| 2012 | 650,778 | 1.7% |
| 2011 | 640,066 | 1.8% |
| 2010 | 628,923 | - |
Race / Ethnicity in El Paso
El Paso is:
12.2% White with 82,413 White residents.
3.1% African American with 21,322 African American residents.
0.2% American Indian with 1,695 American Indian residents.
1.3% Asian with 8,979 Asian residents.
0.2% Hawaiian with 1,172 Hawaiian residents.
0.2% Other with 1,544 Other residents.
1.4% Two Or More with 9,483 Two Or More residents.
81.3% Hispanic with 551,539 Hispanic residents.
| Race | El Paso | TX | USA |
|---|---|---|---|
| White | 12.2% | 39.9% | 58.2% |
| African American | 3.1% | 11.9% | 12.0% |
| American Indian | 0.2% | 0.2% | 0.5% |
| Asian | 1.3% | 5.3% | 5.7% |
| Hawaiian | 0.2% | 0.1% | 0.2% |
| Other | 0.2% | 0.4% | 0.5% |
| Two Or More | 1.4% | 2.9% | 3.9% |
| Hispanic | 81.3% | 39.5% | 19.0% |
Gender in El Paso
El Paso is 50.8% female with 344,345 female residents.
El Paso is 49.2% male with 333,802 male residents.
| Gender | El Paso | TX | USA |
|---|---|---|---|
| Female | 50.8% | 50.1% | 50.5% |
| Male | 49.2% | 49.9% | 49.5% |
Highest level of educational attainment in El Paso for adults over 25
11.0% of adults in El Paso completed < 9th grade.
8.0% of adults in El Paso completed 9-12th grade.
24.0% of adults in El Paso completed high school / ged.
21.0% of adults in El Paso completed some college.
9.0% of adults in El Paso completed associate's degree.
18.0% of adults in El Paso completed bachelor's degree.
7.0% of adults in El Paso completed master's degree.
1.0% of adults in El Paso completed professional degree.
1.0% of adults in El Paso completed doctorate degree.
| Education | El Paso | TX | USA |
|---|---|---|---|
| < 9th Grade | 11.0% | 7.0% | 5.0% |
| 9-12th Grade | 8.0% | 7.0% | 6.0% |
| High School / GED | 24.0% | 24.0% | 26.0% |
| Some College | 21.0% | 21.0% | 19.0% |
| Associate's Degree | 9.0% | 8.0% | 9.0% |
| Bachelor's Degree | 18.0% | 21.0% | 21.0% |
| Master's Degree | 7.0% | 9.0% | 10.0% |
| Professional Degree | 1.0% | 2.0% | 2.0% |
| Doctorate Degree | 1.0% | 1.0% | 2.0% |
Household Income For El Paso, Texas
7.4% of households in El Paso earn Less than $10,000.
5.5% of households in El Paso earn $10,000 to $14,999.
9.1% of households in El Paso earn $15,000 to $24,999.
8.9% of households in El Paso earn $25,000 to $34,999.
12.8% of households in El Paso earn $35,000 to $49,999.
18.2% of households in El Paso earn $50,000 to $74,999.
12.6% of households in El Paso earn $75,000 to $99,999.
14.2% of households in El Paso earn $100,000 to $149,999.
6.1% of households in El Paso earn $150,000 to $199,999.
5.4% of households in El Paso earn $200,000 or more.
| Income | El Paso | TX | USA |
|---|---|---|---|
| Less than $10,000 | 7.4% | 5.0% | 4.9% |
| $10,000 to $14,999 | 5.5% | 3.4% | 3.6% |
| $15,000 to $24,999 | 9.1% | 6.5% | 6.6% |
| $25,000 to $34,999 | 8.9% | 7.0% | 6.8% |
| $35,000 to $49,999 | 12.8% | 10.9% | 10.4% |
| $50,000 to $74,999 | 18.2% | 16.4% | 15.7% |
| $75,000 to $99,999 | 12.6% | 12.8% | 12.7% |
| $100,000 to $149,999 | 14.2% | 17.2% | 17.4% |
| $150,000 to $199,999 | 6.1% | 9.1% | 9.3% |
| $200,000 or more | 5.4% | 11.7% | 12.6% |


