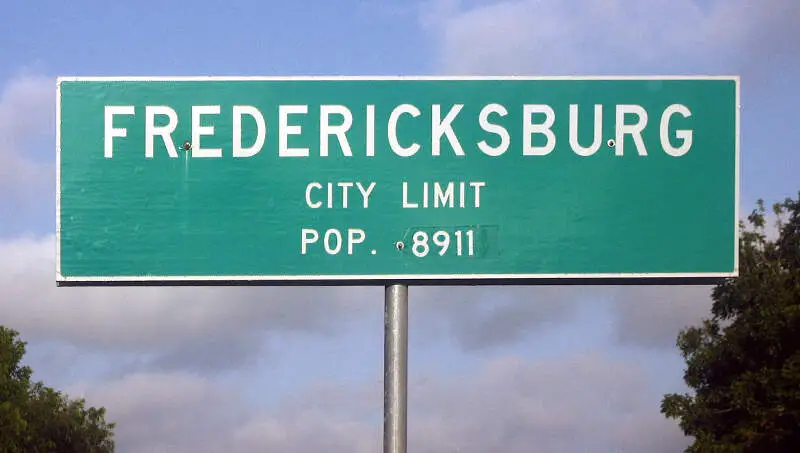
Fredericksburg, TX
Demographics And Statistics
Living In Fredericksburg, Texas Summary
Life in Fredericksburg research summary. HomeSnacks has been using Saturday Night Science to research the quality of life in Fredericksburg over the past nine years using Census, FBI, Zillow, and other primary data sources. Based on the most recently available data, we found the following about life in Fredericksburg:
The population in Fredericksburg is 11,254.
The median home value in Fredericksburg is $513,155.
The median income in Fredericksburg is $57,474.
The cost of living in Fredericksburg is 113 which is 1.1x higher than the national average.
The median rent in Fredericksburg is $1,364.
The unemployment rate in Fredericksburg is 4.6%.
The poverty rate in Fredericksburg is 10.0%.
The average high in Fredericksburg is 77.1° and the average low is 53.4°.
Fredericksburg SnackAbility
Overall SnackAbility
Fredericksburg, TX Crime Report
Crime in Fredericksburg summary. We use data from the FBI to determine the crime rates in Fredericksburg. Key points include:
There were 75 total crimes in Fredericksburg in the last reporting year.
The overall crime rate per 100,000 people in Fredericksburg is 639.9 / 100k people.
The violent crime rate per 100,000 people in Fredericksburg is 85.3 / 100k people.
The property crime rate per 100,000 people in Fredericksburg is 554.6 / 100k people.
Overall, crime in Fredericksburg is -69.81% below the national average.
Total Crimes
Below National Average
Crime In Fredericksburg Comparison Table
| Statistic | Count Raw |
Fredericksburg / 100k People |
Texas / 100k People |
National / 100k People |
|---|---|---|---|---|
| Total Crimes Per 100K | 75 | 639.9 | 2,429.9 | 2,119.2 |
| Violent Crime | 10 | 85.3 | 389.4 | 359.0 |
| Murder | 0 | 0.0 | 5.2 | 5.0 |
| Robbery | 0 | 0.0 | 63.5 | 61.0 |
| Aggravated Assault | 9 | 76.8 | 270.7 | 256.0 |
| Property Crime | 65 | 554.6 | 2,040.5 | 1,760.0 |
| Burglary | 12 | 102.4 | 284.3 | 229.0 |
| Larceny | 45 | 383.9 | 1,425.6 | 1,272.0 |
| Car Theft | 8 | 68.3 | 330.7 | 259.0 |
Fredericksburg, TX Cost Of Living
Cost of living in Fredericksburg summary. We use data on the cost of living to determine how expensive it is to live in Fredericksburg. Real estate prices drive most of the variance in cost of living around Texas. Key points include:
The cost of living in Fredericksburg is 113 with 100 being average.
The cost of living in Fredericksburg is 1.1x higher than the national average.
The median home value in Fredericksburg is $513,155.
The median income in Fredericksburg is $57,474.
Fredericksburg's Overall Cost Of Living
Higher Than The National Average
Cost Of Living In Fredericksburg Comparison Table
| Living Expense | Fredericksburg | Texas | National Average | |
|---|---|---|---|---|
| Overall | 113 | 92 | 100 | |
| Services | 100 | 97 | 100 | |
| Groceries | 96 | 97 | 100 | |
| Health | 104 | 93 | 100 | |
| Housing | 147 | 82 | 100 | |
| Transportation | 94 | 94 | 100 | |
| Utilities | 83 | 104 | 100 | |
Fredericksburg, TX Weather
The average high in Fredericksburg is 77.1° and the average low is 53.4°.
There are 47.0 days of precipitation each year.
Expect an average of 30.9 inches of precipitation each year with 0.5 inches of snow.
| Stat | Fredericksburg |
|---|---|
| Average Annual High | 77.1 |
| Average Annual Low | 53.4 |
| Annual Precipitation Days | 47.0 |
| Average Annual Precipitation | 30.9 |
| Average Annual Snowfall | 0.5 |
Average High
Days of Rain
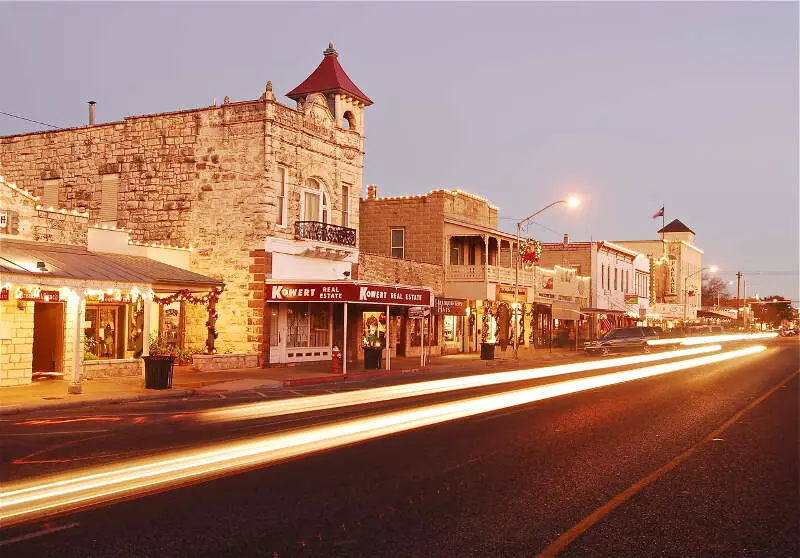
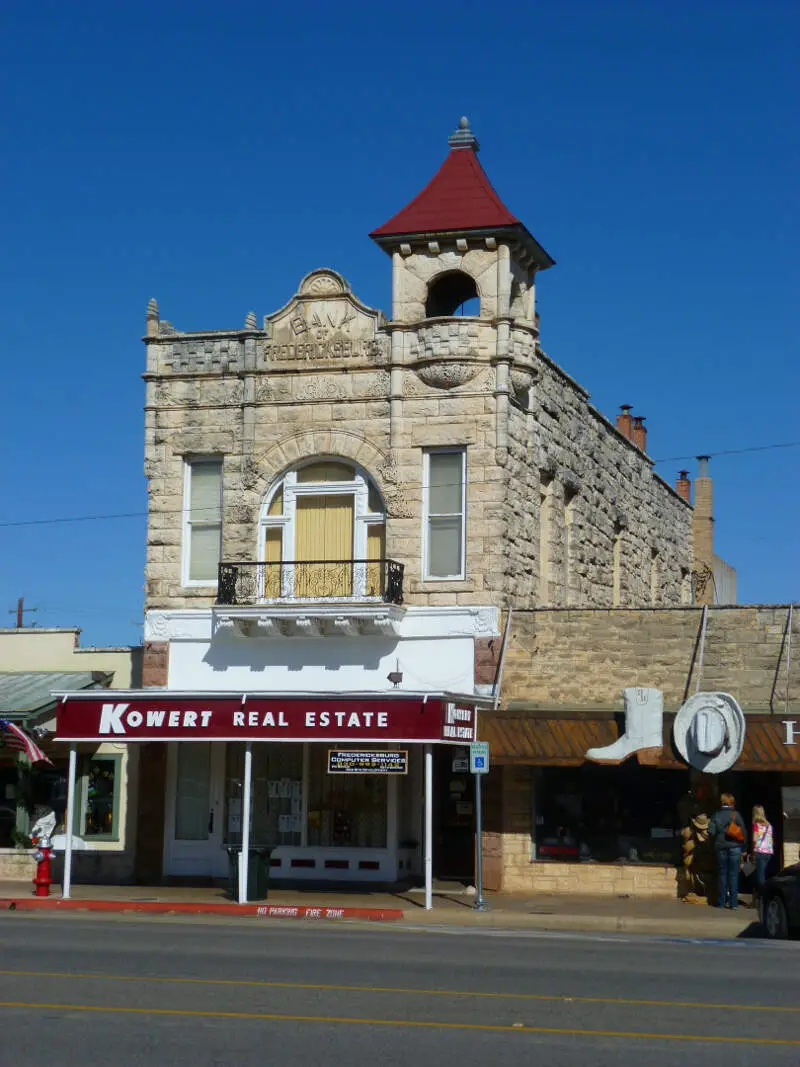
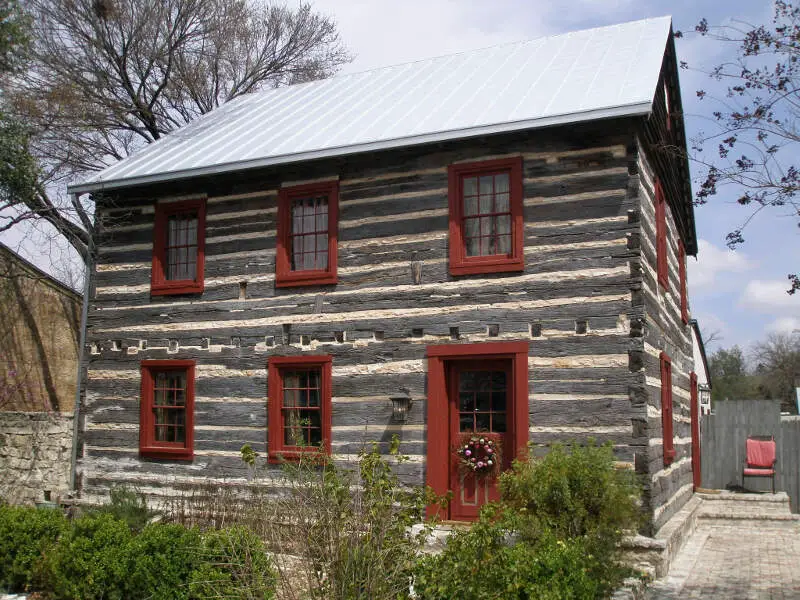
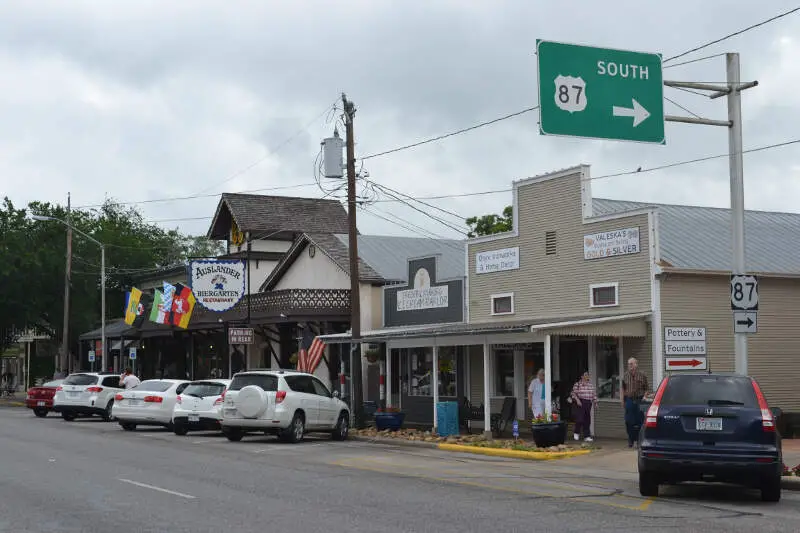
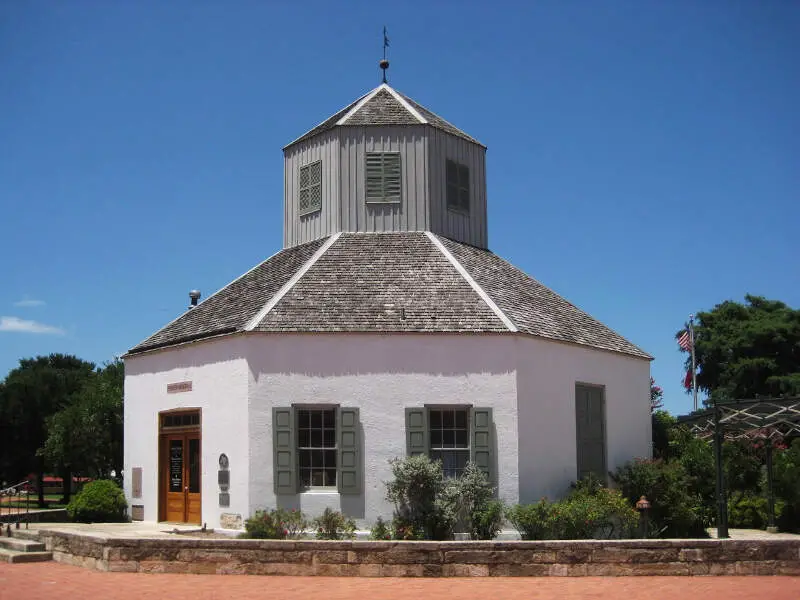
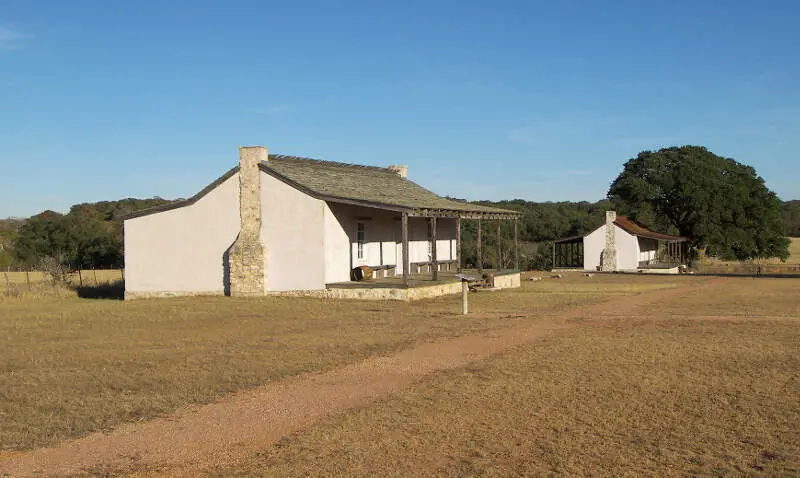
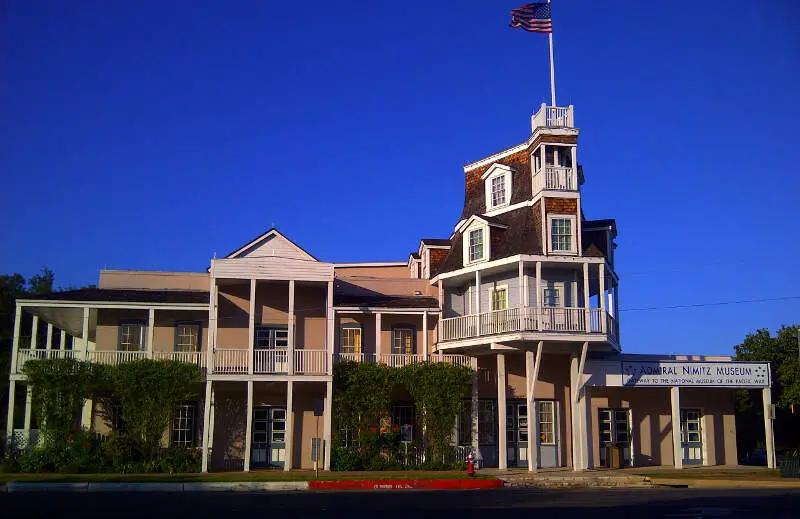
Fredericksburg, TX Photos

Rankings for Fredericksburg in Texas


Locations Around Fredericksburg
Map Of Fredericksburg, TX
Best Places Around Fredericksburg
Howland Center, OH
Population 6,564
North Madison, OH
Population 8,309
Cortland, OH
Population 7,091
Champion Heights, OH
Population 6,299
Austintown, OH
Population 30,215
Hubbard, OH
Population 7,600
Struthers, OH
Population 9,995
Northwest Harborcreek, PA
Population 8,908
Campbell, OH
Population 7,812
Fredericksburg Demographics And Statistics
Population over time in Fredericksburg
The current population in Fredericksburg is 11,254. The population has increased 8.6% from 2010.
| Year | Population | % Change |
|---|---|---|
| 2023 | 11,254 | 2.1% |
| 2022 | 11,020 | 1.4% |
| 2021 | 10,864 | -4.2% |
| 2020 | 11,341 | 0.9% |
| 2019 | 11,245 | 0.8% |
| 2018 | 11,157 | 1.0% |
| 2017 | 11,046 | 0.4% |
| 2016 | 10,997 | 1.6% |
| 2015 | 10,826 | 1.1% |
| 2014 | 10,707 | 0.5% |
| 2013 | 10,649 | 0.9% |
| 2012 | 10,556 | 1.0% |
| 2011 | 10,455 | 0.9% |
| 2010 | 10,363 | - |
Race / Ethnicity in Fredericksburg
Fredericksburg is:
78.5% White with 8,835 White residents.
0.4% African American with 48 African American residents.
0.1% American Indian with 9 American Indian residents.
0.3% Asian with 29 Asian residents.
0.7% Hawaiian with 77 Hawaiian residents.
0.2% Other with 25 Other residents.
0.9% Two Or More with 101 Two Or More residents.
18.9% Hispanic with 2,130 Hispanic residents.
| Race | Fredericksburg | TX | USA |
|---|---|---|---|
| White | 78.5% | 39.9% | 58.2% |
| African American | 0.4% | 11.9% | 12.0% |
| American Indian | 0.1% | 0.2% | 0.5% |
| Asian | 0.3% | 5.3% | 5.7% |
| Hawaiian | 0.7% | 0.1% | 0.2% |
| Other | 0.2% | 0.4% | 0.5% |
| Two Or More | 0.9% | 2.9% | 3.9% |
| Hispanic | 18.9% | 39.5% | 19.0% |
Gender in Fredericksburg
Fredericksburg is 53.5% female with 6,019 female residents.
Fredericksburg is 46.5% male with 5,235 male residents.
| Gender | Fredericksburg | TX | USA |
|---|---|---|---|
| Female | 53.5% | 50.1% | 50.5% |
| Male | 46.5% | 49.9% | 49.5% |
Highest level of educational attainment in Fredericksburg for adults over 25
6.0% of adults in Fredericksburg completed < 9th grade.
3.0% of adults in Fredericksburg completed 9-12th grade.
22.0% of adults in Fredericksburg completed high school / ged.
23.0% of adults in Fredericksburg completed some college.
6.0% of adults in Fredericksburg completed associate's degree.
25.0% of adults in Fredericksburg completed bachelor's degree.
11.0% of adults in Fredericksburg completed master's degree.
3.0% of adults in Fredericksburg completed professional degree.
1.0% of adults in Fredericksburg completed doctorate degree.
| Education | Fredericksburg | TX | USA |
|---|---|---|---|
| < 9th Grade | 6.0% | 7.0% | 5.0% |
| 9-12th Grade | 3.0% | 7.0% | 6.0% |
| High School / GED | 22.0% | 24.0% | 26.0% |
| Some College | 23.0% | 21.0% | 19.0% |
| Associate's Degree | 6.0% | 8.0% | 9.0% |
| Bachelor's Degree | 25.0% | 21.0% | 21.0% |
| Master's Degree | 11.0% | 9.0% | 10.0% |
| Professional Degree | 3.0% | 2.0% | 2.0% |
| Doctorate Degree | 1.0% | 1.0% | 2.0% |
Household Income For Fredericksburg, Texas
4.9% of households in Fredericksburg earn Less than $10,000.
4.8% of households in Fredericksburg earn $10,000 to $14,999.
8.1% of households in Fredericksburg earn $15,000 to $24,999.
10.1% of households in Fredericksburg earn $25,000 to $34,999.
15.5% of households in Fredericksburg earn $35,000 to $49,999.
19.7% of households in Fredericksburg earn $50,000 to $74,999.
11.6% of households in Fredericksburg earn $75,000 to $99,999.
12.5% of households in Fredericksburg earn $100,000 to $149,999.
5.9% of households in Fredericksburg earn $150,000 to $199,999.
6.8% of households in Fredericksburg earn $200,000 or more.
| Income | Fredericksburg | TX | USA |
|---|---|---|---|
| Less than $10,000 | 4.9% | 5.0% | 4.9% |
| $10,000 to $14,999 | 4.8% | 3.4% | 3.6% |
| $15,000 to $24,999 | 8.1% | 6.5% | 6.6% |
| $25,000 to $34,999 | 10.1% | 7.0% | 6.8% |
| $35,000 to $49,999 | 15.5% | 10.9% | 10.4% |
| $50,000 to $74,999 | 19.7% | 16.4% | 15.7% |
| $75,000 to $99,999 | 11.6% | 12.8% | 12.7% |
| $100,000 to $149,999 | 12.5% | 17.2% | 17.4% |
| $150,000 to $199,999 | 5.9% | 9.1% | 9.3% |
| $200,000 or more | 6.8% | 11.7% | 12.6% |


