Compare Houston to…
Houston SnackAbility
Overall SnackAbility
Crime in Houston summary. We use data from the FBI to determine the crime rates in Houston. Key points include:
There were 126,200 total crimes in Houston in the last reporting year.
The overall crime rate per 100,000 people in Houston is 5,441.6 / 100k people.
The violent crime rate per 100,000 people in Houston is 1,148.2 / 100k people.
The property crime rate per 100,000 people in Houston is 4,293.5 / 100k people.
Overall, crime in Houston is 156.77% above the national average.
Total Crimes
Above National Average
Crime In Houston Comparison Table
| Statistic | Count Raw |
Houston / 100k People |
Texas / 100k People |
National / 100k People |
|---|---|---|---|---|
| Total Crimes Per 100K | 126,200 | 5,441.6 | 2,429.9 | 2,119.2 |
| Violent Crime | 26,628 | 1,148.2 | 389.4 | 359.0 |
| Murder | 320 | 13.8 | 5.2 | 5.0 |
| Robbery | 6,355 | 274.0 | 63.5 | 61.0 |
| Aggravated Assault | 18,260 | 787.4 | 270.7 | 256.0 |
| Property Crime | 99,572 | 4,293.5 | 2,040.5 | 1,760.0 |
| Burglary | 14,953 | 644.8 | 284.3 | 229.0 |
| Larceny | 68,315 | 2,945.7 | 1,425.6 | 1,272.0 |
| Car Theft | 16,304 | 703.0 | 330.7 | 259.0 |
Source: FBI Uniform Crime Reporting (2024)
Cost of living in Houston summary. We use data on the cost of living to determine how expensive it is to live in Houston. Real estate prices drive most of the variance in cost of living around Texas. Key points include:
The cost of living in Houston is 104 with 100 being average.
The cost of living in Houston is 1.0x higher than the national average.
The median home value in Houston is $264,336.
The median income in Houston is $64,813.
Houston's Overall Cost Of Living
Higher Than The National Average
Cost Of Living In Houston Comparison Table
| Living Expense | Houston | Texas | National Average |
|---|---|---|---|
| Overall | 104 | 93 | 100 |
| Services | 104 | 100 | 100 |
| Groceries | 98 | 99 | 100 |
| Health | 106 | 81 | 100 |
| Housing | 102 | 97 | 100 |
| Transportation | 104 | 103 | 100 |
| Utilities | 98 | 100 | 100 |
Source: Cost of living index, normalized to US average = 100
Houston, TX Weather
The average high in Houston is 78.8° and the average low is 60.5°.
There are 64.6 days of precipitation each year.
Expect an average of 51.1 inches of precipitation each year with 0.0 inches of snow.
| Stat | Houston |
|---|---|
| Average Annual High | 78.8 |
| Average Annual Low | 60.5 |
| Annual Precipitation Days | 64.6 |
| Average Annual Precipitation | 51.1 |
| Average Annual Snowfall | 0.0 |
Average High
Days of Rain
Source: NOAA climate normals (30-year)
Houston, TX Photos


17 Reviews & Comments About Houston

Not much crime. Great homes, great community. Love this city
The city is very intimate and feels like home to so many.
Crime does seem to be slightly higher in Houston than other areas from human trafficking to constant police reports of people being robbed. However, people here are friendly and prices are reasonable.
The best things about Houston are the people and if you like interacting with diverse groups of people, Houston is a good place for you. On the flip side, the weather here is terrible with constant humidity and it takes forever to get anywhere with Houston traffic.
Imagine a place that is both hot as h**l and as humid and wet as a rain forest. That is Houston. Now imagine you are stuck in a car in traffic for 3 hours in this weather. Welcome to the daily commute in this city. The one advantage of living here is the extremely low cost of living. You can live very well off of a low to mid paying job.
Bad: Traffic, heat, horrible roads, lack of good jobs
Good: low cost of living, cheap entertainment and plenty of things to do.
I love the city of Houston! There's a sense of community here. The people are nice and are always willing to help each other out. The food here is also really great because there's such a variety to choose from. Houston will always be my city! #HTown
Houston Sports Team
University of Houston
Food Locations
Tourist Attractions
The first time I came here i was a little girl and i fell in love! It's so diverse here, the weather is amazing compared to where I use to live.
The yearly weather. The summers are really hot, the fall is the perfect temperature. I never want it to end. Winters get cold but are doable, and spring is nice.
Being from a small town, I always hated the thought of going to a big city. Not any more. Houston is one of those places you can walk around downtown and never get bored. The museums, zoo, restaurants and different activities keep you busy. Minute Maid Park, the home of the Houston Astros is visible right off the interstate.
Amazingly for as many people living in Houston, the downtown area is extremely clean. It makes me happy to know work that many people, they are obviously proud of their home.
The buildings and museums are my favorite things. I have been to PRIDE in Houston also. Very well organized and great event.
If you go in the summer, it is very hot. Make sure you wear sunscreen and drink plenty of fluids.
There are lots of good restaurants in houston but most of the good ones are centered around midtown or uptown. There is not much crime unless you reside in one of the wards.
Favorite places are the shopping malls like the galleria and the outlet mall. The movie theatres here are also very good and seating is comfortable.
Houston is a very average city. Nothing too special about it, and it's very flat, with way too many people. Traffic is a burden and crime is pretty high.
Bad things: Traffic, overpopulated, weather gets extremely hot in the summer, crime is dangerous here.
I was born and raised, in Houston Texas. For 30 years. Just last year my Husband and I moved to Virginia, for business reasons. Texas is the most amazing place. There is no place I would rather be or live.. Most folks aren't a fan of the weather, but it's one of my favorite things about living in Texas. Living here in Virginia, you get all of the seasons, including SNOW, and long winters. In Texas, Especially Houston, its warm all year long. You can get a tan on Christmas sometimes if you wanted to. In Texas people are friendlier, nicer, more loving, and giving. Anywhere else I've been folks are not so friendly. I meet people every other day who are also living in VA, but are from Texas, and all they want is to go back. Just like my Husband and I. There's nothing like southern hospitality, and friendliness.
There are good and bad parts in Houston just like everywhere else. Im sure crime's are just the same as anywhere else. If you ever visit Texas, stop by a What-A-Burger. You can't beat it..
Crime is same as most major cities. It is very cosmopolitan with all sorts of amazing ethnic foods. Cost of living is also pretty good given it is a major city. Lots of job opportunities
Hermann park is lovely as is Discovery Green. There are many food options here for all budgets and easily accessible. There are lot of sporting and cultural activities such as the annual rodeo etc.
The crime rate in Houston, TX is pretty high, a high number of human trafficking. Traffic is really bad, but there are many things to do, and many places to eat.
I love the Houston museum, and keep an eye out for the Houston Rodeo, its a very great experience! I specifically love that you would never get bored, because there are so many places to explore!
The crime rate of Houston is around 75% and its somewhat not safe to live, esp. in North and East Houston. But it's a home for more than 500 Fortune Companies where I and my friends used to work and its a great place for earning.
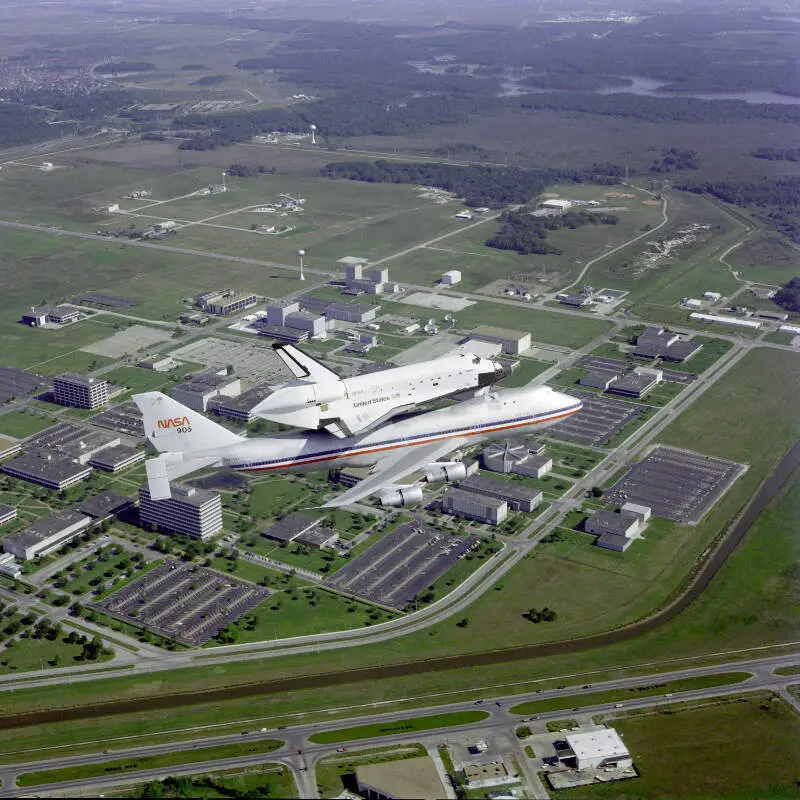
The NASAs space center located in Houston, Downtown Aquarium and Children's Museum are good places to be visited by Children for their passtime.
Houston has a high crime rate, but the city is so diverse and large you can find many things to do and ways to protect yourself.
The Chase Tower in Houston was really interesting!
The area in Houston that I live the crime level is average, not very much but it does exist. Houston has so many exciting things to do and see. You can visit the Houston Museum of Natural Science or the Downtown Aquarium or you can dine at one of our many fine eateries.
Houston is such a huge city, but every community has its charm. I love our Hermann Park and Houston Zoo area. You can visit the Miller Outdoor Theater and catch a free theatrical or musical performance under the stars. There is beautiful diversity of people in Houston, so naturally there are many different cultures and types of food to experience here.
THE CRIME IN HOUSTON IS RUNNING RAMPANT, IT IS NOT A SAFE PLACE
TRAFFIC IS HORRENDOUS, ROADS ARE TERRIBLE
I love the actual place where was born and most of my relatives this is where most of my memories are where i met my favorite singer when he came to town..The place is so full of wonderful things to do.
The different place of venue The Astrodome the zoo the Coliseums all the entertainment halls are great..The Texas barbecue is the best I would say in the world and The Southern Cooking is like no other
I live in Houston and I have not seen any shootings or heard any shooting but I cannot really say how bad the crime it's out here and cannot compare it to where I am originally from Compton California
Rankings & Articles For Houston


Locations Around Houston
Map Of Houston, TX
Best Places Around Houston
West University Place, TX
Population 14,982
Four Corners, TX
Population 11,692
Bellaire, TX
Population 17,206
Mission Bend, TX
Population 36,586
Sugar Land, TX
Population 110,016
Deer Park, TX
Population 33,967
Fresno, TX
Population 24,560
Atascocita, TX
Population 99,354
Pearland, TX
Population 127,514
Galena Park, TX
Population 10,487
Houston Demographics And Statistics
Population over time in Houston
The current population in Houston is 2,328,253. The population has increased 12.6% from 2010.
| Year | Population | % Change |
|---|---|---|
| 2024 | 2,328,253 | 1.2% |
| 2023 | 2,300,419 | 0.2% |
| 2022 | 2,296,253 | 0.1% |
| 2021 | 2,293,288 | -0.9% |
| 2020 | 2,313,238 | 0.1% |
| 2019 | 2,310,432 | 0.6% |
| 2018 | 2,295,982 | 1.3% |
| 2017 | 2,267,336 | 1.2% |
| 2016 | 2,240,582 | 1.0% |
| 2015 | 2,217,706 | 2.3% |
| 2014 | 2,167,988 | 1.6% |
| 2013 | 2,134,707 | 1.3% |
| 2012 | 2,107,449 | 0.9% |
| 2011 | 2,089,090 | 1.0% |
| 2010 | 2,068,026 | - |
Race / Ethnicity in Houston
See the full breakdown
Houston is:
23.2% White with 540,342 White residents.
22.3% African American with 519,857 African American residents.
0.1% American Indian with 2,541 American Indian residents.
6.9% Asian with 160,136 Asian residents.
0.1% Hawaiian with 1,330 Hawaiian residents.
0.4% Other with 9,786 Other residents.
2.8% Two Or More with 64,149 Two Or More residents.
44.2% Hispanic with 1,030,112 Hispanic residents.
| Race | Houston | TX | USA |
|---|---|---|---|
| White | 23.2% | 39.1% | 57.4% |
| African American | 22.3% | 11.9% | 11.9% |
| American Indian | 0.1% | 0.1% | 0.5% |
| Asian | 6.9% | 5.5% | 5.9% |
| Hawaiian | 0.1% | 0.1% | 0.2% |
| Other | 0.4% | 0.4% | 0.6% |
| Two Or More | 2.8% | 3.1% | 4.3% |
| Hispanic | 44.2% | 39.7% | 19.3% |
Gender in Houston
See the full breakdown
Houston is 50.6% female with 1,177,489 female residents.
Houston is 49.4% male with 1,150,763 male residents.
| Gender | Houston | TX | USA |
|---|---|---|---|
| Female | 50.6% | 50.1% | 50.5% |
| Male | 49.4% | 49.9% | 49.5% |
Highest level of educational attainment in Houston for adults over 25
See the full breakdown
13.0% of adults in Houston completed < 9th grade.
7.0% of adults in Houston completed 9-12th grade.
21.0% of adults in Houston completed high school / ged.
16.0% of adults in Houston completed some college.
6.0% of adults in Houston completed associate's degree.
22.0% of adults in Houston completed bachelor's degree.
10.0% of adults in Houston completed master's degree.
3.0% of adults in Houston completed professional degree.
2.0% of adults in Houston completed doctorate degree.
| Education | Houston | TX | USA |
|---|---|---|---|
| < 9th Grade | 13.0% | 8.0% | 4.0% |
| 9-12th Grade | 7.0% | 7.0% | 6.0% |
| High School / GED | 21.0% | 24.0% | 26.0% |
| Some College | 16.0% | 20.0% | 19.0% |
| Associate's Degree | 6.0% | 8.0% | 9.0% |
| Bachelor's Degree | 22.0% | 21.0% | 22.0% |
| Master's Degree | 10.0% | 9.0% | 10.0% |
| Professional Degree | 3.0% | 2.0% | 2.0% |
| Doctorate Degree | 2.0% | 1.0% | 2.0% |
Household Income For Houston, Texas
See the full breakdown
6.7% of households in Houston earn Less than $10,000.
4.1% of households in Houston earn $10,000 to $14,999.
7.9% of households in Houston earn $15,000 to $24,999.
8.3% of households in Houston earn $25,000 to $34,999.
12.2% of households in Houston earn $35,000 to $49,999.
17.2% of households in Houston earn $50,000 to $74,999.
11.7% of households in Houston earn $75,000 to $99,999.
13.2% of households in Houston earn $100,000 to $149,999.
6.8% of households in Houston earn $150,000 to $199,999.
11.8% of households in Houston earn $200,000 or more.
| Income | Houston | TX | USA |
|---|---|---|---|
| Less than $10,000 | 6.7% | 5.0% | 5.0% |
| $10,000 to $14,999 | 4.1% | 3.3% | 3.4% |
| $15,000 to $24,999 | 7.9% | 6.3% | 6.3% |
| $25,000 to $34,999 | 8.3% | 6.8% | 6.6% |
| $35,000 to $49,999 | 12.2% | 10.5% | 10.1% |
| $50,000 to $74,999 | 17.2% | 16.1% | 15.5% |
| $75,000 to $99,999 | 11.7% | 12.8% | 12.6% |
| $100,000 to $149,999 | 13.2% | 17.3% | 17.5% |
| $150,000 to $199,999 | 6.8% | 9.5% | 9.6% |
| $200,000 or more | 11.8% | 12.5% | 13.4% |
Source: U.S. Census ACS 5-year estimates (2024)


