San Angelo, TX
Demographics And Statistics
Living In San Angelo, Texas Summary
Life in San Angelo research summary. HomeSnacks has been using Saturday Night Science to research the quality of life in San Angelo over the past nine years using Census, FBI, Zillow, and other primary data sources. Based on the most recently available data, we found the following about life in San Angelo:
The population in San Angelo is 99,507.
The median home value in San Angelo is $228,324.
The median income in San Angelo is $64,146.
The cost of living in San Angelo is 92 which is 0.9x lower than the national average.
The median rent in San Angelo is $1,121.
The unemployment rate in San Angelo is 3.2%.
The poverty rate in San Angelo is 11.9%.
The average high in San Angelo is 78.1° and the average low is 52.5°.
San Angelo SnackAbility
Overall SnackAbility
San Angelo, TX Crime Report
Crime in San Angelo summary. We use data from the FBI to determine the crime rates in San Angelo. Key points include:
There were 2,677 total crimes in San Angelo in the last reporting year.
The overall crime rate per 100,000 people in San Angelo is 2,704.1 / 100k people.
The violent crime rate per 100,000 people in San Angelo is 218.2 / 100k people.
The property crime rate per 100,000 people in San Angelo is 2,486.0 / 100k people.
Overall, crime in San Angelo is 27.60% above the national average.
Total Crimes
Above National Average
Crime In San Angelo Comparison Table
| Statistic | Count Raw |
San Angelo / 100k People |
Texas / 100k People |
National / 100k People |
|---|---|---|---|---|
| Total Crimes Per 100K | 2,677 | 2,704.1 | 2,429.9 | 2,119.2 |
| Violent Crime | 216 | 218.2 | 389.4 | 359.0 |
| Murder | 4 | 4.0 | 5.2 | 5.0 |
| Robbery | 20 | 20.2 | 63.5 | 61.0 |
| Aggravated Assault | 168 | 169.7 | 270.7 | 256.0 |
| Property Crime | 2,461 | 2,486.0 | 2,040.5 | 1,760.0 |
| Burglary | 384 | 387.9 | 284.3 | 229.0 |
| Larceny | 1,947 | 1,966.7 | 1,425.6 | 1,272.0 |
| Car Theft | 130 | 131.3 | 330.7 | 259.0 |
San Angelo, TX Cost Of Living
Cost of living in San Angelo summary. We use data on the cost of living to determine how expensive it is to live in San Angelo. Real estate prices drive most of the variance in cost of living around Texas. Key points include:
The cost of living in San Angelo is 92 with 100 being average.
The cost of living in San Angelo is 0.9x lower than the national average.
The median home value in San Angelo is $228,324.
The median income in San Angelo is $64,146.
San Angelo's Overall Cost Of Living
Lower Than The National Average
Cost Of Living In San Angelo Comparison Table
| Living Expense | San Angelo | Texas | National Average | |
|---|---|---|---|---|
| Overall | 92 | 92 | 100 | |
| Services | 95 | 97 | 100 | |
| Groceries | 93 | 97 | 100 | |
| Health | 93 | 93 | 100 | |
| Housing | 84 | 82 | 100 | |
| Transportation | 94 | 94 | 100 | |
| Utilities | 103 | 104 | 100 | |
San Angelo, TX Weather
The average high in San Angelo is 78.1° and the average low is 52.5°.
There are 37.2 days of precipitation each year.
Expect an average of 21.9 inches of precipitation each year with 2.0 inches of snow.
| Stat | San Angelo |
|---|---|
| Average Annual High | 78.1 |
| Average Annual Low | 52.5 |
| Annual Precipitation Days | 37.2 |
| Average Annual Precipitation | 21.9 |
| Average Annual Snowfall | 2.0 |
Average High
Days of Rain
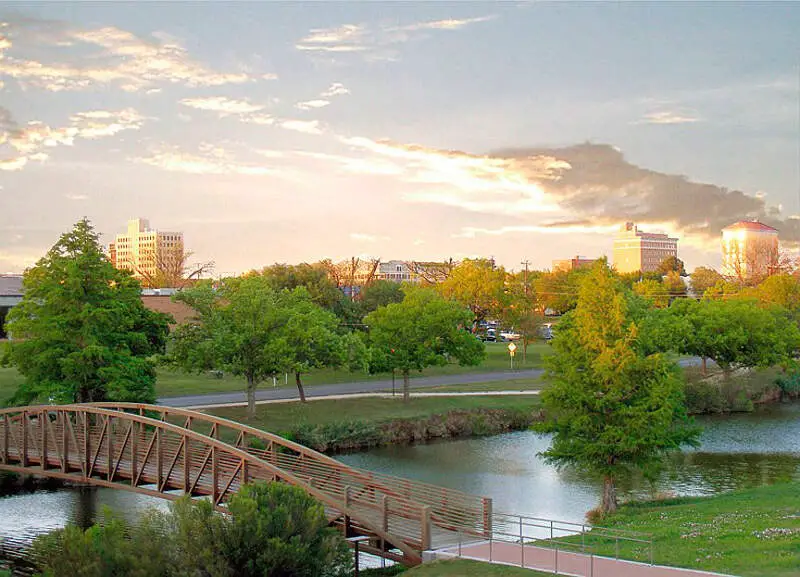
San Angelo, TX Photos
1 Reviews & Comments About San Angelo
/5

HomeSnacks User - 2018-08-03 15:57:03.967593
San Angelo is a great place to raise a family with loads of history, vibrant downtown area, and steady growth. The only reason it gets less than 5 houses is because it is hard to find a good job here.
I really enjoy Armenta's Mexican Restaurant. It is one of the best places to eat in San Angelo. A few other really good places are Cork and Pig Tavern, El Paisano, Jalapenos Locos, Western Sky Steakhouse, Henry's Diner, and Julio's Burritos. You can find Old Fort Concho near downtown and some great shopping for Antiques, Jewelry, Cowboy Boots, and Thrift Shops there. The Concho River has a great walking area that is paved over the majority of its length. The municipal swimming pool is a great place to cool off in the summer. They have some great slides, fountains, and a kiddy pool that makes it easy for the kids to have a great time! Lifeguards are always on duty. The San Angelo State Park also has some great campsites along with some areas for riding your bike or hiking.
Rankings for San Angelo in Texas


Locations Around San Angelo
Map Of San Angelo, TX
Best Places Around San Angelo
San Angelo Demographics And Statistics
Population over time in San Angelo
The current population in San Angelo is 99,507. The population has increased 8.9% from 2010.
| Year | Population | % Change |
|---|---|---|
| 2023 | 99,507 | 0.1% |
| 2022 | 99,422 | 0.0% |
| 2021 | 99,401 | -1.1% |
| 2020 | 100,509 | 0.5% |
| 2019 | 100,031 | 0.4% |
| 2018 | 99,634 | 0.5% |
| 2017 | 99,135 | 0.4% |
| 2016 | 98,694 | 1.1% |
| 2015 | 97,595 | 1.5% |
| 2014 | 96,177 | 1.4% |
| 2013 | 94,812 | 1.5% |
| 2012 | 93,450 | 1.2% |
| 2011 | 92,334 | 1.0% |
| 2010 | 91,385 | - |
Race / Ethnicity in San Angelo
San Angelo is:
49.0% White with 48,798 White residents.
3.8% African American with 3,807 African American residents.
0.1% American Indian with 53 American Indian residents.
1.3% Asian with 1,264 Asian residents.
0.1% Hawaiian with 110 Hawaiian residents.
0.5% Other with 545 Other residents.
2.9% Two Or More with 2,931 Two Or More residents.
42.2% Hispanic with 41,999 Hispanic residents.
| Race | San Angelo | TX | USA |
|---|---|---|---|
| White | 49.0% | 39.9% | 58.2% |
| African American | 3.8% | 11.9% | 12.0% |
| American Indian | 0.1% | 0.2% | 0.5% |
| Asian | 1.3% | 5.3% | 5.7% |
| Hawaiian | 0.1% | 0.1% | 0.2% |
| Other | 0.5% | 0.4% | 0.5% |
| Two Or More | 2.9% | 2.9% | 3.9% |
| Hispanic | 42.2% | 39.5% | 19.0% |
Gender in San Angelo
San Angelo is 50.2% female with 49,940 female residents.
San Angelo is 49.8% male with 49,566 male residents.
| Gender | San Angelo | TX | USA |
|---|---|---|---|
| Female | 50.2% | 50.1% | 50.5% |
| Male | 49.8% | 49.9% | 49.5% |
Highest level of educational attainment in San Angelo for adults over 25
5.0% of adults in San Angelo completed < 9th grade.
7.0% of adults in San Angelo completed 9-12th grade.
27.0% of adults in San Angelo completed high school / ged.
26.0% of adults in San Angelo completed some college.
9.0% of adults in San Angelo completed associate's degree.
17.0% of adults in San Angelo completed bachelor's degree.
7.0% of adults in San Angelo completed master's degree.
1.0% of adults in San Angelo completed professional degree.
1.0% of adults in San Angelo completed doctorate degree.
| Education | San Angelo | TX | USA |
|---|---|---|---|
| < 9th Grade | 5.0% | 7.0% | 5.0% |
| 9-12th Grade | 7.0% | 7.0% | 6.0% |
| High School / GED | 27.0% | 24.0% | 26.0% |
| Some College | 26.0% | 21.0% | 19.0% |
| Associate's Degree | 9.0% | 8.0% | 9.0% |
| Bachelor's Degree | 17.0% | 21.0% | 21.0% |
| Master's Degree | 7.0% | 9.0% | 10.0% |
| Professional Degree | 1.0% | 2.0% | 2.0% |
| Doctorate Degree | 1.0% | 1.0% | 2.0% |
Household Income For San Angelo, Texas
4.8% of households in San Angelo earn Less than $10,000.
3.8% of households in San Angelo earn $10,000 to $14,999.
8.9% of households in San Angelo earn $15,000 to $24,999.
8.7% of households in San Angelo earn $25,000 to $34,999.
12.8% of households in San Angelo earn $35,000 to $49,999.
17.9% of households in San Angelo earn $50,000 to $74,999.
14.9% of households in San Angelo earn $75,000 to $99,999.
16.9% of households in San Angelo earn $100,000 to $149,999.
6.1% of households in San Angelo earn $150,000 to $199,999.
5.2% of households in San Angelo earn $200,000 or more.
| Income | San Angelo | TX | USA |
|---|---|---|---|
| Less than $10,000 | 4.8% | 5.0% | 4.9% |
| $10,000 to $14,999 | 3.8% | 3.4% | 3.6% |
| $15,000 to $24,999 | 8.9% | 6.5% | 6.6% |
| $25,000 to $34,999 | 8.7% | 7.0% | 6.8% |
| $35,000 to $49,999 | 12.8% | 10.9% | 10.4% |
| $50,000 to $74,999 | 17.9% | 16.4% | 15.7% |
| $75,000 to $99,999 | 14.9% | 12.8% | 12.7% |
| $100,000 to $149,999 | 16.9% | 17.2% | 17.4% |
| $150,000 to $199,999 | 6.1% | 9.1% | 9.3% |
| $200,000 or more | 5.2% | 11.7% | 12.6% |


