More and more people would prefer to live in the cities and towns that surround Long Beach to avoid all the hustle and bustle.
So the question arises: what suburbs of Long Beach are the worst?
Today, we’ll use Saturday Night Science to determine which Long Beach ‘burbs need a little tender loving care – the sore thumbs of the Long Beach area if you will. Realistically, you can only expect some of the suburbs to live up to Long Beach proper, although Manhattan Beach certainly tries.
We examined the 97 biggest suburbs of Long Beach to find out the worst places to live. And while you won’t necessarily find them on the worst places to live in California lists, these ten places are a little too far downwind of Long Beach in terms of quality of life.
Table Of Contents: Top Ten | Methodology | Summary | Table
The 10 worst suburbs around Long Beach for 2024
Now don’t freak out.
What’s the worst suburb of Long Beach? Cudahy ranks as the worst suburb of Long Beach for 2024 based on the most recent Census and FBI data.
Or, if you’re thinking of moving to elsewhere in California check out the best places in California overall or the worst.
And remember, there are some good places to live around Long Beach too.
The 10 Worst Long Beach Suburbs To Live For 2024

/10
Population: 22,657
Median Income: $49,596 (lowest)
Unemployment Rate: 9.2% (3rd highest)
Median Home Value: $624,322 (10th lowest)
More on Cudahy: Data | Crime | Cost Of Living
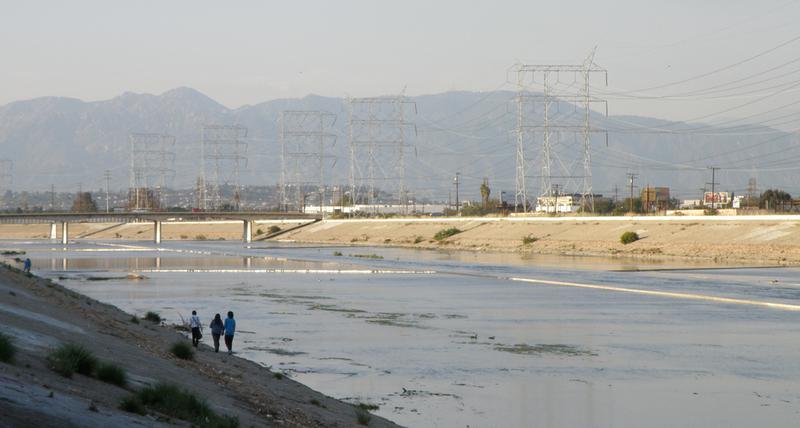
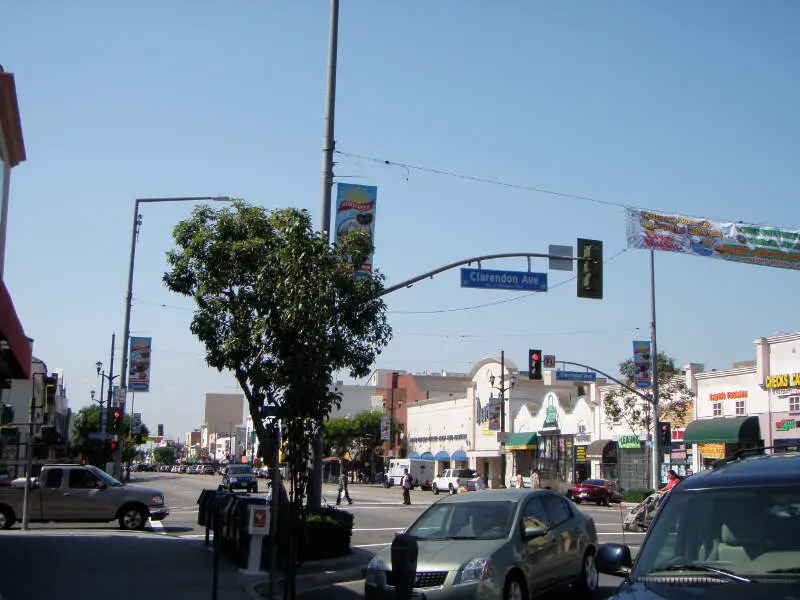
We’ll get the ball rolling with Cudahy, the absolute worst place to live around Long Beach according to the data.
And in the world of worst rankings, Cudahy beat the competition pretty handily thanks to scoring in the bottom 15% in three major categories. Income is the worst in the Long Beach area, and to make matters worse, the city ranks 10th worst when it comes to home values.
But hey, at least it’s cheap to live there. But there’s a reason for that… it’s Cudahy.
You won’t feel bad about not having a great income for the area. There aren’t a bunch of places to spend your money anyway.

/10
Population: 54,547
Median Income: $54,073 (3rd lowest)
Unemployment Rate: 10.1% (highest)
Median Home Value: $613,597 (8th lowest)
More on Huntington Park: Data | Crime | Cost Of Living
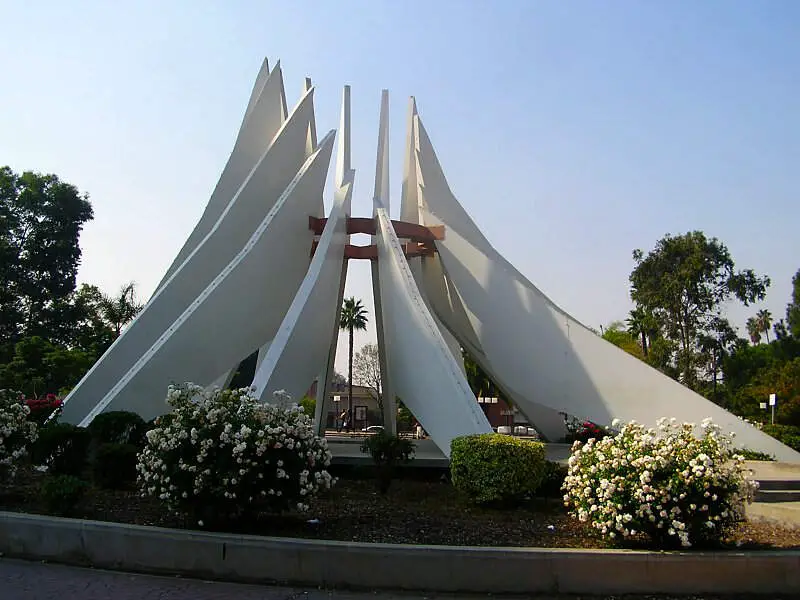
Welcome to Huntington Park. Home to KMart, Big Lots, and a lot of gas stations.
This city is 12.3 miles to Long Beach. Income levels here are the 3rd lowest in the metro area, where families bring in about $54,073 a year, which only goes so far even on a shoestring budget.
But on the bright side, there are a lot of fast food joints in the area.

/10
Population: 94,822
Median Income: $69,728 (15th lowest)
Unemployment Rate: 7.9% (13th highest)
Median Home Value: $584,418 (5th lowest)
More on Compton: Data | Crime | Cost Of Living
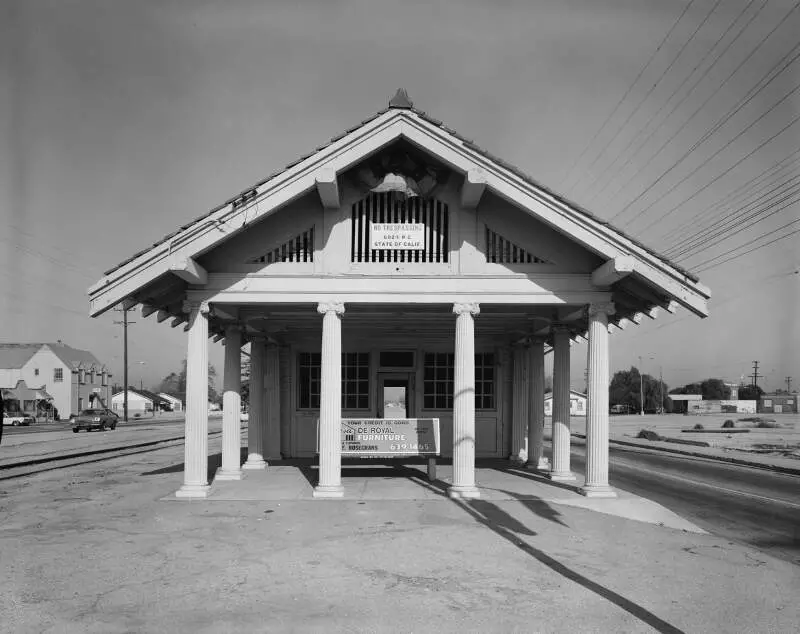
Back up the highway we go for the third worst Long Beach suburb you can live in. You might have expected to see Compton on here. While the cost of living is low, your entertainment and work options are limited. And that’s an understatement.
In terms of numbers, it’s in the worst 15% for insurance, and the adult high school dropout rate is poor compared to other Long Beach suburbs.
But at least there are lovely parks to bring the kids during the day.

/10
Population: 66,346
Median Income: $67,350 (12th lowest)
Unemployment Rate: 9.6% (2nd highest)
Median Home Value: $624,911 (11th lowest)
More on Lynwood: Data | Crime | Cost Of Living
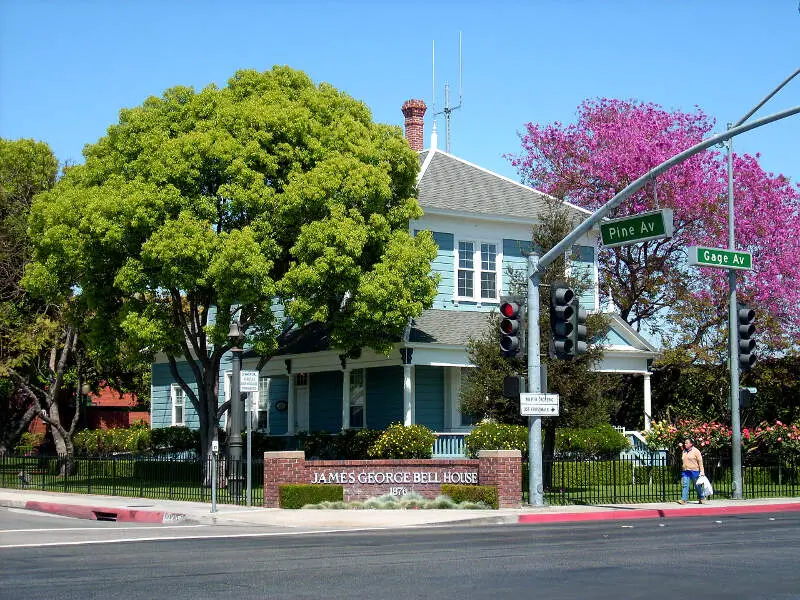
If you live in Lynwood, most likely you struggle to make ends meet every month. It ranks as the 12th lowest Long Beach suburb for median household incomes.
Not only that, but this is the 2nd worst unemployed suburb you can live in if you choose to live near Long Beach. Remember, we looked at 97 cities for this study.
Lynwood is about 8.4 miles to downtown.

/10
Population: 19,694
Median Income: $67,724 (14th lowest)
Unemployment Rate: 6.7% (28th highest)
Median Home Value: $697,787 (22nd lowest)
More on South El Monte: Data | Crime | Cost Of Living
South El Monte has the distinction of being a Long Beach suburb. Which means that’s about all it has going for it.
All snarkiness aside, South El Monte has the 22nd lowest home values in the metro Long Beach area, where the median price is $697,787. The median income is $224,766.
South El Monte has an unemployment rate of 6.74% which ranks 28th worst.

/10
Population: 33,377
Median Income: $56,685 (4th lowest)
Unemployment Rate: 6.5% (3highest)
Median Home Value: $634,376 (13th lowest)
More on Bell: Data | Crime | Cost Of Living
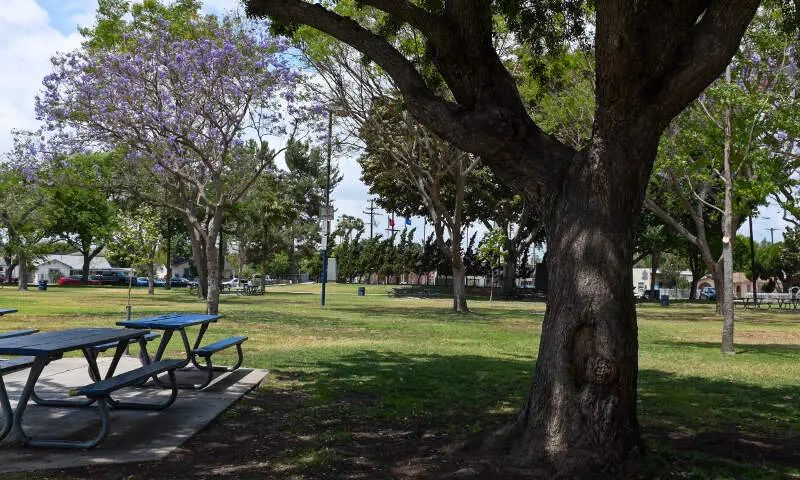
Bell has 33,377 residents that probably know it’s a pretty crummy place to live when you look at the data. (Or, if you’ve ever been there, you don’t need to look at the data.)
Incomes are towards the bottom, and the poverty rate sits at 23.36344474555857%.

/10
Population: 39,263
Median Income: $53,935 (2nd lowest)
Unemployment Rate: 5.7% (44th highest)
Median Home Value: $632,331 (12th lowest)
More on Bell Gardens: Data | Crime | Cost Of Living
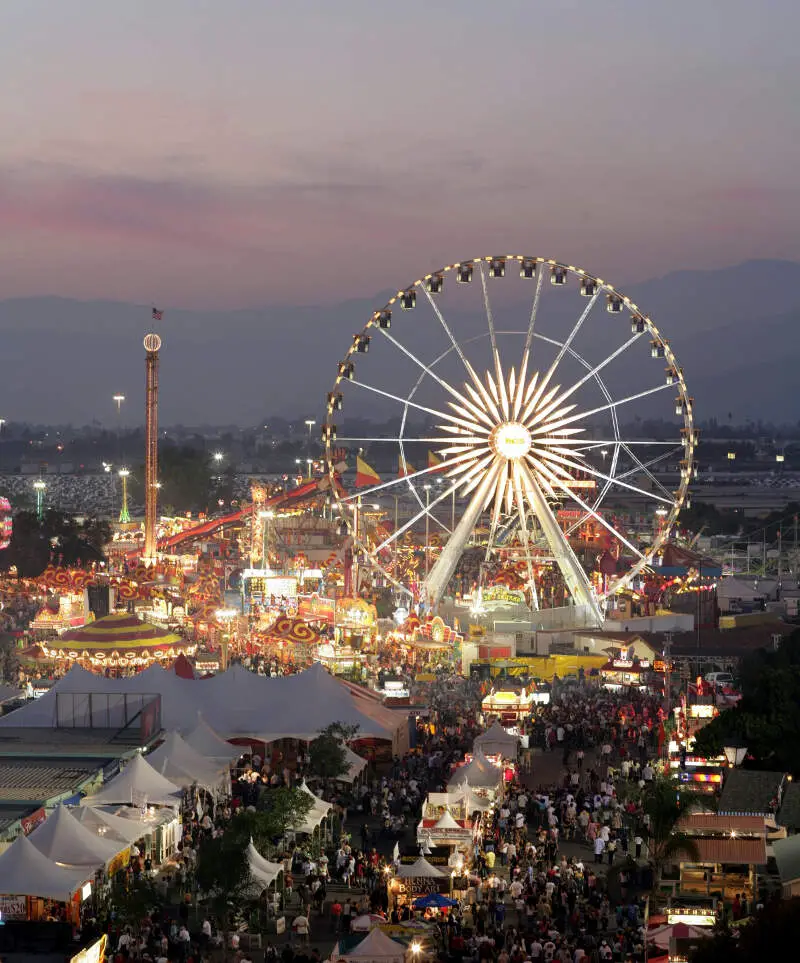
Ah, Bell Gardens. You rank as the 7th worst place to live around Long Beach.
It’s the place with the 44th most out of work residents in the Long Beach metro area (5.75%).

/10
Population: 149,831
Median Income: $73,515 (2lowest)
Unemployment Rate: 6.5% (32nd highest)
Median Home Value: $619,187 (9th lowest)
More on Pomona: Data | Crime | Cost Of Living
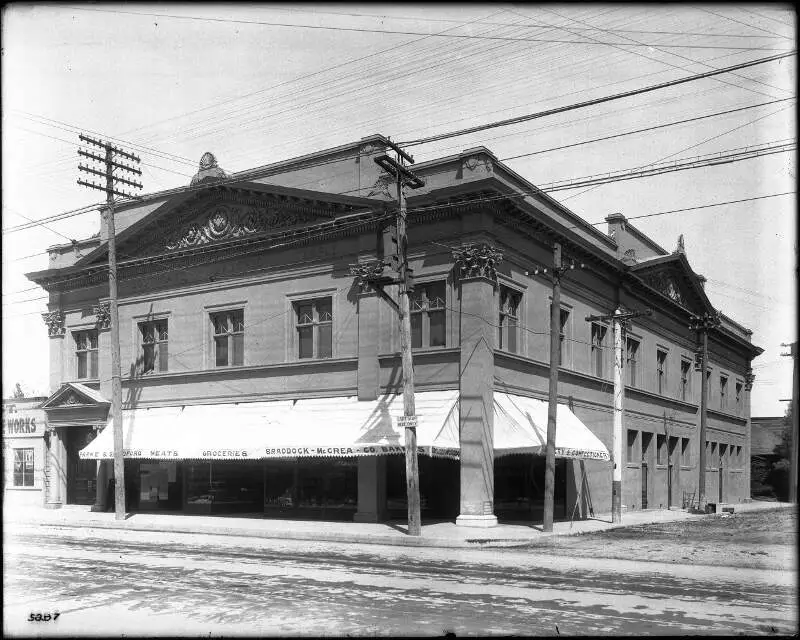
Pomona is a city about 28.4 miles from Long Beach, but Long Beach probably wishes it was further away. It ranks as the 8th worst burb for 2018.
You’d be hard-pressed to find a worse place to live. Pomona has the 17th most uninsured people, 2worst incomes, and has the 32nd highest unemployment rate (6.52%) in the entire Long Beach metro area.
Homes only cost $619,187 for a reason. That’s cheap for Long Beach standards.

/10
Population: 92,381
Median Income: $67,188 (10th lowest)
Unemployment Rate: 7.9% (14th highest)
Median Home Value: $635,980 (14th lowest)
More on South Gate: Data | Crime | Cost Of Living
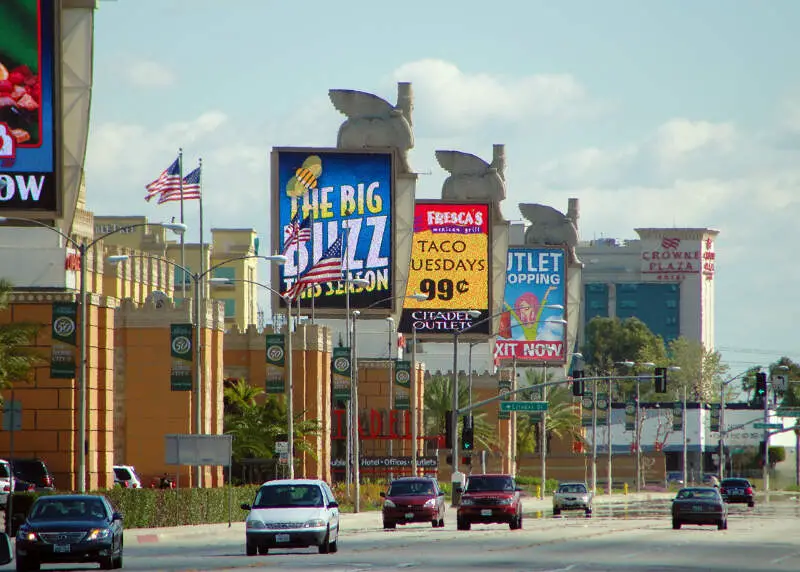
If you absolutely have to live near Long Beach, then South Gate might be a place for you to consider as it’s only the 9th worst Long Beach suburb.
About 7.89% of residents are out of work.

/10
Population: 12,253
Median Income: $66,071 (9th lowest)
Unemployment Rate: 4.9% (77th highest)
Median Home Value: $636,672 (15th lowest)
More on Commerce: Data | Crime | Cost Of Living
Rounding out the ten worst Long Beach suburbs to call home is Commerce.
Located 12.8 miles outside the city, Commerces is a real pit when you look at the data. Its residents have the 77th highest unemployment rate (4.9%), and poverty is far above the area average.
Methodology: Determining The Worst Suburbs Around Long Beach for 2024
To figure out how bad a Long Beach suburb is to live in, we used Saturday Night Science to identify the kinds of things people like and then decide what suburbs have the least amount of those things.
Using the most recent American Community Survey data from 2018-2022, this is the criteria we used:
- High unemployment rate
- Low median household incomes
- Low population density (no things to do)
- Low home values
- A lot of high school dropouts
- High poverty
- High rate of uninsured families
We defined a suburb as any town within 30 miles of Long Beach.
We also limited the analysis to places with over 3,000 people. This left us with a grand total of 97 suburbs to evaluate around Long Beach.
We ranked each place with scores from 1 to 97 in each category, where 1 was the “worst.”
Next, we averaged the rankings for each place to create a quality-of-life index.
And finally, we crowned the city with the worst quality of life index, the “Worst Suburb near Long Beach.” We’re looking at you, Cudahy.
We updated this article for 2024, which reflects our tenth time ranking the worst suburbs around Long Beach.
Summary: The areas around Long Beach where the dream is more of a nightmare for 2024
Well there you have it — the worst of the ‘burbs surrounding Long Beach with Cudahy casting itself ahead of the pack.
The worst suburbs of Long Beach are .
As we mentioned earlier, the suburbs around Long Beach aren’t all bad. Manhattan Beach takes the cake as the best place to live around Long Beach.
- Manhattan Beach
- Hermosa Beach
- Palos Verdes Estates
For more California reading, check out:
- Best Places To Live In California
- Cheapest Places To Live In California
- Most Dangerous Cities In California
- Best Places To Retire In California
- Richest Cities In California
- Safest Places In California
- Worst Places To Live In California
Detailed List Of The Worst Long Beach Suburbs
| Rank | City | Population | Median Income | Median Home Values |
|---|---|---|---|---|
| 1 | Cudahy | 22,657 | $49,596 | $624,322 |
| 2 | Huntington Park | 54,547 | $54,073 | $613,597 |
| 3 | Compton | 94,822 | $69,728 | $584,418 |
| 4 | Lynwood | 66,346 | $67,350 | $624,911 |
| 5 | South El Monte | 19,694 | $67,724 | $697,787 |
| 6 | Bell | 33,377 | $56,685 | $634,376 |
| 7 | Bell Gardens | 39,263 | $53,935 | $632,331 |
| 8 | Pomona | 149,831 | $73,515 | $619,187 |
| 9 | South Gate | 92,381 | $67,188 | $635,980 |
| 10 | Commerce | 12,253 | $66,071 | $636,672 |
| 11 | El Monte | 108,682 | $59,929 | $705,480 |
| 12 | Maywood | 25,009 | $57,615 | $603,697 |
| 13 | Inglewood | 106,806 | $67,563 | $724,865 |
| 14 | Montebello | 62,056 | $72,317 | $752,515 |
| 15 | Baldwin Park | 71,692 | $76,002 | $653,339 |
| 16 | Paramount | 53,255 | $67,197 | $599,020 |
| 17 | Azusa | 49,704 | $81,516 | $657,103 |
| 18 | Bellflower | 78,352 | $75,379 | $736,258 |
| 19 | Los Angeles | 3,881,041 | $76,244 | $926,593 |
| 20 | Hawthorne | 86,978 | $72,298 | $845,860 |
| 21 | Stanton | 38,271 | $76,123 | $701,971 |
| 22 | Hawaiian Gardens | 14,011 | $73,510 | $571,342 |
| 23 | Lawndale | 31,553 | $76,213 | $744,065 |
| 24 | Midway | 3,500 | $58,393 | $252,104 |
| 25 | La Puente | 37,835 | $77,702 | $655,653 |
| 26 | Westminster | 90,638 | $80,271 | $952,142 |
| 27 | Santa Ana | 311,379 | $84,210 | $753,174 |
| 28 | Anaheim | 347,111 | $88,538 | $844,174 |
| 29 | Laguna Woods | 17,452 | $56,928 | $409,471 |
| 30 | Glendale | 194,512 | $81,219 | $1,134,103 |
| 31 | Artesia | 16,237 | $92,702 | $765,251 |
| 32 | Carson | 94,475 | $103,045 | $750,385 |
| 33 | Santa Fe Springs | 18,840 | $81,500 | $711,899 |
| 34 | Pico Rivera | 61,561 | $82,539 | $694,218 |
| 35 | Garden Grove | 171,637 | $86,139 | $867,160 |
| 36 | La Habra | 62,904 | $93,801 | $802,058 |
| 37 | Duarte | 21,686 | $93,908 | $736,339 |
| 38 | Temple | 5,395 | $71,917 | $278,708 |
| 39 | Rosemead | 51,043 | $70,073 | $827,126 |
| 40 | Fullerton | 142,280 | $99,279 | $936,138 |
| 41 | Gardena | 60,377 | $75,443 | $752,319 |
| 42 | San Gabriel | 39,211 | $84,056 | $1,017,443 |
| 43 | Norwalk | 101,893 | $91,259 | $694,399 |
| 44 | West Covina | 108,173 | $96,219 | $785,843 |
| 45 | Downey | 113,052 | $84,236 | $809,809 |
| 46 | Monrovia | 37,656 | $93,827 | $933,244 |
| 47 | Monterey Park | 60,386 | $76,892 | $879,700 |
| 48 | Covina | 50,717 | $89,650 | $739,542 |
| 49 | Whittier | 86,459 | $89,686 | $756,497 |
| 50 | Los Alamitos | 11,728 | $100,987 | $1,427,481 |
| 51 | Tustin | 79,514 | $102,065 | $1,015,712 |
| 52 | Alhambra | 82,295 | $80,234 | $883,188 |
| 53 | Pasadena | 137,554 | $97,818 | $1,092,011 |
| 54 | San Dimas | 34,466 | $102,241 | $863,283 |
| 55 | Signal Hill | 11,678 | $96,385 | $695,986 |
| 56 | Buena Park | 83,542 | $101,586 | $834,048 |
| 57 | Burbank | 106,389 | $91,455 | $1,128,292 |
| 58 | Costa Mesa | 111,490 | $104,981 | $1,211,464 |
| 59 | Chino Hills | 78,223 | $117,548 | $913,774 |
| 60 | Glendora | 52,095 | $106,718 | $836,144 |
| 61 | Lomita | 20,662 | $87,717 | $879,224 |
| 62 | Orange | 138,728 | $109,335 | $991,595 |
| 63 | West Hollywood | 35,358 | $89,034 | $1,048,481 |
| 64 | Seal Beach | 25,046 | $75,507 | $900,528 |
| 65 | Irvine | 304,527 | $122,948 | $1,331,528 |
| 66 | Beverly Hills | 32,406 | $116,771 | $3,641,358 |
| 67 | Diamond Bar | 54,534 | $106,881 | $934,630 |
| 68 | Placentia | 51,797 | $106,155 | $973,725 |
| 69 | Lakewood | 81,499 | $113,030 | $814,339 |
| 70 | Santa Monica | 92,168 | $106,797 | $1,685,607 |
| 71 | Fountain Valley | 56,754 | $108,860 | $1,200,770 |
| 72 | La Mirada | 47,644 | $104,130 | $822,102 |
| 73 | Arcadia | 56,181 | $108,214 | $1,326,864 |
| 74 | Cypress | 49,955 | $117,461 | $964,692 |
| 75 | Brea | 47,099 | $120,226 | $1,019,390 |
| 76 | Lake Forest | 85,583 | $128,358 | $1,056,345 |
| 77 | Huntington Beach | 197,481 | $114,747 | $1,206,669 |
| 78 | Walnut | 28,212 | $130,444 | $1,093,688 |
| 79 | Torrance | 145,454 | $109,554 | $1,140,607 |
| 80 | Rolling Hills Estates | 8,214 | $179,917 | $1,986,586 |
| 81 | Cerritos | 49,016 | $124,460 | $1,003,485 |
| 82 | Laguna Beach | 22,943 | $141,875 | $2,817,490 |
| 83 | La Palma | 15,522 | $113,398 | $1,059,180 |
| 84 | San Marino | 12,442 | $174,253 | $2,524,471 |
| 85 | Sierra Madre | 11,151 | $128,056 | $1,347,845 |
| 86 | Aliso Viejo | 51,896 | $131,708 | $915,734 |
| 87 | El Segundo | 17,081 | $142,596 | $1,606,335 |
| 88 | Yorba Linda | 68,035 | $148,325 | $1,245,181 |
| 89 | La Habra Heights | 5,599 | $179,990 | $1,294,550 |
| 90 | Rancho Palos Verdes | 41,805 | $166,747 | $1,836,118 |
| 91 | Newport Beach | 85,159 | $149,471 | $3,132,424 |
| 92 | Villa Park | 5,814 | $189,306 | $2,030,498 |
| 93 | South Pasadena | 26,583 | $127,882 | $1,650,214 |
| 94 | Redondo Beach | 70,620 | $134,033 | $1,379,761 |
| 95 | Palos Verdes Estates | 13,219 | $224,766 | $2,717,769 |
| 96 | Hermosa Beach | 19,551 | $149,500 | $2,169,343 |
| 97 | Manhattan Beach | 35,123 | $187,217 | $2,990,671 |