Wytheville SnackAbility
Overall SnackAbility
Crime in Wytheville summary. We use data from the FBI to determine the crime rates in Wytheville. Key points include:
There were 227 total crimes in Wytheville in the last reporting year.
The overall crime rate per 100,000 people in Wytheville is 2,789.4 / 100k people.
The violent crime rate per 100,000 people in Wytheville is 61.4 / 100k people.
The property crime rate per 100,000 people in Wytheville is 2,727.9 / 100k people.
Overall, crime in Wytheville is 31.62% above the national average.
Total Crimes
Above National Average
Crime In Wytheville Comparison Table
| Statistic | Count Raw |
Wytheville / 100k People |
Virginia / 100k People |
National / 100k People |
|---|---|---|---|---|
| Total Crimes Per 100K | 227 | 2,789.4 | 1,787.6 | 2,119.2 |
| Violent Crime | 5 | 61.4 | 217.9 | 359.0 |
| Murder | 1 | 12.3 | 4.8 | 5.0 |
| Robbery | 0 | 0.0 | 33.1 | 61.0 |
| Aggravated Assault | 2 | 24.6 | 152.2 | 256.0 |
| Property Crime | 222 | 2,727.9 | 1,569.7 | 1,760.0 |
| Burglary | 11 | 135.2 | 108.7 | 229.0 |
| Larceny | 191 | 2,347.0 | 1,315.9 | 1,272.0 |
| Car Theft | 20 | 245.8 | 145.1 | 259.0 |
Source: FBI Uniform Crime Reporting (2024)
Cost of living in Wytheville summary. We use data on the cost of living to determine how expensive it is to live in Wytheville. Real estate prices drive most of the variance in cost of living around Virginia. Key points include:
The cost of living in Wytheville is 96 with 100 being average.
The cost of living in Wytheville is 1.0x lower than the national average.
The median home value in Wytheville is $223,768.
The median income in Wytheville is $47,270.
Wytheville's Overall Cost Of Living
Lower Than The National Average
Cost Of Living In Wytheville Comparison Table
| Living Expense | Wytheville | Virginia | National Average |
|---|---|---|---|
| Overall | 96 | 112 | 100 |
| Services | 103 | 103 | 100 |
| Groceries | 102 | 104 | 100 |
| Health | 83 | 131 | 100 |
| Housing | 103 | 105 | 100 |
| Transportation | 104 | 105 | 100 |
| Utilities | 101 | 104 | 100 |
Source: Cost of living index, normalized to US average = 100
Wytheville, VA Weather
The average high in Wytheville is 63.9° and the average low is 40.5°.
There are 72.3 days of precipitation each year.
Expect an average of 38.9 inches of precipitation each year with 20.5 inches of snow.
| Stat | Wytheville |
|---|---|
| Average Annual High | 63.9 |
| Average Annual Low | 40.5 |
| Annual Precipitation Days | 72.3 |
| Average Annual Precipitation | 38.9 |
| Average Annual Snowfall | 20.5 |
Average High
Days of Rain
Source: NOAA climate normals (30-year)
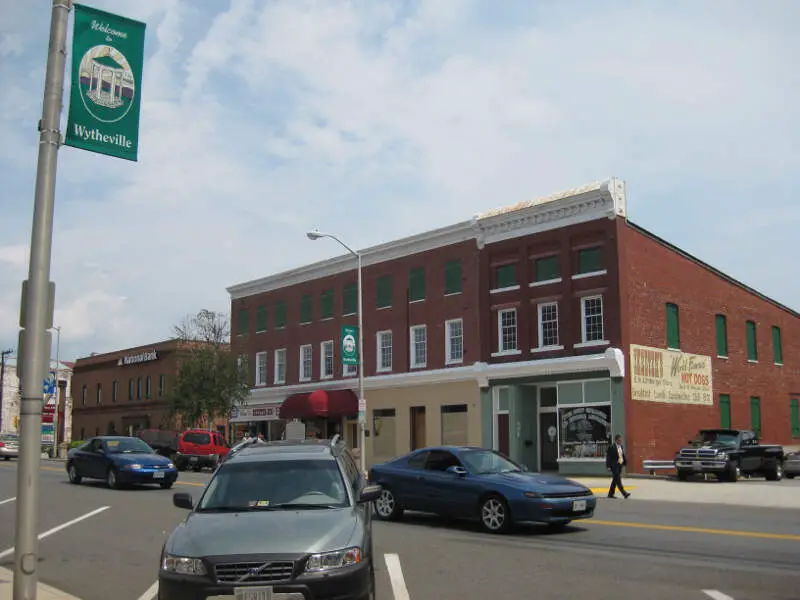
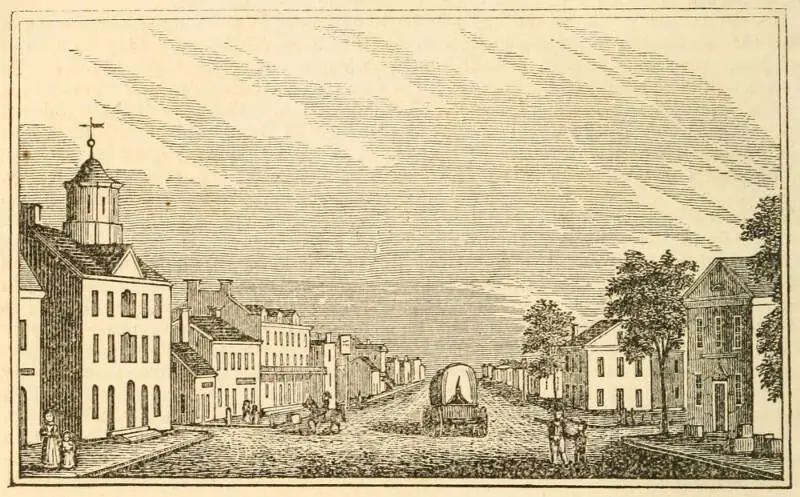
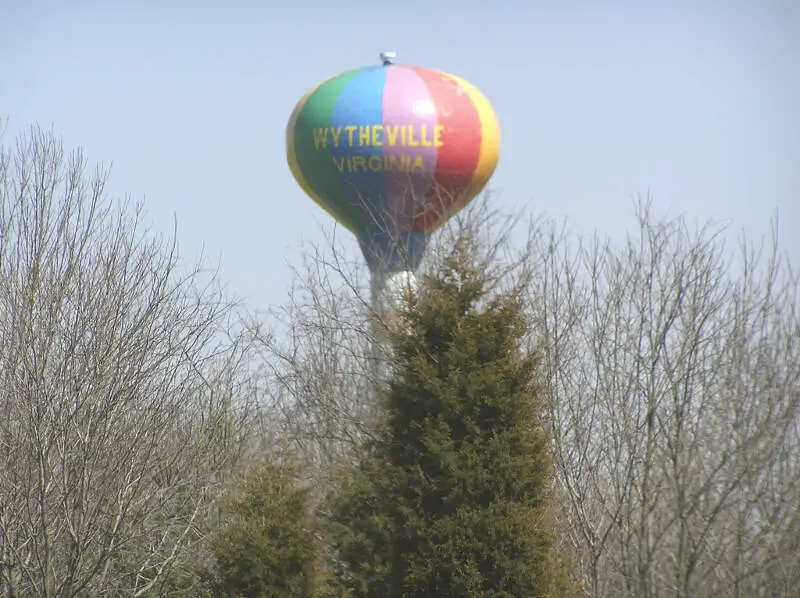
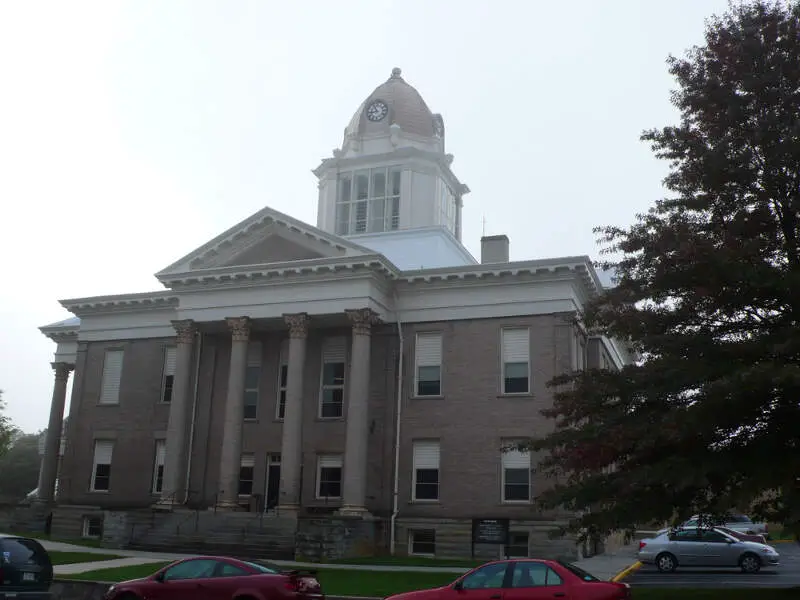
Wytheville, VA Photos
1 Reviews & Comments About Wytheville

I live in Wytheville! I moved here from Northern VA and it is so nice here.
Slower pace, quiet, beautiful, peaceful, no traffic, no noise, everyone is so nice, friendly and will give you the shirt off their back.
Everyone waves to you whether they know you or not. There are great restaurants, coffee shops, bakeries, a wal mart supercenter, etc. Just not so much that you are overwhelmed
And Christiansburg is only an hour away. It isn't very expensive to live here either.
Taxes are low, police dept is awesome, and there are jobs if you are willing to work.
If I wanted city life, I would have stayed in Northern VA!
Rankings & Articles For Wytheville


Locations Around Wytheville
Map Of Wytheville, VA
Best Places Around Wytheville
Blacksburg, VA
Population 45,446
Christiansburg, VA
Population 22,720
Mount Airy, NC
Population 10,633
Radford, VA
Population 16,726
Pulaski, VA
Population 8,893
Bluefield, VA
Population 4,979
Bluefield, WV
Population 9,387
Princeton, WV
Population 5,736
Richlands, VA
Population 5,171
Marion, VA
Population 5,670
Wytheville Demographics And Statistics
Population over time in Wytheville
The current population in Wytheville is 8,202. The population has increased 0.5% from 2010.
| Year | Population | % Change |
|---|---|---|
| 2024 | 8,202 | -0.3% |
| 2023 | 8,224 | -0.0% |
| 2022 | 8,228 | -0.4% |
| 2021 | 8,260 | 4.2% |
| 2020 | 7,925 | -0.4% |
| 2019 | 7,957 | -0.5% |
| 2018 | 8,000 | -0.5% |
| 2017 | 8,041 | -1.5% |
| 2016 | 8,167 | 0.2% |
| 2015 | 8,154 | -0.5% |
| 2014 | 8,193 | -0.4% |
| 2013 | 8,225 | 0.2% |
| 2012 | 8,205 | 0.1% |
| 2011 | 8,200 | 0.5% |
| 2010 | 8,163 | - |
Race / Ethnicity in Wytheville
See the full breakdown
Wytheville is:
89.1% White with 7,310 White residents.
3.3% African American with 271 African American residents.
0.0% American Indian with 4 American Indian residents.
2.5% Asian with 204 Asian residents.
1.0% Hawaiian with 85 Hawaiian residents.
0.0% Other with 0 Other residents.
1.2% Two Or More with 101 Two Or More residents.
2.8% Hispanic with 227 Hispanic residents.
| Race | Wytheville | VA | USA |
|---|---|---|---|
| White | 89.1% | 58.4% | 57.4% |
| African American | 3.3% | 18.3% | 11.9% |
| American Indian | 0.0% | 0.1% | 0.5% |
| Asian | 2.5% | 6.9% | 5.9% |
| Hawaiian | 1.0% | 0.1% | 0.2% |
| Other | 0.0% | 0.6% | 0.6% |
| Two Or More | 1.2% | 4.7% | 4.3% |
| Hispanic | 2.8% | 11.0% | 19.3% |
Gender in Wytheville
See the full breakdown
Wytheville is 50.8% female with 4,169 female residents.
Wytheville is 49.2% male with 4,033 male residents.
| Gender | Wytheville | VA | USA |
|---|---|---|---|
| Female | 50.8% | 50.6% | 50.5% |
| Male | 49.2% | 49.4% | 49.5% |
Highest level of educational attainment in Wytheville for adults over 25
See the full breakdown
5.0% of adults in Wytheville completed < 9th grade.
9.0% of adults in Wytheville completed 9-12th grade.
30.0% of adults in Wytheville completed high school / ged.
24.0% of adults in Wytheville completed some college.
8.0% of adults in Wytheville completed associate's degree.
13.0% of adults in Wytheville completed bachelor's degree.
9.0% of adults in Wytheville completed master's degree.
1.0% of adults in Wytheville completed professional degree.
1.0% of adults in Wytheville completed doctorate degree.
| Education | Wytheville | VA | USA |
|---|---|---|---|
| < 9th Grade | 5.0% | 2.0% | 4.0% |
| 9-12th Grade | 9.0% | 5.0% | 6.0% |
| High School / GED | 30.0% | 24.0% | 26.0% |
| Some College | 24.0% | 18.0% | 19.0% |
| Associate's Degree | 8.0% | 8.0% | 9.0% |
| Bachelor's Degree | 13.0% | 24.0% | 22.0% |
| Master's Degree | 9.0% | 14.0% | 10.0% |
| Professional Degree | 1.0% | 3.0% | 2.0% |
| Doctorate Degree | 1.0% | 2.0% | 2.0% |
Household Income For Wytheville, Virginia
See the full breakdown
12.7% of households in Wytheville earn Less than $10,000.
9.2% of households in Wytheville earn $10,000 to $14,999.
6.6% of households in Wytheville earn $15,000 to $24,999.
10.8% of households in Wytheville earn $25,000 to $34,999.
13.8% of households in Wytheville earn $35,000 to $49,999.
9.2% of households in Wytheville earn $50,000 to $74,999.
11.8% of households in Wytheville earn $75,000 to $99,999.
17.2% of households in Wytheville earn $100,000 to $149,999.
6.4% of households in Wytheville earn $150,000 to $199,999.
2.4% of households in Wytheville earn $200,000 or more.
| Income | Wytheville | VA | USA |
|---|---|---|---|
| Less than $10,000 | 12.7% | 4.2% | 5.0% |
| $10,000 to $14,999 | 9.2% | 2.7% | 3.4% |
| $15,000 to $24,999 | 6.6% | 5.2% | 6.3% |
| $25,000 to $34,999 | 10.8% | 5.7% | 6.6% |
| $35,000 to $49,999 | 13.8% | 8.8% | 10.1% |
| $50,000 to $74,999 | 9.2% | 14.3% | 15.5% |
| $75,000 to $99,999 | 11.8% | 12.1% | 12.6% |
| $100,000 to $149,999 | 17.2% | 18.1% | 17.5% |
| $150,000 to $199,999 | 6.4% | 11.1% | 9.6% |
| $200,000 or more | 2.4% | 17.7% | 13.4% |
Source: U.S. Census ACS 5-year estimates (2024)


