Arab SnackAbility
Overall SnackAbility
Crime in Arab summary. We use data from the FBI to determine the crime rates in Arab. Key points include:
There were 341 total crimes in Arab in the last reporting year.
The overall crime rate per 100,000 people in Arab is 3,805.8 / 100k people.
The violent crime rate per 100,000 people in Arab is 256.7 / 100k people.
The property crime rate per 100,000 people in Arab is 3,549.1 / 100k people.
Overall, crime in Arab is 79.58% above the national average.
Total Crimes
Above National Average
Crime In Arab Comparison Table
| Statistic | Count Raw |
Arab / 100k People |
Alabama / 100k People |
National / 100k People |
|---|---|---|---|---|
| Total Crimes Per 100K | 341 | 3,805.8 | 1,924.9 | 2,119.2 |
| Violent Crime | 23 | 256.7 | 359.9 | 359.0 |
| Murder | 0 | 0.0 | 8.7 | 5.0 |
| Robbery | 1 | 11.2 | 34.0 | 61.0 |
| Aggravated Assault | 16 | 178.6 | 291.4 | 256.0 |
| Property Crime | 318 | 3,549.1 | 1,565.1 | 1,760.0 |
| Burglary | 74 | 825.9 | 243.5 | 229.0 |
| Larceny | 212 | 2,366.1 | 1,148.5 | 1,272.0 |
| Car Theft | 32 | 357.1 | 173.0 | 259.0 |
Source: FBI Uniform Crime Reporting (2024)
Cost of living in Arab summary. We use data on the cost of living to determine how expensive it is to live in Arab. Real estate prices drive most of the variance in cost of living around Alabama. Key points include:
The cost of living in Arab is 89 with 100 being average.
The cost of living in Arab is 0.9x lower than the national average.
The median home value in Arab is $241,411.
The median income in Arab is $64,333.
Arab's Overall Cost Of Living
Lower Than The National Average
Cost Of Living In Arab Comparison Table
| Living Expense | Arab | Alabama | National Average |
|---|---|---|---|
| Overall | 89 | 91 | 100 |
| Services | 97 | 95 | 100 |
| Groceries | 93 | 96 | 100 |
| Health | 77 | 74 | 100 |
| Housing | 96 | 96 | 100 |
| Transportation | 102 | 95 | 100 |
| Utilities | 92 | 95 | 100 |
Source: Cost of living index, normalized to US average = 100
Arab, AL Weather
The average high in Arab is 70.8° and the average low is 49.7°.
There are 79.6 days of precipitation each year.
Expect an average of 54.7 inches of precipitation each year with 0.7 inches of snow.
| Stat | Arab |
|---|---|
| Average Annual High | 70.8 |
| Average Annual Low | 49.7 |
| Annual Precipitation Days | 79.6 |
| Average Annual Precipitation | 54.7 |
| Average Annual Snowfall | 0.7 |
Average High
Days of Rain
Source: NOAA climate normals (30-year)
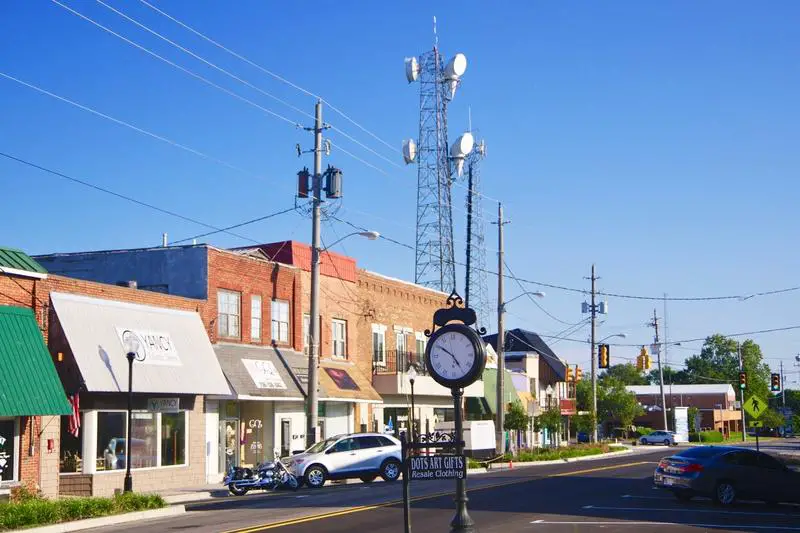
Arab, AL Photos
Rankings & Articles For Arab


Locations Around Arab
Map Of Arab, AL
Best Places Around Arab
Gadsden, AL
Population 33,374
Fort Payne, AL
Population 14,927
Scottsboro, AL
Population 15,712
Cullman, AL
Population 19,319
Huntsville, AL
Population 222,791
Decatur, AL
Population 57,361
Athens, AL
Population 29,002
Albertville, AL
Population 22,813
Center Point, AL
Population 15,914
Hartselle, AL
Population 15,847
Arab Demographics And Statistics
Population over time in Arab
The current population in Arab is 8,679. The population has increased 9.5% from 2010.
| Year | Population | % Change |
|---|---|---|
| 2024 | 8,679 | 1.2% |
| 2023 | 8,573 | 0.2% |
| 2022 | 8,552 | 1.1% |
| 2021 | 8,462 | 0.7% |
| 2020 | 8,405 | 1.4% |
| 2019 | 8,293 | 0.7% |
| 2018 | 8,234 | 0.4% |
| 2017 | 8,200 | -0.6% |
| 2016 | 8,247 | -0.4% |
| 2015 | 8,282 | 0.5% |
| 2014 | 8,241 | 0.5% |
| 2013 | 8,204 | 1.0% |
| 2012 | 8,119 | 1.2% |
| 2011 | 8,023 | 1.2% |
| 2010 | 7,928 | - |
Race / Ethnicity in Arab
See the full breakdown
Arab is:
88.1% White with 7,649 White residents.
0.8% African American with 71 African American residents.
0.2% American Indian with 19 American Indian residents.
1.7% Asian with 148 Asian residents.
0.0% Hawaiian with 2 Hawaiian residents.
0.2% Other with 15 Other residents.
2.2% Two Or More with 194 Two Or More residents.
6.7% Hispanic with 581 Hispanic residents.
| Race | Arab | AL | USA |
|---|---|---|---|
| White | 88.1% | 63.4% | 57.4% |
| African American | 0.8% | 25.6% | 11.9% |
| American Indian | 0.2% | 0.3% | 0.5% |
| Asian | 1.7% | 1.4% | 5.9% |
| Hawaiian | 0.0% | 0.0% | 0.2% |
| Other | 0.2% | 0.4% | 0.6% |
| Two Or More | 2.2% | 3.3% | 4.3% |
| Hispanic | 6.7% | 5.6% | 19.3% |
Gender in Arab
See the full breakdown
Arab is 51.2% female with 4,442 female residents.
Arab is 48.8% male with 4,236 male residents.
| Gender | Arab | AL | USA |
|---|---|---|---|
| Female | 51.2% | 51.4% | 50.5% |
| Male | 48.8% | 48.6% | 49.5% |
Highest level of educational attainment in Arab for adults over 25
See the full breakdown
3.0% of adults in Arab completed < 9th grade.
7.0% of adults in Arab completed 9-12th grade.
29.0% of adults in Arab completed high school / ged.
24.0% of adults in Arab completed some college.
12.0% of adults in Arab completed associate's degree.
17.0% of adults in Arab completed bachelor's degree.
7.0% of adults in Arab completed master's degree.
1.0% of adults in Arab completed professional degree.
0.0% of adults in Arab completed doctorate degree.
| Education | Arab | AL | USA |
|---|---|---|---|
| < 9th Grade | 3.0% | 4.0% | 4.0% |
| 9-12th Grade | 7.0% | 8.0% | 6.0% |
| High School / GED | 29.0% | 30.0% | 26.0% |
| Some College | 24.0% | 21.0% | 19.0% |
| Associate's Degree | 12.0% | 9.0% | 9.0% |
| Bachelor's Degree | 17.0% | 17.0% | 22.0% |
| Master's Degree | 7.0% | 8.0% | 10.0% |
| Professional Degree | 1.0% | 2.0% | 2.0% |
| Doctorate Degree | 0.0% | 1.0% | 2.0% |
Household Income For Arab, Alabama
See the full breakdown
5.9% of households in Arab earn Less than $10,000.
4.5% of households in Arab earn $10,000 to $14,999.
9.7% of households in Arab earn $15,000 to $24,999.
8.7% of households in Arab earn $25,000 to $34,999.
12.2% of households in Arab earn $35,000 to $49,999.
14.2% of households in Arab earn $50,000 to $74,999.
13.4% of households in Arab earn $75,000 to $99,999.
16.2% of households in Arab earn $100,000 to $149,999.
7.6% of households in Arab earn $150,000 to $199,999.
7.7% of households in Arab earn $200,000 or more.
| Income | Arab | AL | USA |
|---|---|---|---|
| Less than $10,000 | 5.9% | 6.3% | 5.0% |
| $10,000 to $14,999 | 4.5% | 4.7% | 3.4% |
| $15,000 to $24,999 | 9.7% | 8.8% | 6.3% |
| $25,000 to $34,999 | 8.7% | 8.5% | 6.6% |
| $35,000 to $49,999 | 12.2% | 11.8% | 10.1% |
| $50,000 to $74,999 | 14.2% | 16.7% | 15.5% |
| $75,000 to $99,999 | 13.4% | 12.7% | 12.6% |
| $100,000 to $149,999 | 16.2% | 15.5% | 17.5% |
| $150,000 to $199,999 | 7.6% | 7.4% | 9.6% |
| $200,000 or more | 7.7% | 7.8% | 13.4% |
Source: U.S. Census ACS 5-year estimates (2024)


