Fontana has plenty to offer, but the price of admission usually comes with traffic, sky-high rent, and a calendar that fills itself.
If you want the upside of Fontana without the daily grind, the answer is almost always a good suburb. The catch: not every suburb is worth the move.
So we ranked them. Using Saturday Night Science, we pulled the numbers on every place within commuting distance of Fontana: incomes, home prices, unemployment, schools, the works. The result is a no-nonsense ranking of where you actually want to live.
$157,582 median income · $1,419,513 median home price
 Located in
Orange County, California
Located in
Orange County, California
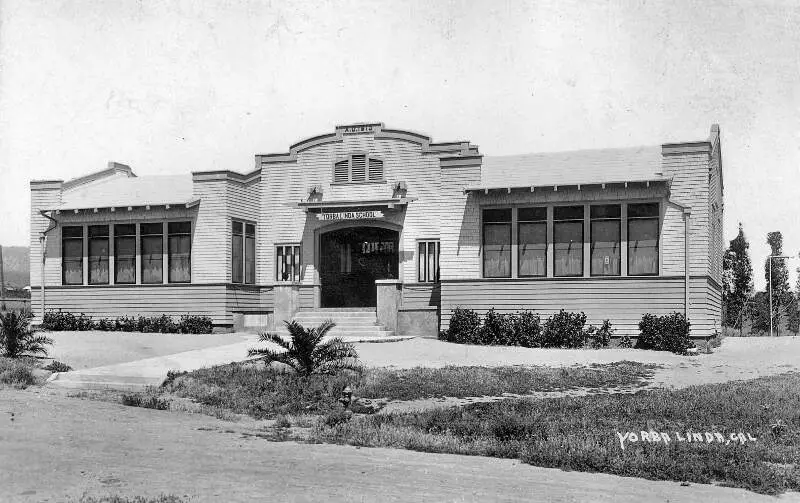
Yorba Linda is always mentioned as one of the best suburbs in the Fontana area. We’ll tell you the good about “Awesome Yorba Linda.”
Everyone here is rich; families average $157,582 a year, which is the 4th highest in the Fontana region. And only 4.7% are out of work. Homes average more than $1,419,513 each.
Data | Crime | Cost of living | Movers
$202,245 median income · $2,343,977 median home price
 Located in
Orange County, California
Located in
Orange County, California
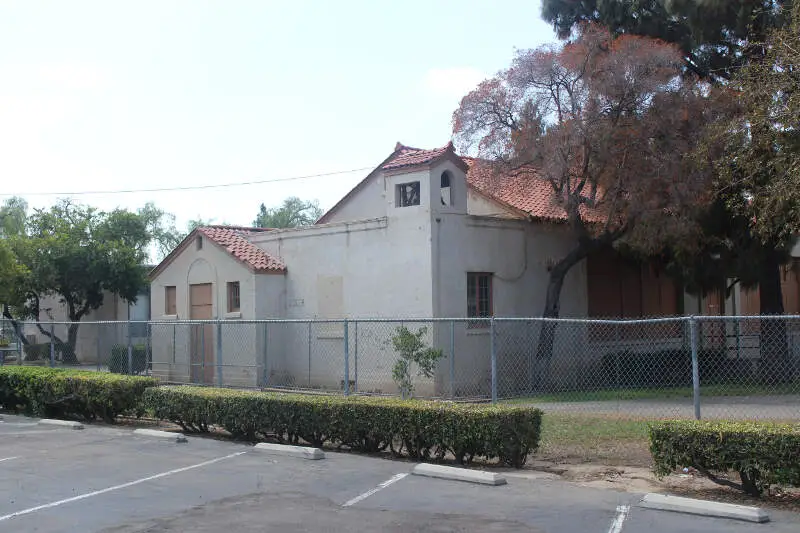
Villa Park is the second best ‘burb we looked at near Fontana for 2026.
It ranks 1st for incomes in the area and only 0.8% of residents lack insurance, good for best.
Data | Crime | Cost of living | Movers
$127,876 median income · $1,142,479 median home price
 Located in
Contra Costa County, California
Located in
Contra Costa County, California
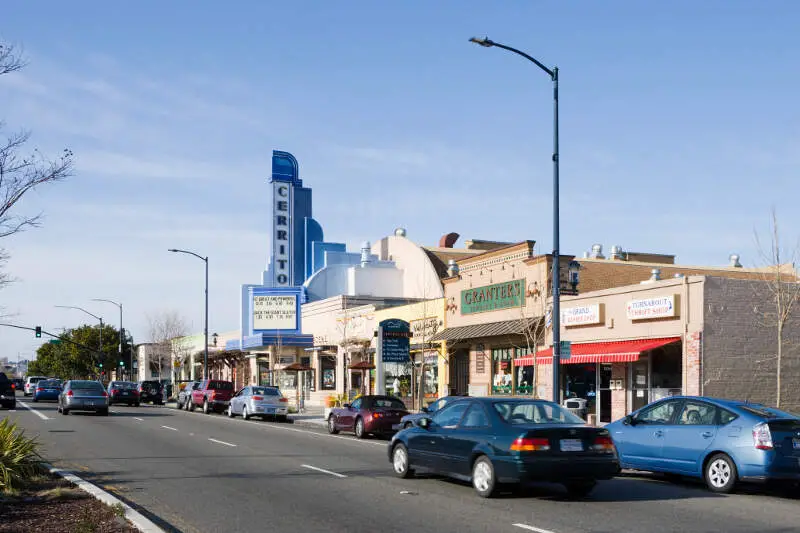
Here in El Cerrito, it’s really safe, and residents are just about as rich as you’ll see in the Fontana metro area.
The bad side? Schools are more crowded, and the cost of living puts a large part of the city out of reach for most families.
But price is based on demand and a lot of people want to live in El Cerrito.
Data | Crime | Cost of living | Movers
$160,069 median income · $949,255 median home price
 Located in
Riverside County, California
Located in
Riverside County, California
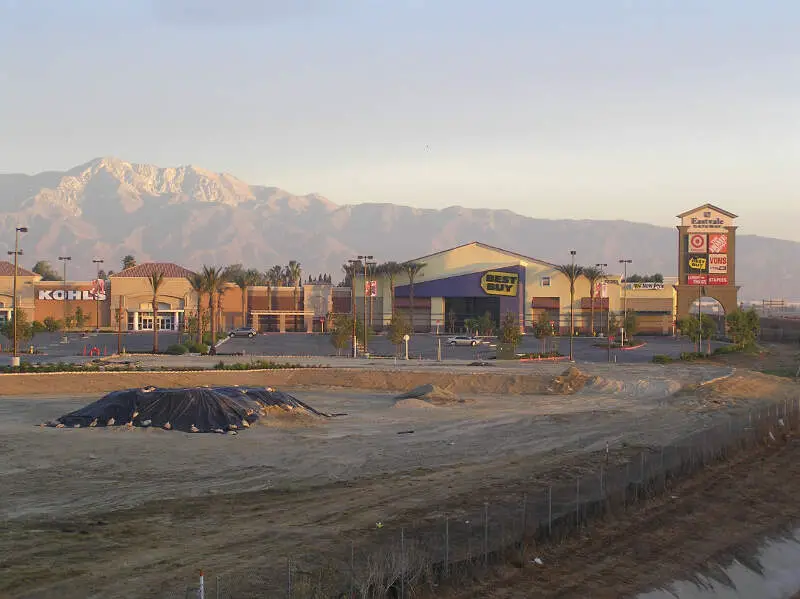
Eastvale ranks as the 4th best suburb of Fontana for 2026.
You won’t find many better places to raise your kids in the region than in Eastvale and the schools are some of the best around.
Data | Crime | Cost of living | Movers
$179,583 median income · $1,399,870 median home price
 Located in
Los Angeles County, California
Located in
Los Angeles County, California
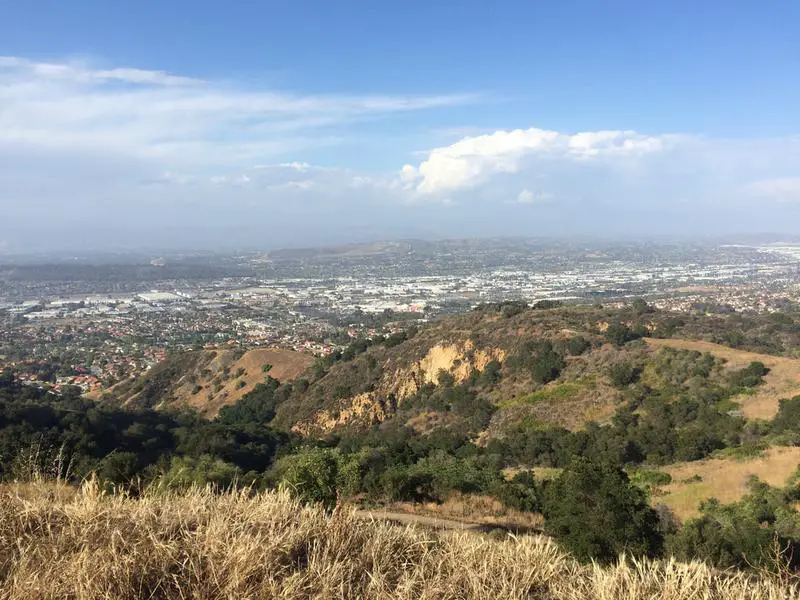
Coming in as the fifth best is La Habra Heights.
La Habra Heights gets kudos for having the 3rd most expensive homes in the Fontana area, where houses sell for an average of $1,399,870. However, the cost of living here is among the highest in the area.
Data | Crime | Cost of living | Movers
$131,129 median income · $1,140,406 median home price
 Located in
Orange County, California
Located in
Orange County, California
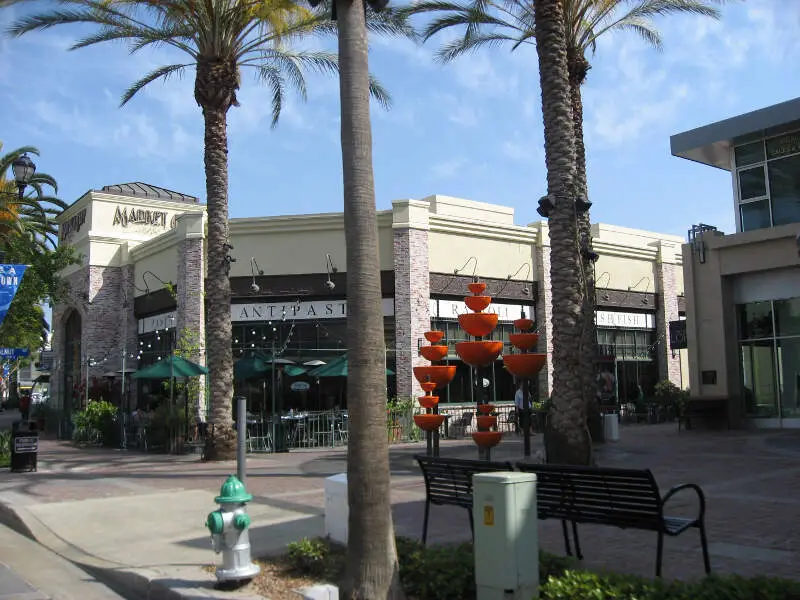
Brea is proud of its 6th place finish on this list. And here’s why.
Most residents have great jobs and the unemployment rate sits at 5.1%.
According to online reports, Brea is quickly becoming one of the more affluent suburbs in the Fontana area, meaning you need to get in soon.
Data | Crime | Cost of living | Movers

$125,647 median income · $1,039,337 median home price
 Located in
Los Angeles County, California
Located in
Los Angeles County, California
The 7th best suburb on our list goes to Claremont.
Claremont schools are some of the best in the region, and crime is really low. The cost of living makes it a lot more desirable for many families, especially first-time home buyers.
And, it’s only 14.4 miles to downtown, which is a good thing.
Data | Crime | Cost of living | Movers

$129,449 median income · $1,197,951 median home price
 Located in
Los Angeles County, California
Located in
Los Angeles County, California
Walnut is growing quickly, and for a good reason. Crime is far below average, and most residents are gainfully employed. Even the cost of living is reasonable.
A solid 4.0% of people lack insurance, good for 10th in the area.
Data | Crime | Cost of living | Movers
$115,929 median income · $1,117,228 median home price
 Located in
Orange County, California
Located in
Orange County, California
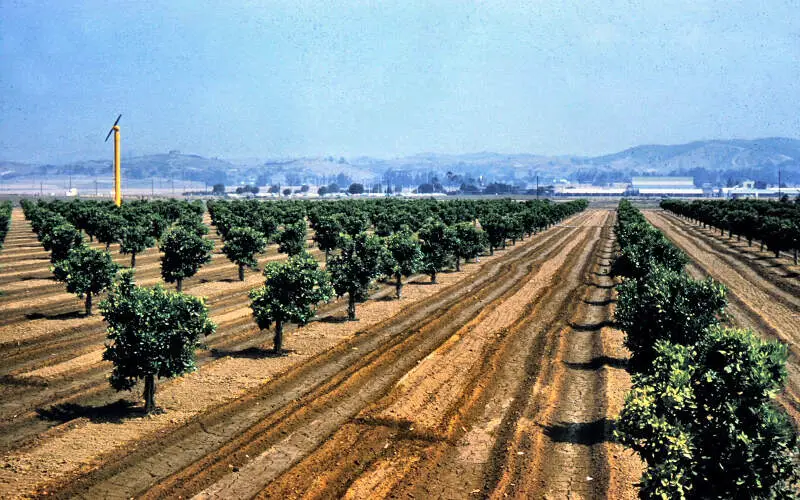
Is ‘Everything Better In Placentia?’
Almost.
It placed 9th on our list thanks to the fact that it’s really expensive to live here, but the schools are great, so you get what you pay for in that regard.
Data | Crime | Cost of living | Movers
$108,281 median income · $1,028,880 median home price
 Located in
Los Angeles County, California
Located in
Los Angeles County, California
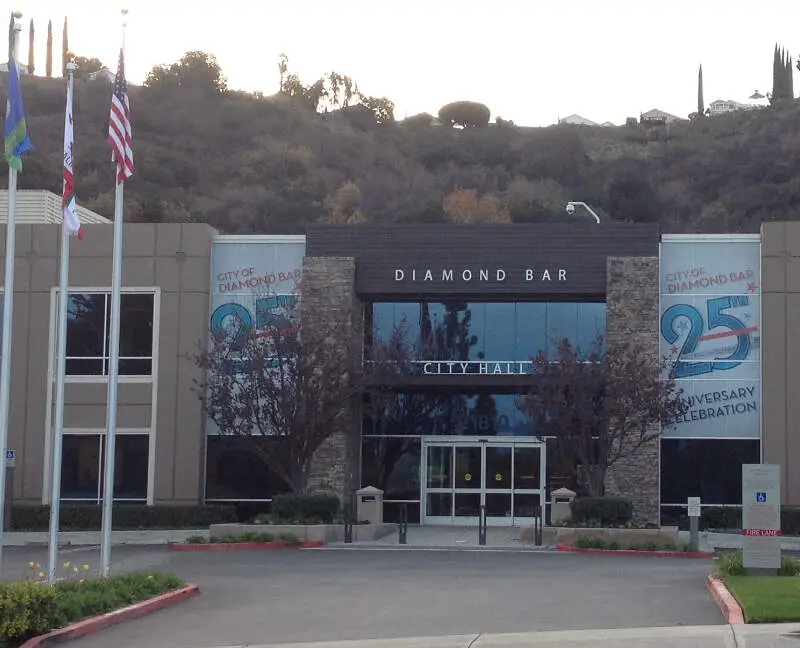
And rounding out the top ten for 2026 is Diamond Bar.
This city is far above average in every category, and the best part? It’s far more affordable than the other cities listed above. So, you get a big bang for your buck here.
Data | Crime | Cost of living | Movers
The receipts
Compare the top ten
Pick a metric. The bars rescale. The red line is California’s statewide median.
California statewide median: $99,122
California statewide median: $774,582
California statewide median: 6.6%
California statewide median: 12.0%
On the map
Where the best Fontana suburbs are
Saturday Night Science
Methodology: How we determined the best suburbs around Fontana for 2026
Figuring out the best suburbs around Fontana was simple. We used Saturday Night Science to find things people like about living in the suburbs and then locate the suburbs with those things.
We analyzed the newest American Community Survey data for 2020-2024 to research each suburb. We decided upon the following criteria:
- Low unemployment rate
- High median household incomes
- Population density (lots of things to do)
- High home values
- A lot of college-educated people
- Low poverty
- High rate of insured families
We defined a suburb as being within 30 miles of Fontana.
Additionally, we limited the analysis to places that have over 5,000 people. This left us with a grand total of 44 suburbs to evaluate around Fontana.
We ranked each place with scores from 1 to 44 in each category, where 1 was the best.
Next, we averaged the rankings for each place to create a quality-of-life index.
Finally, we crowned the city with the best quality of life index, the “Best Suburb near Fontana.” We’re lookin’ at you, Yorba Linda.
This result may differ from our state-wide data as we did not include commute times and crime for this analysis to allow for a more extensive selection of suburbs.
We updated the data for 2026. This report is our eleventh time ranking the best Fontana suburbs. Skip to the end to see the list of all the suburbs ranked from best to worst.
The full plate
Table: Best Fontana Suburbs
Click any column to sort. Search by city name.
| Rank | City | Suburb Score | Population | Median Income | Median Home Price |
|---|---|---|---|---|---|
| 1 | Yorba Linda | 6.71 | 67,170 | $157,582 | $1,419,513 |
| 2 | Villa Park | 6.86 | 5,748 | $202,245 | $2,343,977 |
| 3 | El Cerrito | 8.00 | 25,994 | $127,876 | $1,142,479 |
| 4 | Eastvale | 8.67 | 70,633 | $160,069 | $949,255 |
| 5 | La Habra Heights | 9.43 | 5,478 | $179,583 | $1,399,870 |
| 6 | Brea | 9.50 | 47,469 | $131,129 | $1,140,406 |
| 7 | Claremont | 10.43 | 36,595 | $125,647 | $1,039,337 |
| 8 | Walnut | 11.57 | 27,611 | $129,449 | $1,197,951 |
| 9 | Placentia | 13.00 | 52,826 | $115,929 | $1,117,228 |
| 10 | Diamond Bar | 13.43 | 53,355 | $108,281 | $1,028,880 |
| 11 | Glendora | 15.36 | 50,926 | $113,569 | $893,350 |
| 12 | Rancho Cucamonga | 15.57 | 175,411 | $111,895 | $792,765 |
| 13 | La Verne | 16.64 | 30,600 | $103,761 | $951,548 |
| 14 | Norco | 16.64 | 25,054 | $127,566 | $918,950 |
| 15 | Upland | 16.86 | 79,257 | $105,830 | $825,789 |
| 16 | San Dimas | 16.93 | 33,789 | $105,321 | $927,055 |
| 17 | Chino Hills | 18.14 | 77,927 | $126,334 | $996,262 |
| 18 | Corona | 19.00 | 159,670 | $109,242 | $764,386 |
| 19 | Duarte | 19.50 | 22,184 | $105,483 | $801,444 |
| 20 | Calimesa | 20.14 | 10,902 | $87,181 | $566,185 |
| 21 | West Covina | 20.43 | 107,037 | $101,065 | $852,373 |
| 22 | Covina | 20.86 | 49,888 | $98,671 | $804,341 |
| 23 | Redlands | 21.29 | 73,375 | $105,041 | $636,035 |
| 24 | Anaheim | 24.00 | 344,521 | $95,227 | $950,504 |
| 25 | Chino | 24.29 | 92,652 | $104,682 | $761,426 |
| 26 | Grand Terrace | 25.00 | 13,078 | $83,628 | $587,468 |
| 27 | Azusa | 26.57 | 49,031 | $90,721 | $715,154 |
| 28 | Loma Linda | 27.43 | 25,122 | $82,353 | $640,816 |
| 29 | Riverside | 27.57 | 319,069 | $91,045 | $646,784 |
| 30 | Yucaipa | 28.43 | 54,421 | $90,794 | $570,222 |
| 31 | La Puente | 28.57 | 37,142 | $86,602 | $723,135 |
| 32 | Baldwin Park | 28.86 | 70,138 | $80,663 | $722,511 |
| 33 | Ontario | 29.86 | 180,547 | $88,941 | $672,742 |
| 34 | Jurupa Valley | 30.33 | 107,011 | $97,550 | $672,514 |
| 35 | Moreno Valley | 30.57 | 211,666 | $93,222 | $551,284 |
| 36 | Montclair | 31.86 | 37,810 | $77,659 | $660,566 |
| 37 | Pomona | 32.07 | 147,943 | $79,479 | $690,986 |
| 38 | Rialto | 32.29 | 104,143 | $88,857 | $588,566 |
| 39 | Highland | 33.00 | 56,675 | $77,120 | $545,940 |
| 40 | San Bernardino | 35.57 | 222,724 | $67,415 | $487,988 |
| 41 | Colton | 36.36 | 53,772 | $71,208 | $493,150 |
| 42 | Perris | 37.14 | 80,511 | $88,911 | $543,988 |
| 43 | Victorville | 38.57 | 137,627 | $74,410 | $436,009 |
| 44 | Hesperia | 39.86 | 100,775 | $72,160 | $460,687 |
Source: U.S. Census ACS 2020-2024. 44 suburbs within 30 miles of Fontana.
Summary
Summary: Welcome to the Best Fontana ‘Burbs of 2026
We said it once, and we’ll say it again–life in the big city isn’t for everyone. At least not all the time.
The best suburbs of Fontana are Yorba Linda, Villa Park, El Cerrito, Eastvale, La Habra Heights, Brea, Claremont, Walnut, Placentia, and Diamond Bar.
So if you’re craving the amenities of a larger city like Fontana but don’t want to deal with the drawbacks, one of these suburbs might be for you. Not sold on California? Take the two-minute Find Your Place quiz and see which state actually fits you.
Questions and answers
Best Suburbs Of Fontana FAQs
What is the best suburb of Fontana?
Yorba Linda is the best suburb of Fontana for 2026, according to Saturday Night Science. Villa Park and El Cerrito are next.
What are the best suburbs of Fontana?
The best suburbs of Fontana are Yorba Linda, Villa Park, El Cerrito, Eastvale, La Habra Heights, Brea, Claremont, Walnut, Placentia, and Diamond Bar. We ranked all 44 places within commuting range.
How expensive is Yorba Linda?
The median household income in Yorba Linda is $157,582 and the median home costs $1,419,513. Top suburbs rarely come cheap; that is part of how they got there.
What counts as a suburb of Fontana?
Any place within 30 miles of Fontana qualifies. 44 towns fit that circle, and every one of them got scored.
How do you rank Fontana suburbs?
Each suburb is scored on income, home values, density, unemployment, education, insurance coverage, and poverty, using Census American Community Survey data. The best combined score, Yorba Linda, takes the crown.