Compare San Bernardino to…
San Bernardino SnackAbility
Overall SnackAbility
Crime in San Bernardino summary. We use data from the FBI to determine the crime rates in San Bernardino. Key points include:
There were 8,511 total crimes in San Bernardino in the last reporting year.
The overall crime rate per 100,000 people in San Bernardino is 3,794.8 / 100k people.
The violent crime rate per 100,000 people in San Bernardino is 897.1 / 100k people.
The property crime rate per 100,000 people in San Bernardino is 2,897.7 / 100k people.
Overall, crime in San Bernardino is 79.06% above the national average.
Total Crimes
Above National Average
Crime In San Bernardino Comparison Table
| Statistic | Count Raw |
San Bernardino / 100k People |
California / 100k People |
National / 100k People |
|---|---|---|---|---|
| Total Crimes Per 100K | 8,511 | 3,794.8 | 2,564.5 | 2,119.2 |
| Violent Crime | 2,012 | 897.1 | 486.0 | 359.0 |
| Murder | 25 | 11.1 | 4.5 | 5.0 |
| Robbery | 541 | 241.2 | 119.1 | 61.0 |
| Aggravated Assault | 1,334 | 594.8 | 325.8 | 256.0 |
| Property Crime | 6,499 | 2,897.7 | 2,078.4 | 1,760.0 |
| Burglary | 1,021 | 455.2 | 305.8 | 229.0 |
| Larceny | 3,762 | 1,677.3 | 1,345.2 | 1,272.0 |
| Car Theft | 1,716 | 765.1 | 427.5 | 259.0 |
Source: FBI Uniform Crime Reporting (2024)
Cost of living in San Bernardino summary. We use data on the cost of living to determine how expensive it is to live in San Bernardino. Real estate prices drive most of the variance in cost of living around California. Key points include:
The cost of living in San Bernardino is 125 with 100 being average.
The cost of living in San Bernardino is 1.2x higher than the national average.
The median home value in San Bernardino is $487,988.
The median income in San Bernardino is $67,415.
San Bernardino's Overall Cost Of Living
Higher Than The National Average
Cost Of Living In San Bernardino Comparison Table
| Living Expense | San Bernardino | California | National Average |
|---|---|---|---|
| Overall | 125 | 142 | 100 |
| Services | 108 | 110 | 100 |
| Groceries | 119 | 118 | 100 |
| Health | 135 | 197 | 100 |
| Housing | 120 | 120 | 100 |
| Transportation | 118 | 121 | 100 |
| Utilities | 124 | 121 | 100 |
Source: Cost of living index, normalized to US average = 100
San Bernardino, CA Weather
The average high in San Bernardino is 76.0° and the average low is 48.8°.
There are 22.0 days of precipitation each year.
Expect an average of 14.2 inches of precipitation each year with 9.0 inches of snow.
| Stat | San Bernardino |
|---|---|
| Average Annual High | 76.0 |
| Average Annual Low | 48.8 |
| Annual Precipitation Days | 22.0 |
| Average Annual Precipitation | 14.2 |
| Average Annual Snowfall | 9.0 |
Average High
Days of Rain
Source: NOAA climate normals (30-year)
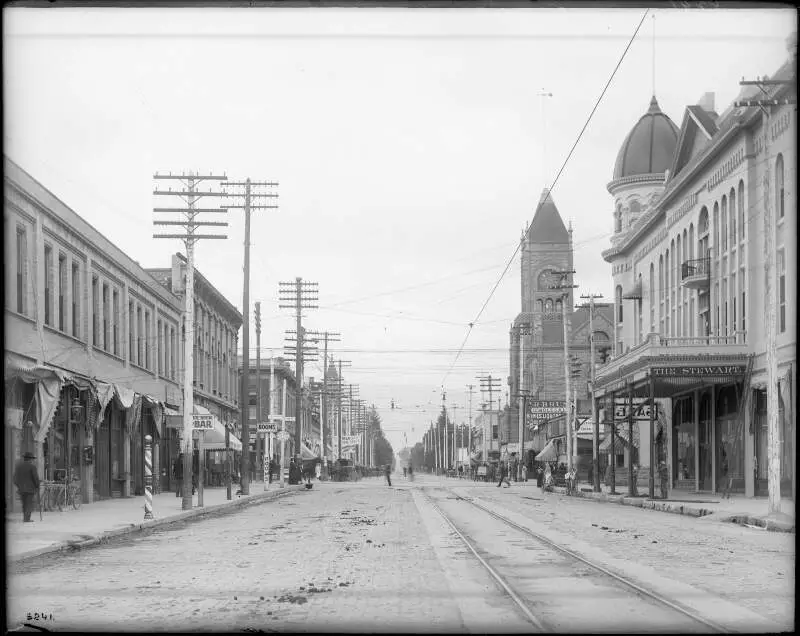
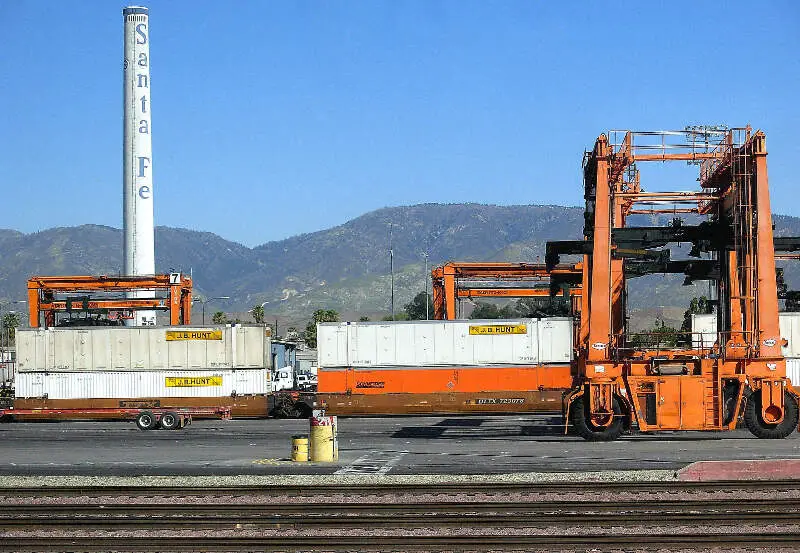
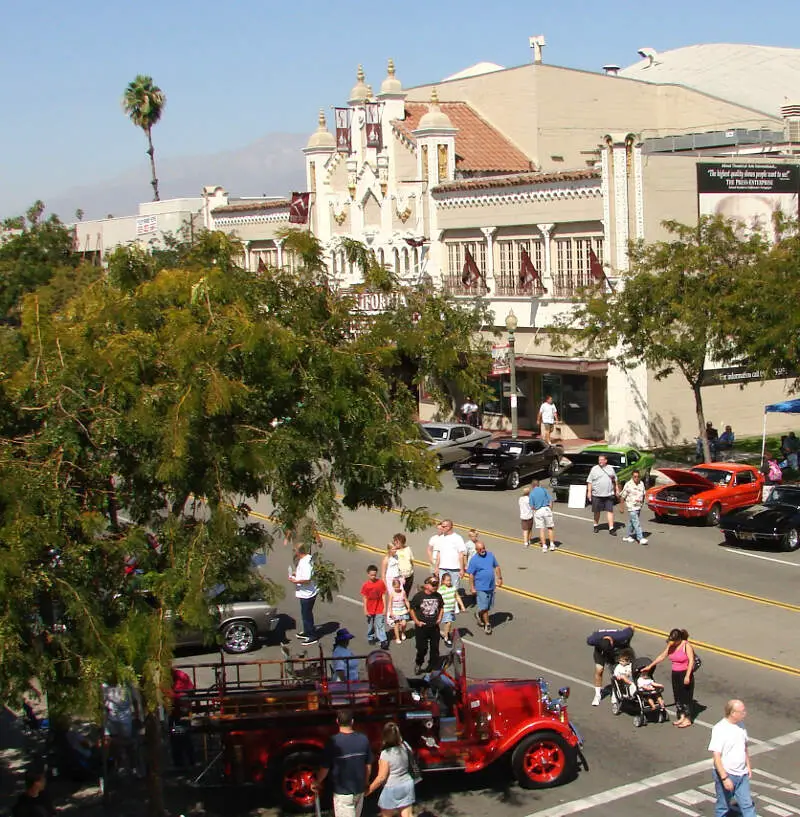
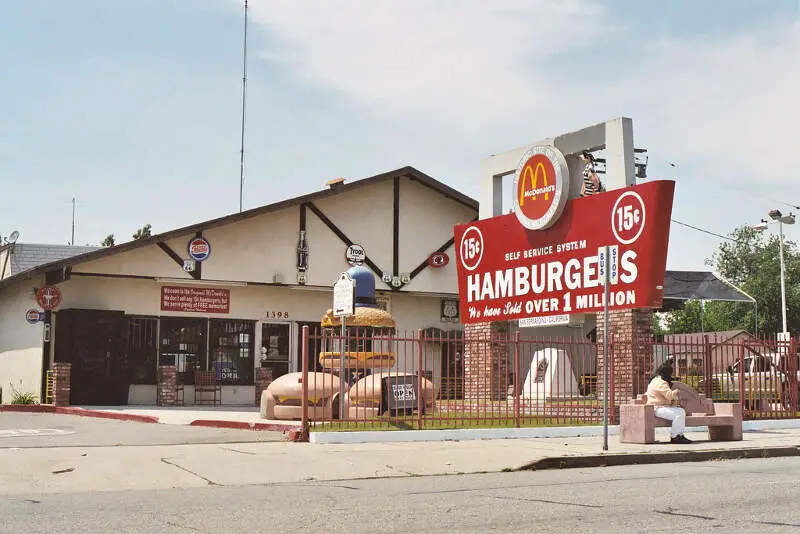
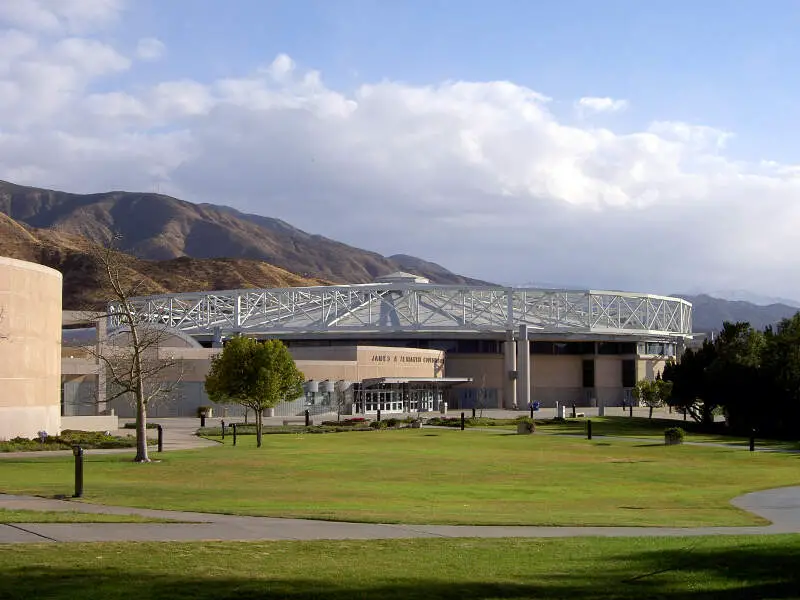
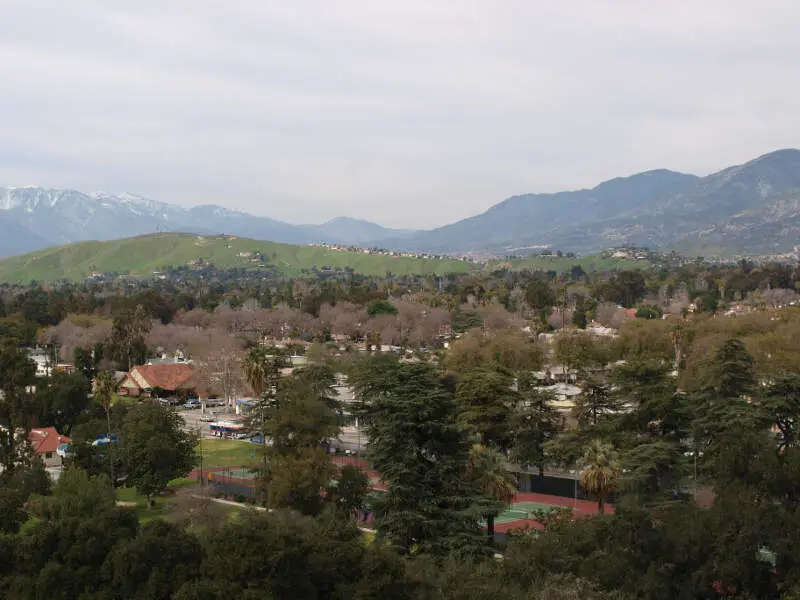
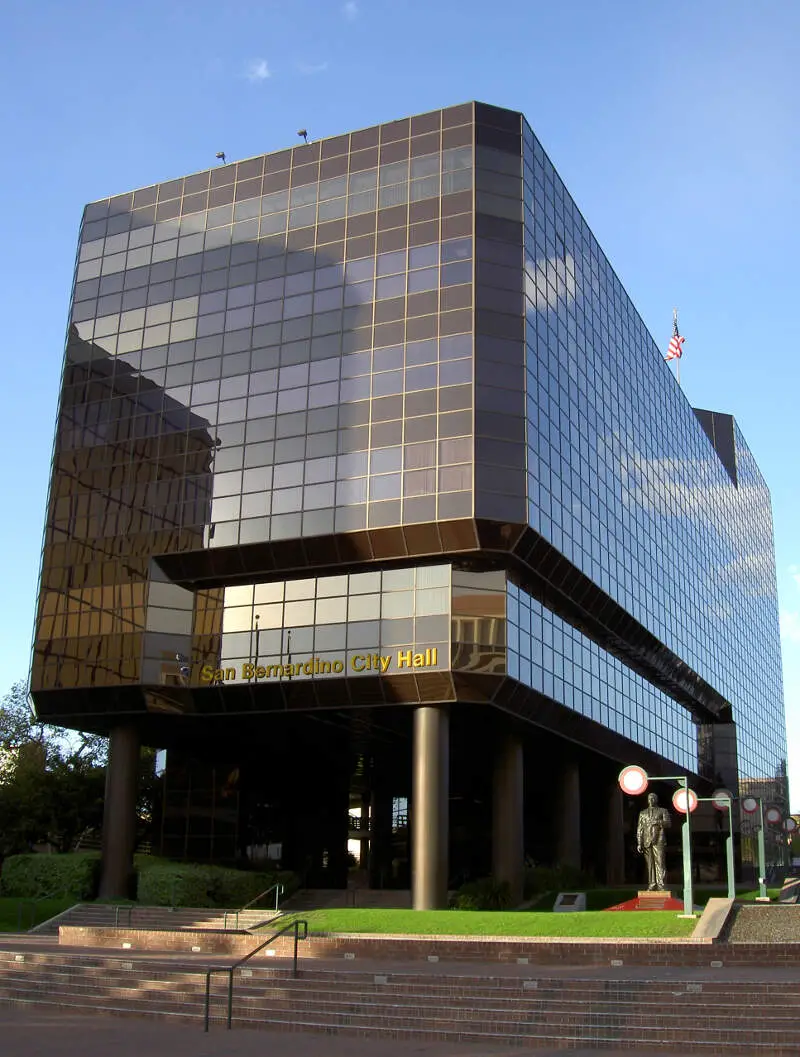
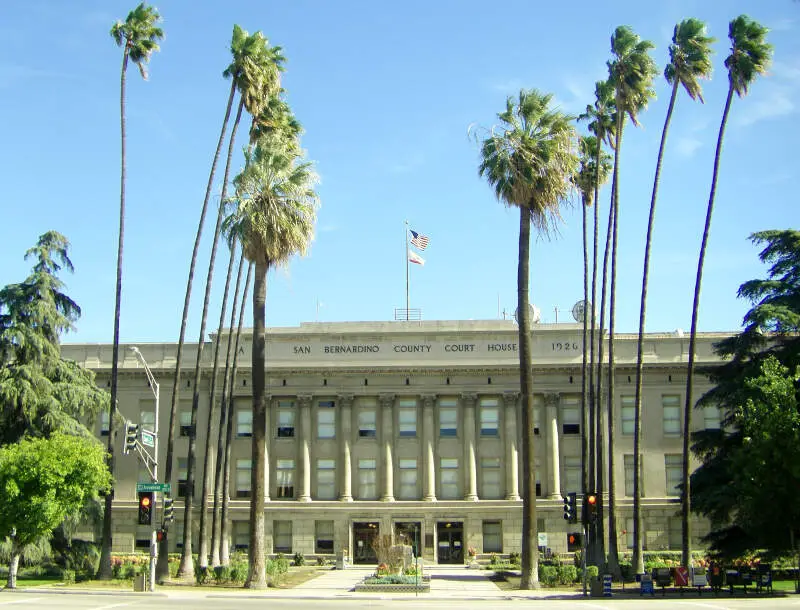
San Bernardino, CA Photos
3 Reviews & Comments About San Bernardino

Lol I live in San Bernardino and trust me it's getting worse by the day just the other day they found a dead girl stuffed in a wooden box with her head chopped off
S**t man i thought San Bernardino was a nice place but now dat i think about it i hear gun shots at night i live in muscoy where all the plugs ar at
It's pretty bad these days. Used to be better. There are a few nice areas left.
Rankings & Articles For San Bernardino


Locations Around San Bernardino
Map Of San Bernardino, CA
Best Places Around San Bernardino
Rancho Cucamonga, CA
Population 175,411
Grand Terrace, CA
Population 13,078
Woodcrest, CA
Population 17,368
Loma Linda, CA
Population 25,122
Redlands, CA
Population 73,375
Fontana, CA
Population 214,169
Bloomington, CA
Population 25,698
Highland, CA
Population 56,675
Yucaipa, CA
Population 54,421
Oak Hills, CA
Population 9,013
San Bernardino Demographics And Statistics
Population over time in San Bernardino
The current population in San Bernardino is 222,724. The population has increased 6.5% from 2010.
| Year | Population | % Change |
|---|---|---|
| 2024 | 222,724 | 0.4% |
| 2023 | 221,774 | 0.3% |
| 2022 | 221,041 | 0.1% |
| 2021 | 220,821 | 1.9% |
| 2020 | 216,784 | 0.3% |
| 2019 | 216,089 | 0.4% |
| 2018 | 215,182 | -0.0% |
| 2017 | 215,252 | 0.3% |
| 2016 | 214,581 | 0.2% |
| 2015 | 214,112 | 0.5% |
| 2014 | 213,044 | 0.7% |
| 2013 | 211,528 | 0.4% |
| 2012 | 210,624 | 0.2% |
| 2011 | 210,100 | 0.4% |
| 2010 | 209,174 | - |
Race / Ethnicity in San Bernardino
See the full breakdown
San Bernardino is:
11.9% White with 26,422 White residents.
10.6% African American with 23,592 African American residents.
0.2% American Indian with 522 American Indian residents.
3.6% Asian with 7,968 Asian residents.
0.4% Hawaiian with 950 Hawaiian residents.
0.5% Other with 1,051 Other residents.
2.6% Two Or More with 5,850 Two Or More residents.
70.2% Hispanic with 156,369 Hispanic residents.
| Race | San Bernardino | CA | USA |
|---|---|---|---|
| White | 11.9% | 33.8% | 57.4% |
| African American | 10.6% | 5.2% | 11.9% |
| American Indian | 0.2% | 0.3% | 0.5% |
| Asian | 3.6% | 15.3% | 5.9% |
| Hawaiian | 0.4% | 0.3% | 0.2% |
| Other | 0.5% | 0.6% | 0.6% |
| Two Or More | 2.6% | 4.4% | 4.3% |
| Hispanic | 70.2% | 40.2% | 19.3% |
Gender in San Bernardino
See the full breakdown
San Bernardino is 50.0% female with 111,357 female residents.
San Bernardino is 50.0% male with 111,366 male residents.
| Gender | San Bernardino | CA | USA |
|---|---|---|---|
| Female | 50.0% | 50.1% | 50.5% |
| Male | 50.0% | 49.9% | 49.5% |
Highest level of educational attainment in San Bernardino for adults over 25
See the full breakdown
12.0% of adults in San Bernardino completed < 9th grade.
13.0% of adults in San Bernardino completed 9-12th grade.
36.0% of adults in San Bernardino completed high school / ged.
19.0% of adults in San Bernardino completed some college.
7.0% of adults in San Bernardino completed associate's degree.
9.0% of adults in San Bernardino completed bachelor's degree.
3.0% of adults in San Bernardino completed master's degree.
1.0% of adults in San Bernardino completed professional degree.
0.0% of adults in San Bernardino completed doctorate degree.
| Education | San Bernardino | CA | USA |
|---|---|---|---|
| < 9th Grade | 12.0% | 8.0% | 4.0% |
| 9-12th Grade | 13.0% | 7.0% | 6.0% |
| High School / GED | 36.0% | 20.0% | 26.0% |
| Some College | 19.0% | 19.0% | 19.0% |
| Associate's Degree | 7.0% | 8.0% | 9.0% |
| Bachelor's Degree | 9.0% | 23.0% | 22.0% |
| Master's Degree | 3.0% | 10.0% | 10.0% |
| Professional Degree | 1.0% | 3.0% | 2.0% |
| Doctorate Degree | 0.0% | 2.0% | 2.0% |
Household Income For San Bernardino, California
See the full breakdown
5.1% of households in San Bernardino earn Less than $10,000.
4.4% of households in San Bernardino earn $10,000 to $14,999.
7.5% of households in San Bernardino earn $15,000 to $24,999.
8.4% of households in San Bernardino earn $25,000 to $34,999.
12.9% of households in San Bernardino earn $35,000 to $49,999.
16.3% of households in San Bernardino earn $50,000 to $74,999.
13.3% of households in San Bernardino earn $75,000 to $99,999.
18.5% of households in San Bernardino earn $100,000 to $149,999.
7.8% of households in San Bernardino earn $150,000 to $199,999.
5.8% of households in San Bernardino earn $200,000 or more.
| Income | San Bernardino | CA | USA |
|---|---|---|---|
| Less than $10,000 | 5.1% | 4.5% | 5.0% |
| $10,000 to $14,999 | 4.4% | 2.9% | 3.4% |
| $15,000 to $24,999 | 7.5% | 5.0% | 6.3% |
| $25,000 to $34,999 | 8.4% | 5.3% | 6.6% |
| $35,000 to $49,999 | 12.9% | 8.1% | 10.1% |
| $50,000 to $74,999 | 16.3% | 13.0% | 15.5% |
| $75,000 to $99,999 | 13.3% | 11.6% | 12.6% |
| $100,000 to $149,999 | 18.5% | 17.8% | 17.5% |
| $150,000 to $199,999 | 7.8% | 11.3% | 9.6% |
| $200,000 or more | 5.8% | 20.5% | 13.4% |
Source: U.S. Census ACS 5-year estimates (2024)


