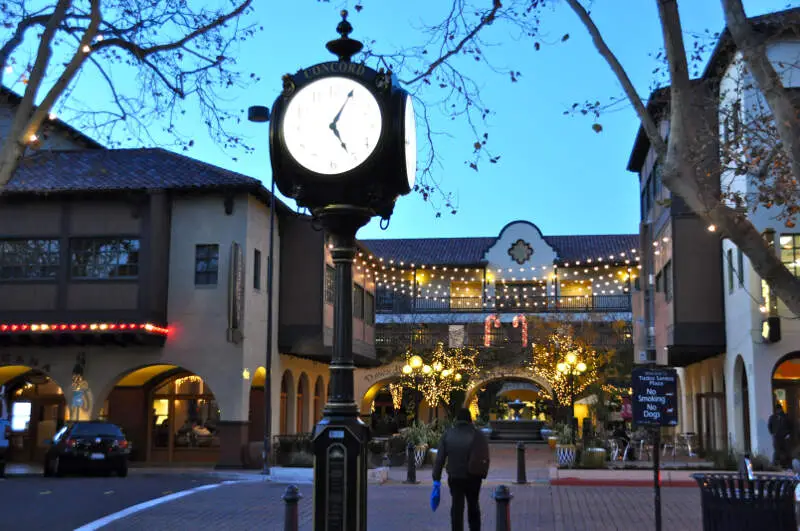
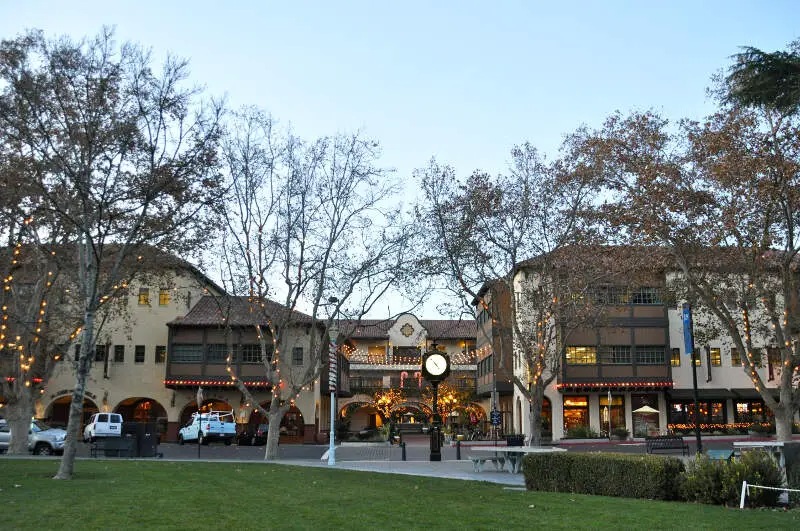
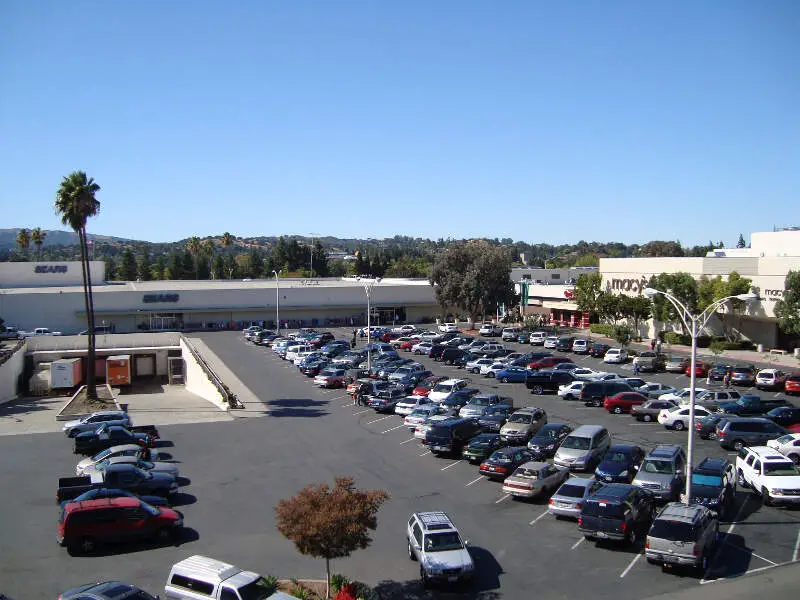
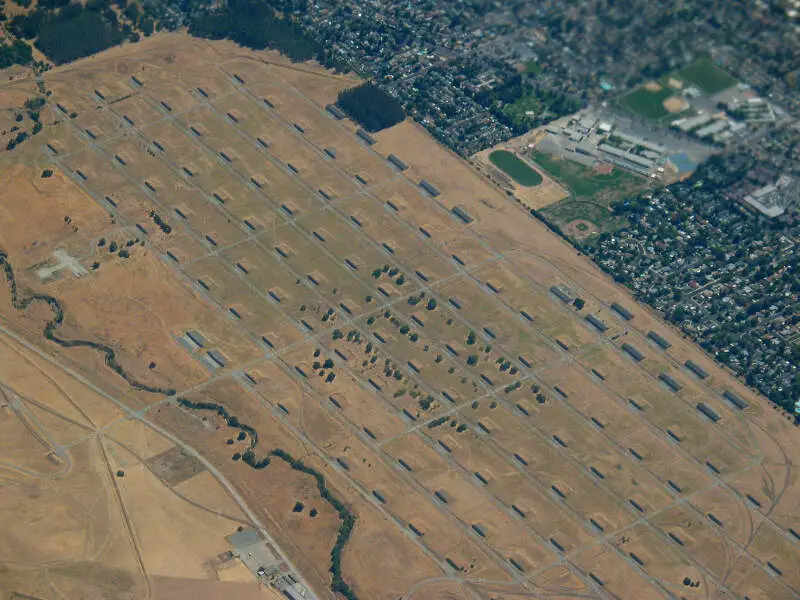
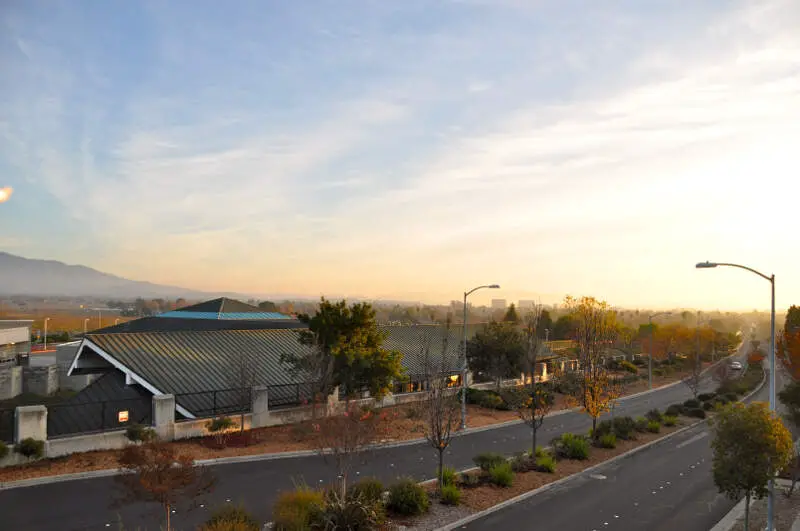
Concord, CA
Demographics And Statistics
Living In Concord, California Summary
Life in Concord research summary. HomeSnacks has been using Saturday Night Science to research the quality of life in Concord over the past nine years using Census, FBI, Zillow, and other primary data sources. Based on the most recently available data, we found the following about life in Concord:
The population in Concord is 124,260.
The median home value in Concord is $715,754.
The median income in Concord is $109,195.
The cost of living in Concord is 168 which is 1.7x higher than the national average.
The median rent in Concord is $2,226.
The unemployment rate in Concord is 4.9%.
The poverty rate in Concord is 8.9%.
The average high in Concord is 70.4° and the average low is 48.6°.
Concord SnackAbility
Overall SnackAbility
Concord, CA Crime Report
Crime in Concord summary. We use data from the FBI to determine the crime rates in Concord. Key points include:
There were 4,090 total crimes in Concord in the last reporting year.
The overall crime rate per 100,000 people in Concord is 3,370.7 / 100k people.
The violent crime rate per 100,000 people in Concord is 484.6 / 100k people.
The property crime rate per 100,000 people in Concord is 2,886.1 / 100k people.
Overall, crime in Concord is 59.05% above the national average.
Total Crimes
Above National Average
Crime In Concord Comparison Table
| Statistic | Count Raw |
Concord / 100k People |
California / 100k People |
National / 100k People |
|---|---|---|---|---|
| Total Crimes Per 100K | 4,090 | 3,370.7 | 2,564.5 | 2,119.2 |
| Violent Crime | 588 | 484.6 | 486.0 | 359.0 |
| Murder | 3 | 2.5 | 4.5 | 5.0 |
| Robbery | 175 | 144.2 | 119.1 | 61.0 |
| Aggravated Assault | 360 | 296.7 | 325.8 | 256.0 |
| Property Crime | 3,502 | 2,886.1 | 2,078.4 | 1,760.0 |
| Burglary | 515 | 424.4 | 305.8 | 229.0 |
| Larceny | 2,361 | 1,945.8 | 1,345.2 | 1,272.0 |
| Car Theft | 626 | 515.9 | 427.5 | 259.0 |
Concord, CA Cost Of Living
Cost of living in Concord summary. We use data on the cost of living to determine how expensive it is to live in Concord. Real estate prices drive most of the variance in cost of living around California. Key points include:
The cost of living in Concord is 168 with 100 being average.
The cost of living in Concord is 1.7x higher than the national average.
The median home value in Concord is $715,754.
The median income in Concord is $109,195.
Concord's Overall Cost Of Living
Higher Than The National Average
Cost Of Living In Concord Comparison Table
| Living Expense | Concord | California | National Average | |
|---|---|---|---|---|
| Overall | 168 | 141 | 100 | |
| Services | 115 | 110 | 100 | |
| Groceries | 117 | 112 | 100 | |
| Health | 123 | 110 | 100 | |
| Housing | 278 | 195 | 100 | |
| Transportation | 128 | 125 | 100 | |
| Utilities | 135 | 128 | 100 | |
Concord, CA Weather
The average high in Concord is 70.4° and the average low is 48.6°.
There are 41.7 days of precipitation each year.
Expect an average of 21.0 inches of precipitation each year with 0.2 inches of snow.
| Stat | Concord |
|---|---|
| Average Annual High | 70.4 |
| Average Annual Low | 48.6 |
| Annual Precipitation Days | 41.7 |
| Average Annual Precipitation | 21.0 |
| Average Annual Snowfall | 0.2 |
Average High
Days of Rain
Concord, CA Photos

1 Reviews & Comments About Concord
/5

HomeSnacks User - 2018-07-15 05:28:16.140599
I lived near Concord and aside from the movie theater there it is a town that I am not that fond of. It border Pleasant Hill and Sun Valley Mall, but is kind of run down for the most part. The actual down town area is kind of small and different from the rest of the city.
Favorite place is the Movie theater there. Least Favorite place is around the bart station and it's a city that's kind of difficult to navigate if you take a wrong turn.
Rankings for Concord in California


Locations Around Concord
Map Of Concord, CA
Best Places Around Concord
Piedmont, CA
Population 11,012
San Ramon, CA
Population 85,734
Kensington, CA
Population 5,292
Dublin, CA
Population 70,542
Mountain View, CA
Population 82,363
Lafayette, CA
Population 25,277
Danville, CA
Population 43,426
Hercules, CA
Population 26,245
Orinda, CA
Population 19,472
American Canyon, CA
Population 21,698
Concord Demographics And Statistics
Population over time in Concord
The current population in Concord is 124,260. The population has increased 2.4% from 2010.
| Year | Population | % Change |
|---|---|---|
| 2023 | 124,260 | -0.6% |
| 2022 | 125,007 | -0.6% |
| 2021 | 125,769 | -2.7% |
| 2020 | 129,227 | 0.0% |
| 2019 | 129,183 | 0.3% |
| 2018 | 128,758 | 0.5% |
| 2017 | 128,160 | 1.0% |
| 2016 | 126,938 | 0.5% |
| 2015 | 126,268 | 1.0% |
| 2014 | 125,017 | 1.1% |
| 2013 | 123,658 | 0.8% |
| 2012 | 122,683 | 0.6% |
| 2011 | 121,989 | 0.5% |
| 2010 | 121,326 | - |
Race / Ethnicity in Concord
Concord is:
42.7% White with 53,013 White residents.
3.6% African American with 4,513 African American residents.
0.1% American Indian with 175 American Indian residents.
13.3% Asian with 16,476 Asian residents.
0.2% Hawaiian with 284 Hawaiian residents.
0.8% Other with 961 Other residents.
7.0% Two Or More with 8,720 Two Or More residents.
32.3% Hispanic with 40,118 Hispanic residents.
| Race | Concord | CA | USA |
|---|---|---|---|
| White | 42.7% | 34.6% | 58.2% |
| African American | 3.6% | 5.3% | 12.0% |
| American Indian | 0.1% | 0.3% | 0.5% |
| Asian | 13.3% | 15.1% | 5.7% |
| Hawaiian | 0.2% | 0.3% | 0.2% |
| Other | 0.8% | 0.5% | 0.5% |
| Two Or More | 7.0% | 4.1% | 3.9% |
| Hispanic | 32.3% | 39.8% | 19.0% |
Gender in Concord
Concord is 49.9% female with 62,044 female residents.
Concord is 50.1% male with 62,215 male residents.
| Gender | Concord | CA | USA |
|---|---|---|---|
| Female | 49.9% | 50.0% | 50.5% |
| Male | 50.1% | 50.0% | 49.5% |
Highest level of educational attainment in Concord for adults over 25
8.0% of adults in Concord completed < 9th grade.
5.0% of adults in Concord completed 9-12th grade.
19.0% of adults in Concord completed high school / ged.
21.0% of adults in Concord completed some college.
9.0% of adults in Concord completed associate's degree.
26.0% of adults in Concord completed bachelor's degree.
9.0% of adults in Concord completed master's degree.
2.0% of adults in Concord completed professional degree.
1.0% of adults in Concord completed doctorate degree.
| Education | Concord | CA | USA |
|---|---|---|---|
| < 9th Grade | 8.0% | 8.0% | 5.0% |
| 9-12th Grade | 5.0% | 7.0% | 6.0% |
| High School / GED | 19.0% | 20.0% | 26.0% |
| Some College | 21.0% | 20.0% | 19.0% |
| Associate's Degree | 9.0% | 8.0% | 9.0% |
| Bachelor's Degree | 26.0% | 22.0% | 21.0% |
| Master's Degree | 9.0% | 10.0% | 10.0% |
| Professional Degree | 2.0% | 3.0% | 2.0% |
| Doctorate Degree | 1.0% | 2.0% | 2.0% |
Household Income For Concord, California
3.6% of households in Concord earn Less than $10,000.
2.9% of households in Concord earn $10,000 to $14,999.
3.5% of households in Concord earn $15,000 to $24,999.
4.1% of households in Concord earn $25,000 to $34,999.
8.4% of households in Concord earn $35,000 to $49,999.
12.8% of households in Concord earn $50,000 to $74,999.
11.4% of households in Concord earn $75,000 to $99,999.
19.3% of households in Concord earn $100,000 to $149,999.
14.3% of households in Concord earn $150,000 to $199,999.
19.7% of households in Concord earn $200,000 or more.
| Income | Concord | CA | USA |
|---|---|---|---|
| Less than $10,000 | 3.6% | 4.4% | 4.9% |
| $10,000 to $14,999 | 2.9% | 3.0% | 3.6% |
| $15,000 to $24,999 | 3.5% | 5.2% | 6.6% |
| $25,000 to $34,999 | 4.1% | 5.5% | 6.8% |
| $35,000 to $49,999 | 8.4% | 8.4% | 10.4% |
| $50,000 to $74,999 | 12.8% | 13.3% | 15.7% |
| $75,000 to $99,999 | 11.4% | 11.8% | 12.7% |
| $100,000 to $149,999 | 19.3% | 17.9% | 17.4% |
| $150,000 to $199,999 | 14.3% | 11.1% | 9.3% |
| $200,000 or more | 19.7% | 19.4% | 12.6% |


