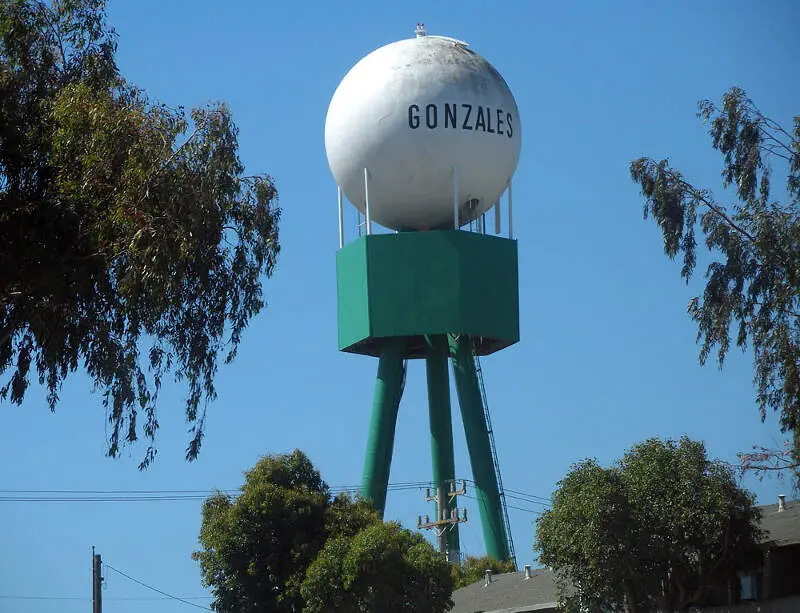

Life in Monterey County research summary. HomeSnacks has been researching the quality of life in Monterey County over the past eight years using Census data, FBI crime data, cost of living data, and other primary sources. Based on the most recently available data, we found the following about life in Monterey County:
The population in Monterey County is 437,609.
The median home value in Monterey County is $808,983.
The median income in Monterey County is $91,043.
The median rent in Monterey County is $1,873.
The unemployment rate in Monterey County is 5.3%.
The poverty rate in Monterey County is 12.3%.
The average high in Monterey County is 64.4° and there are 49.2 inches of rainfall annually.
The average high in Monterey County is 64.4°.
There are 98.5 nice days each year.
Expect an average of 49.2 inches of rain each year with 0.0 inches of snow.
There is an average of 7:31 hours of sun each day in Monterey County.
| Stat | Monterey County |
|---|---|
| Mean High | 64.4 |
| Nice Days | 98.5 |
| Rainfall | 49.2 |
| Snowfall | 0.0 |
| Sunny_hours | 7:31 |


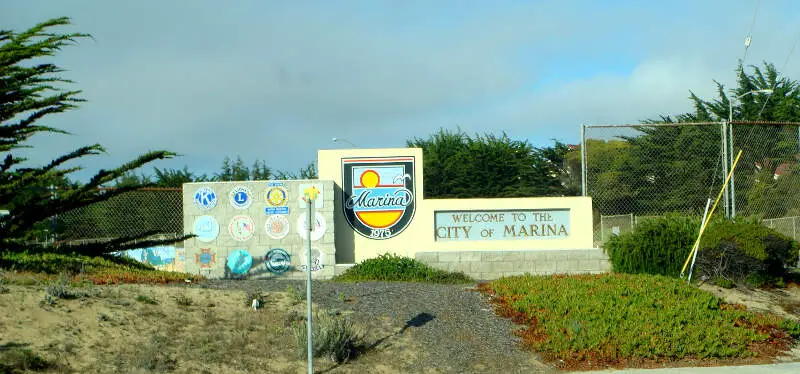
The current population in Monterey County is 437,609. The population has increased 1.3% from 2019.
| Year | Population | % Change |
|---|---|---|
| 2022 | 438,953 | 1.4% |
| 2021 | 432,977 | -0.1% |
| 2020 | 433,410 | - |
Monterey County is 49.0% female with 214,423 female residents.
Monterey County is 51.0% male with 223,186 male residents.
| Gender | Monterey County | CA | USA |
|---|---|---|---|
| Female | 49.0% | 49.9% | 50.4% |
| Male | 51.0% | 50.1% | 49.6% |
Monterey County is:
28.6% White with 125,138 White residents.
2.1% African American with 8,977 African American residents.
0.1% American Indian with 647 American Indian residents.
5.6% Asian with 24,715 Asian residents.
0.4% Hawaiian with 1,885 Hawaiian residents.
0.3% Other with 1,250 Other residents.
3.0% Two Or More with 13,043 Two Or More residents.
59.9% Hispanic with 261,954 Hispanic residents.
| Race | Monterey County | CA | USA |
|---|---|---|---|
| White | 28.6% | 35.2% | 58.9% |
| African American | 2.1% | 5.3% | 12.1% |
| American Indian | 0.1% | 0.3% | 0.6% |
| Asian | 5.6% | 14.9% | 5.7% |
| Hawaiian | 0.4% | 0.3% | 0.2% |
| Other | 0.3% | 0.4% | 0.4% |
| Two Or More | 3.0% | 3.8% | 3.5% |
| Hispanic | 59.9% | 39.7% | 18.7% |
2.8% of households in Monterey County earn Less than $10,000.
2.5% of households in Monterey County earn $10,000 to $14,999.
5.1% of households in Monterey County earn $15,000 to $24,999.
6.4% of households in Monterey County earn $25,000 to $34,999.
9.6% of households in Monterey County earn $35,000 to $49,999.
14.7% of households in Monterey County earn $50,000 to $74,999.
14.1% of households in Monterey County earn $75,000 to $99,999.
19.6% of households in Monterey County earn $100,000 to $149,999.
10.5% of households in Monterey County earn $150,000 to $199,999.
14.8% of households in Monterey County earn $200,000 or more.
| Income | Monterey County | CA | USA |
|---|---|---|---|
| Less than $10,000 | 2.8% | 4.4% | 4.9% |
| $10,000 to $14,999 | 2.5% | 3.2% | 3.8% |
| $15,000 to $24,999 | 5.1% | 5.6% | 7.0% |
| $25,000 to $34,999 | 6.4% | 6.0% | 7.4% |
| $35,000 to $49,999 | 9.6% | 8.7% | 10.7% |
| $50,000 to $74,999 | 14.7% | 13.7% | 16.1% |
| $75,000 to $99,999 | 14.1% | 12.0% | 12.8% |
| $100,000 to $149,999 | 19.6% | 17.8% | 17.1% |
| $150,000 to $199,999 | 10.5% | 10.7% | 8.8% |
| $200,000 or more | 14.8% | 17.9% | 11.4% |
19.0% of adults in Monterey County completed < 9th grade.
9.0% of adults in Monterey County completed 9-12th grade.
20.0% of adults in Monterey County completed high school / ged.
18.0% of adults in Monterey County completed some college.
8.0% of adults in Monterey County completed associate's degree.
16.0% of adults in Monterey County completed bachelor's degree.
7.0% of adults in Monterey County completed master's degree.
2.0% of adults in Monterey County completed professional degree.
1.0% of adults in Monterey County completed doctorate degree.
| Education | Monterey County | CA | USA |
|---|---|---|---|
| < 9th Grade | 19% | 8% | 3% |
| 9-12th Grade | 9% | 7% | 6% |
| High School / GED | 20% | 20% | 26% |
| Some College | 18% | 20% | 20% |
| Associate's Degree | 8% | 8% | 9% |
| Bachelor's Degree | 16% | 22% | 21% |
| Master's Degree | 7% | 9% | 10% |
| Professional Degree | 2% | 3% | 2% |
| Doctorate Degree | 1% | 2% | 2% |
HomeSnacks is based in Durham, NC.
We aim to deliver bite-sized pieces of infotainment about where you live.
We use data, analytics, and a sense of humor to determine quality of life for places across the nation.