
Some of you might be asking yourself, at this very moment, is California a good place?
The answer is unequivocally yes… if you know where to locate the best counties to live in California.
Lucky for you, we’re here to help you identify the best counties to live in the Golden State based on the most recently available data from the Census. And this isn’t our first rodeo — we’ve been using Saturday Night Science to rank places for years.
The question becomes if you wanted to relocate to the best part of California, where would you go? To answer that, we looked at crime, cost of living, and demographic data for all 58 counties in the state.
Table Of Contents: Top Ten | Methodology | Table | FAQs | Summary
The 10 Best Counties To Live In California For 2026
San Mateo County is the county to be when it comes to living the good life in California. And you should avoid Merced County if you can — at least according to the data.
Now you know exactly where to move in California. Keep on reading for more about the top ten and a detailed methodology.
Or, check out the best places to live in California and the cheapest places to live in California.
Table Of Contents: Top Ten | Methodology | Summary | Table
The Best Counties To Live In California For 2026
1. San Mateo County
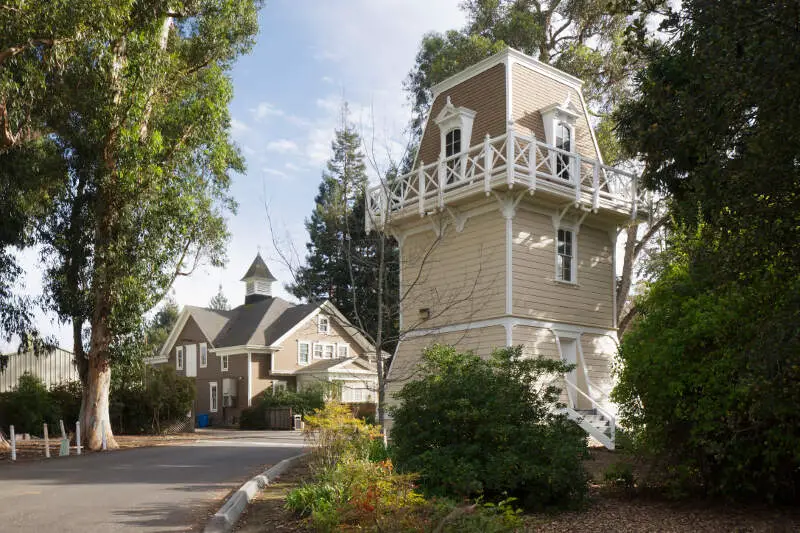
Biggest Place: San Mateo
Population: 742,340
Median Income: $158,855 (2nd best)
Median Home Price: $1,606,596 (2nd best)
Unemployment Rate: 4.8% (6th best)
More on San Mateo County: Data
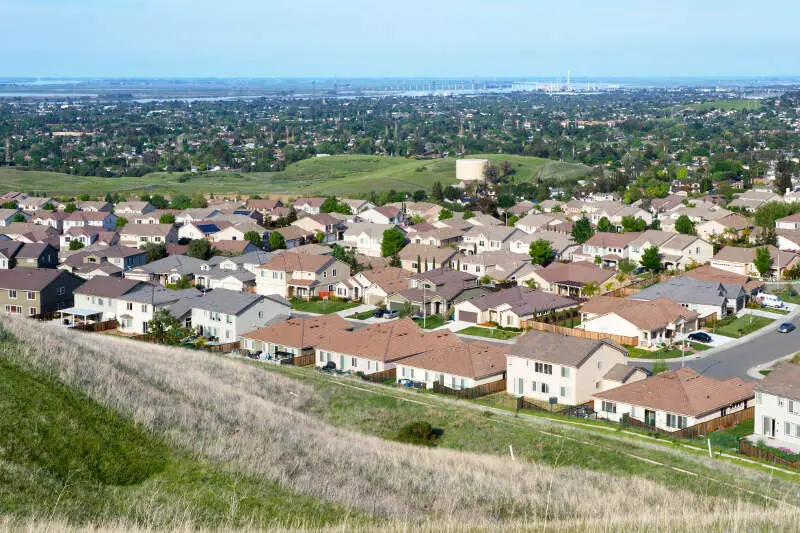
2. Placer County

Biggest Place: Roseville
Population: 419,156
Median Income: $115,998 (8th best)
Median Home Price: $685,953 (19th best)
Unemployment Rate: 4.8% (7th best)
More on Placer County: Data
3. Marin County

Biggest Place: San Rafael
Population: 257,969
Median Income: $149,091 (3rd best)
Median Home Price: $1,469,865 (3rd best)
Unemployment Rate: 6.1% (22nd best)
More on Marin County: Data
4. Santa Clara County

Biggest Place: San Jose
Population: 1,902,047
Median Income: $164,281 (best)
Median Home Price: $1,679,213 (best)
Unemployment Rate: 4.9% (8th best)
More on Santa Clara County: Data
5. El Dorado County

Biggest Place: El Dorado Hills
Population: 192,662
Median Income: $108,845 (13th best)
Median Home Price: $653,105 (20th best)
Unemployment Rate: 4.5% (4th best)
More on El Dorado County: Data
6. Alpine County

Biggest Place: Mesa Vista
Population: 1,616
Median Income: $105,521 (15th best)
Median Home Price: $514,117 (29th best)
Unemployment Rate: 4.4% (3rd best)
More on Alpine County: Data
7. Alameda County
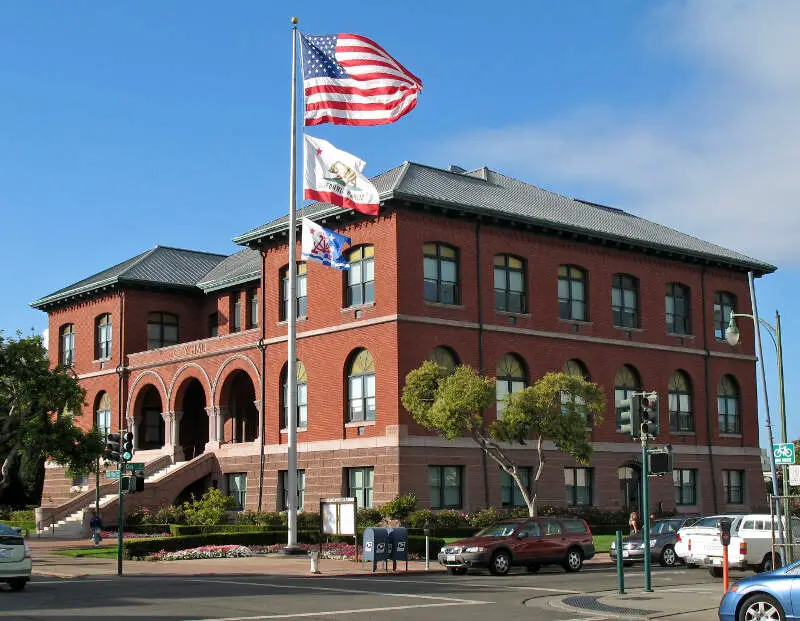
Biggest Place: Oakland
Population: 1,649,473
Median Income: $129,367 (5th best)
Median Home Price: $1,086,737 (7th best)
Unemployment Rate: 5.4% (11th best)
More on Alameda County: Data
8. San Francisco County

Biggest Place: San Francisco
Population: 830,235
Median Income: $140,970 (4th best)
Median Home Price: $1,357,007 (4th best)
Unemployment Rate: 6.1% (2best)
More on San Francisco County: Data
9. Contra Costa County
Biggest Place: Concord
Population: 1,165,012
Median Income: $127,229 (6th best)
Median Home Price: $789,907 (16th best)
Unemployment Rate: 6.5% (30th best)
More on Contra Costa County: Data
10. Napa County

Biggest Place: Napa
Population: 134,869
Median Income: $111,471 (10th best)
Median Home Price: $887,245 (12th best)
Unemployment Rate: 5.2% (10th best)
More on Napa County: Data
Methodology: How do you determine which California county is the best?
To give you the best county in California, we have to look at a handful of metrics that signal the quality of a place. To do that, we made assumptions about what’s in a “best county” and what isn’t. For reference, we are trying to make the kind of argument you’d make at a bar using facts, Saturday Night Science.
With that in mind, we went to two of the best data sources on the internet. Namely, the American Community Survey data and FBI Crime data for the most recent period.
We paid particular attention to:
- Violent Crime Rates
- Property Crime Rates
- Median Home Values
- Median Income
- Unemployment Rates
- Adult Education Levels
- Health Insurance Coverage
- Poverty Rates
We then ranked each county in California across each of the criteria from one to 58, with one being the best.
Taking the average rank across all criteria, we created a quality of life score with the county posting the lowest overall score being the “Best County To Live In California.”
The result is some of the safest, quietest, and best counties to raise a family in the Golden State.
We updated this article for 2026. This report is our eleventh time ranking the best counties to live in California.
Read on to see why San Mateo County is the best county, while Merced County is probably in contention for being the worst county in California.
Summary: The Best Counties In California To Call Home For 2026
Living in California can vary from one part of the state to the next — who woulda thought?
The best counties in California are San Mateo County, Placer County, Marin County, Santa Clara County, El Dorado County, Alpine County, Alameda County, San Francisco County, Contra Costa County, and Napa County.
But now you know the outstanding parts and the parts to avoid, and that’s why you came here to learn at the end of the day.
You are welcome.
Here’s a look at the worst counties in California according to the data:
- Merced County
- Imperial County
- Tulare County
For more California reading, check out:
- Richest Cities In California
- Safest Places In California
- Cheapest Places To Live In California
- Best Counties To Live In California
Detailed List Of The Best Counties In California
| Rank | County | Population | Median Income | Median Home Price |
|---|---|---|---|---|
| 1 | San Mateo County | 742,340 | $158,855 | $1,606,596 |
| 2 | Placer County | 419,156 | $115,998 | $685,953 |
| 3 | Marin County | 257,969 | $149,091 | $1,469,865 |
| 4 | Santa Clara County | 1,902,047 | $164,281 | $1,679,213 |
| 5 | El Dorado County | 192,662 | $108,845 | $653,105 |
| 6 | Alpine County | 1,616 | $105,521 | $514,117 |
| 7 | Alameda County | 1,649,473 | $129,367 | $1,086,737 |
| 8 | San Francisco County | 830,235 | $140,970 | $1,357,007 |
| 9 | Contra Costa County | 1,165,012 | $127,229 | $789,907 |
| 10 | Napa County | 134,869 | $111,471 | $887,245 |
| 11 | Orange County | 3,165,820 | $116,289 | $1,194,407 |
| 12 | San Benito County | 67,290 | $114,394 | $771,496 |
| 13 | Sonoma County | 485,040 | $104,674 | $792,143 |
| 14 | San Luis Obispo County | 281,555 | $97,446 | $906,921 |
| 15 | Nevada County | 102,481 | $89,882 | $611,865 |
| 16 | Santa Cruz County | 264,926 | $111,093 | $1,149,399 |
| 17 | San Diego County | 3,288,774 | $106,268 | $941,930 |
| 18 | Solano County | 451,918 | $100,401 | $577,137 |
| 19 | Amador County | 41,428 | $88,044 | $418,138 |
| 20 | Mono County | 13,148 | $99,415 | $755,676 |
| 21 | Calaveras County | 46,248 | $78,647 | $433,276 |
| 22 | Ventura County | 837,469 | $109,797 | $885,254 |
| 23 | Inyo County | 18,739 | $73,991 | $529,157 |
| 24 | Sacramento County | 1,594,006 | $92,175 | $530,242 |
| 25 | Yolo County | 220,564 | $91,752 | $622,227 |
| 26 | Tuolumne County | 54,498 | $77,404 | $388,487 |
| 27 | Mariposa County | 17,082 | $68,412 | $401,079 |
| 28 | Riverside County | 2,478,600 | $93,074 | $608,606 |
| 29 | Monterey County | 437,613 | $97,230 | $849,200 |
| 30 | Shasta County | 181,436 | $72,636 | $370,887 |
| 31 | San Joaquin County | 797,334 | $92,179 | $532,711 |
| 32 | Santa Barbara County | 443,701 | $98,161 | $994,383 |
| 33 | Plumas County | 19,423 | $66,031 | $362,742 |
| 34 | Los Angeles County | 9,808,667 | $90,112 | $888,344 |
| 35 | Stanislaus County | 553,990 | $81,468 | $467,165 |
| 36 | Del Norte County | 27,107 | $67,058 | $366,285 |
| 37 | San Bernardino County | 2,197,104 | $85,478 | $551,490 |
| 38 | Humboldt County | 134,541 | $61,160 | $425,013 |
| 39 | Sutter County | 98,857 | $79,704 | $438,590 |
| 40 | Yuba County | 84,507 | $76,373 | $418,796 |
| 41 | Sierra County | 2,746 | $63,355 | $328,754 |
| 42 | Butte County | 207,929 | $67,928 | $402,207 |
| 43 | Tehama County | 65,167 | $63,784 | $318,463 |
| 44 | Siskiyou County | 43,466 | $59,095 | $278,754 |
| 45 | Mendocino County | 90,244 | $68,092 | $489,567 |
| 46 | Fresno County | 1,016,725 | $74,201 | $409,962 |
| 47 | Colusa County | 21,984 | $75,672 | $370,444 |
| 48 | Lassen County | 30,356 | $67,403 | $231,144 |
| 49 | Madera County | 160,940 | $76,627 | $425,121 |
| 50 | Lake County | 68,152 | $60,621 | $305,225 |
| 51 | Trinity County | 15,860 | $53,002 | $246,519 |
| 52 | Kings County | 153,298 | $70,995 | $364,475 |
| 53 | Glenn County | 28,494 | $67,139 | $362,262 |
| 54 | Kern County | 915,075 | $70,210 | $363,090 |
| 55 | Modoc County | 8,600 | $59,455 | $191,780 |
| 56 | Tulare County | 478,693 | $71,300 | $360,206 |
| 57 | Imperial County | 180,202 | $57,681 | $378,175 |
| 58 | Merced County | 290,201 | $65,510 | $418,061 |