Beverly Hills, Santa Barbara, and Glendale all moved up the list of the top ten most expensive places to live in California for 2026.
But none of these places hold the number one spot.
To determine the top ten most expensive places in California, we used Saturday Nightt Science to compare the cost of living and American Community Survey data for The Golden State: specifically, home to income ratio and rent to income ratio. We considered the 428 California with at least 5,000 residents. If you want to live in California’s most expensive places, you will have to make at least $132,977/year.
Many of the most expensive places on this list are some of Califonia’s best places, and that’s because these places have the funds to keep its residents happy, safe, and living their best life.
$250,001 median income · $2,459,056 median home · #22 home prices in California
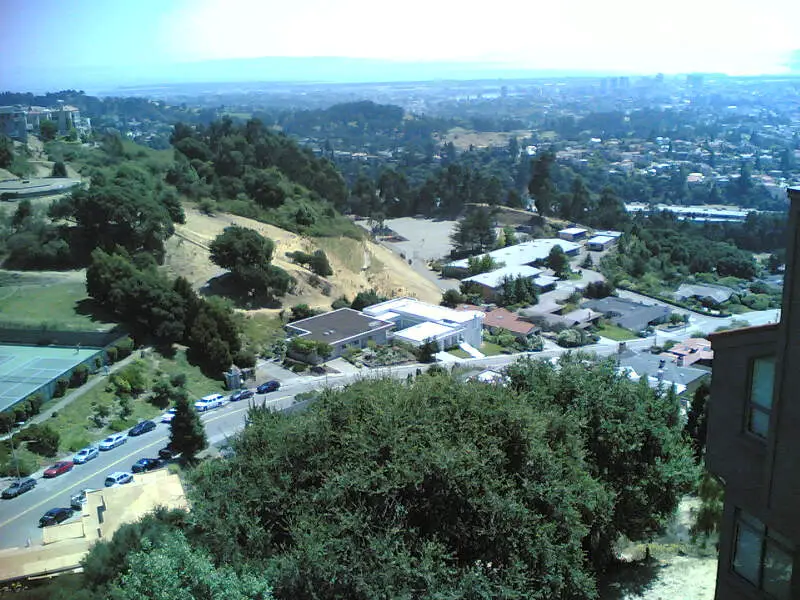
Piedmont is a small, mostly-residential, semi-suburban city located in Alameda County, California, United States. Piedmont is completely surrounded by the city of Oakland. Its residential population was 10,667 at the 2010 census. The name comes after the region of Piedmont in Italy, and literally means foothill. Piedmont was incorporated in 1907, and was developed significantly in the 1920s and 1930s. The Piedmont Unified School District includes three elementary schools, one middle school, and two high schools.
Data | Crime | Cost of living | Movers
$250,001 median income · $5,279,135 median home · #3 home prices in California
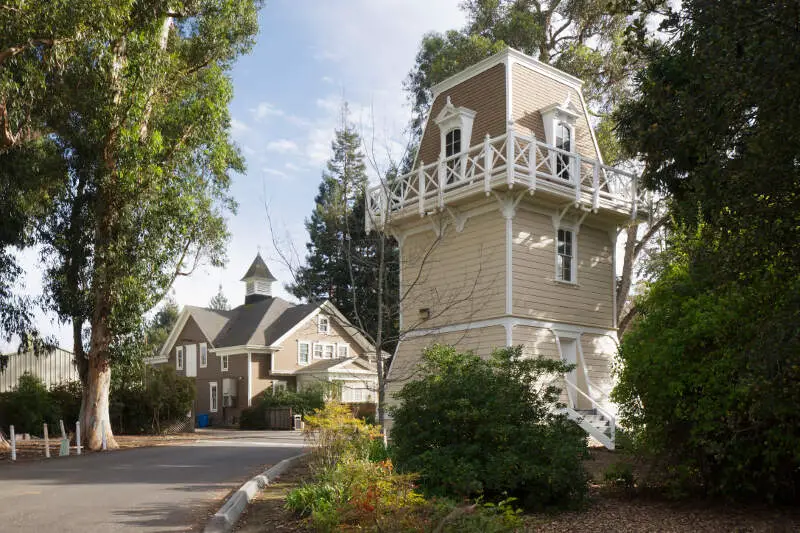
Hillsborough is an incorporated town in San Mateo County, California, in the San Francisco Bay Area. It is located 17 miles south of San Francisco on the San Francisco Peninsula, bordered by Burlingame to the north, San Mateo to the east, Highlands-Baywood Park to the south, and Interstate 280 to the west. The population was 11,273 as of 2013.
Data | Crime | Cost of living | Movers
$250,001 median income · $7,890,841 median home · #1 home prices in California
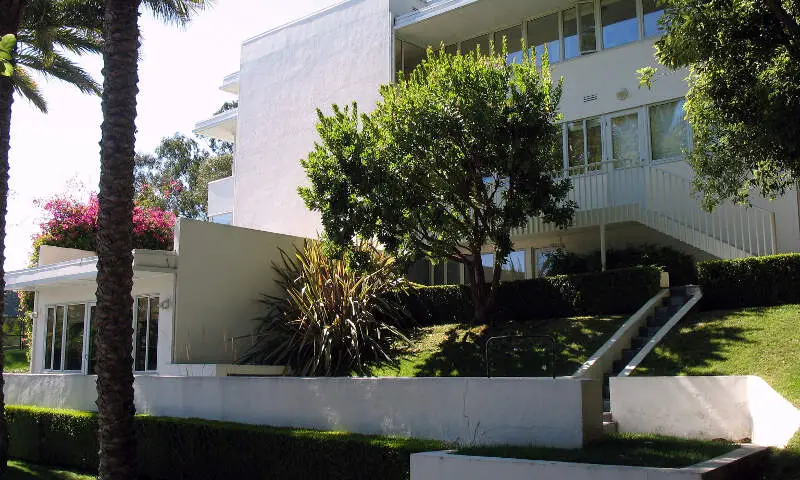
Atherton is an incorporated town in San Mateo County, California, United States. Its population was 7,159 as of 2013. Atherton is ranked to be the wealthiest city in the United States, and is regularly ranked among the most expensive zip codes in the country.
Data | Crime | Cost of living | Movers
$250,001 median income · $3,891,384 median home · #6 home prices in California
Data | Crime | Cost of living | Movers
$232,969 median income · $3,020,895 median home · #13 home prices in California
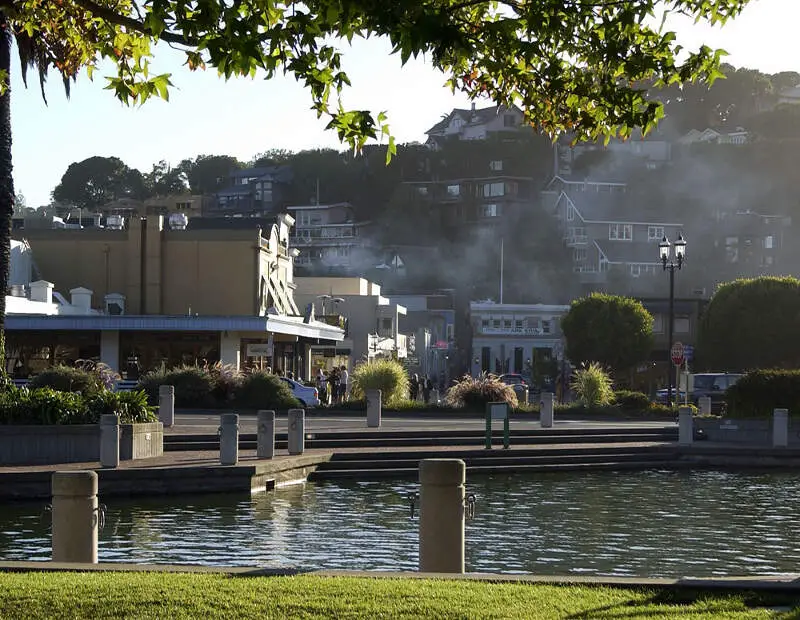
Tiburon is an incorporated town in Marin County, California. It is located on the Tiburon Peninsula, which reaches south into the San Francisco Bay. The smaller city of Belvedere occupies the south-west part of the peninsula and is contiguous with Tiburon. Tiburon is bordered by Corte Madera to the north and Mill Valley to the west, but is otherwise mostly surrounded by the Bay. Besides Belvedere and Tiburon, much of the peninsula is unincorporated, including portions of the north side and the communities of Strawberry and Paradise Cay.
Data | Crime | Cost of living | Movers
$231,101 median income · $3,722,200 median home · #7 home prices in California
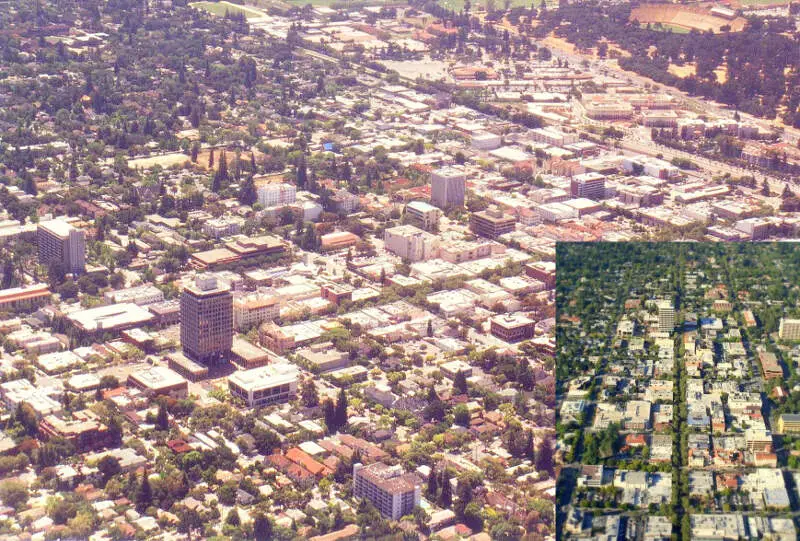
Palo Alto is a charter city located in the northwest corner of Santa Clara County, California, in the San Francisco Bay Area of the United States.
Data | Crime | Cost of living | Movers
$250,001 median income · $4,713,315 median home · #4 home prices in California
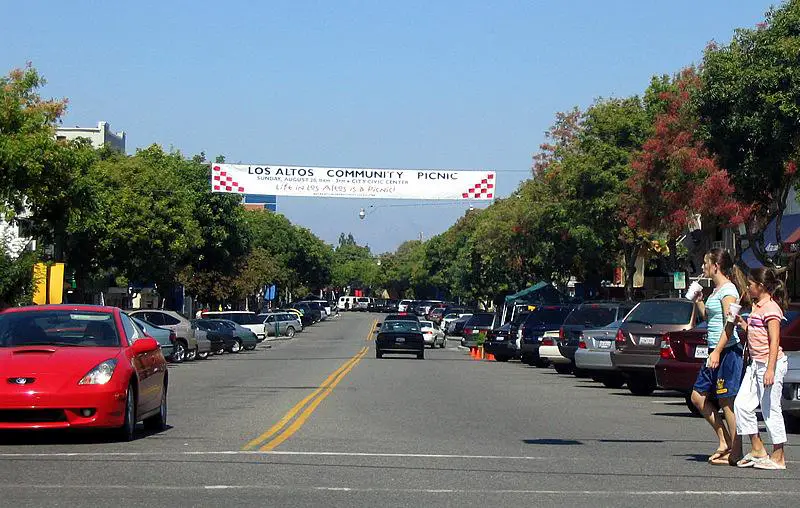
Los Altos is a city in Santa Clara County, California, in northern Silicon Valley, in the San Francisco Bay Area. The population was 28,976 according to the 2010 census.
Data | Crime | Cost of living | Movers
$204,306 median income · $3,227,202 median home · #10 home prices in California
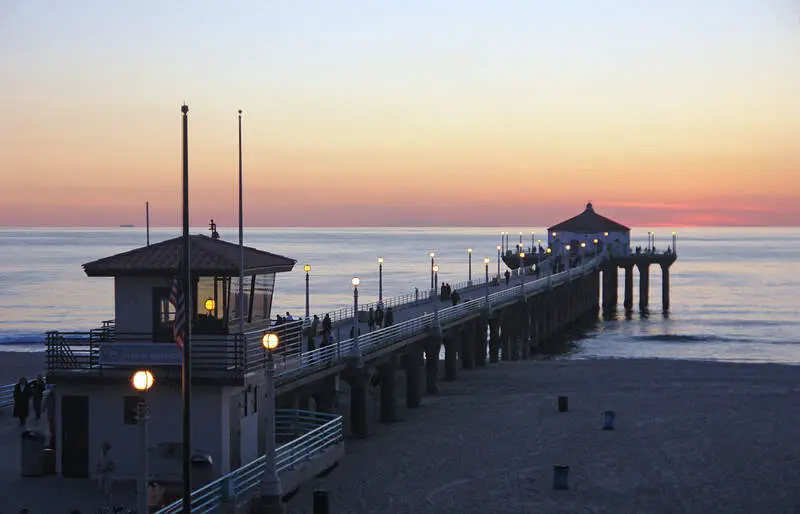
Manhattan Beach is a city in southwestern Los Angeles County, California, United States, on the Pacific coast south of El Segundo, and north of Hermosa Beach. Manhattan Beach is one of the three Beach Cities that make up the South Bay. Mira Costa High School in Manhattan Beach is ranked in the top 1% of high schools nationally. In 2016, Forbes ranked Manhattan Beach at #74 on its list of America’s most expensive zip codes with a median home price of $2,815,327. According to a May 18, 2017 Property Shark study the City of Manhattan Beach 90266 zip code ranked as the 32nd most expensive zip code in the United States.
Data | Crime | Cost of living | Movers
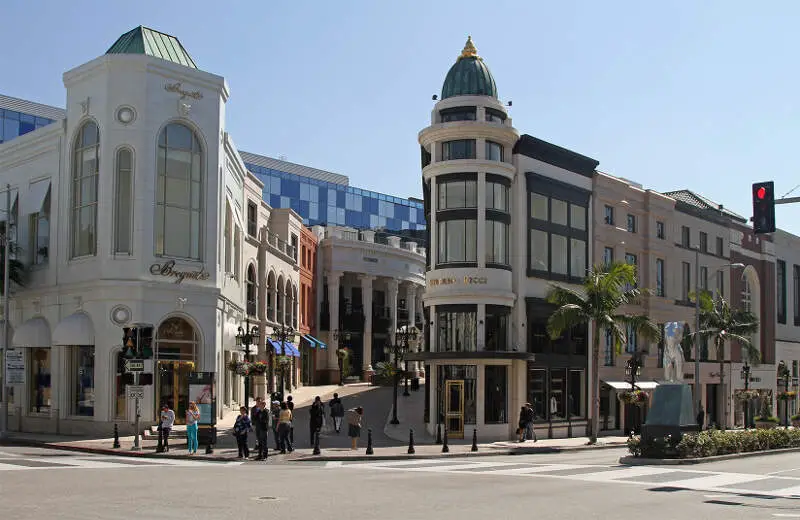
$132,977 median income · $3,662,756 median home · #8 home prices in California
Beverly Hills is a city in Los Angeles County, California, United States, surrounded by the cities of Los Angeles and West Hollywood. Originally a Spanish ranch where lima beans were grown, Beverly Hills was incorporated in 1914 by a group of investors who had failed to find oil, but found water instead and eventually decided to develop it into a town. By 2013, its population had grown to 34,658. Sometimes referred to as “90210”, one of its primary ZIP codes, it was home to many actors and celebrities throughout the 20th century. The city includes the Rodeo Drive shopping district and the Beverly Hills Oil Field.
Data | Crime | Cost of living | Movers
$250,001 median income · $4,189,623 median home · #5 home prices in California
Saratoga is a city in Santa Clara County, California, United States. It is located on the west side of the Santa Clara Valley, directly west of San Jose, in the San Francisco Bay Area. The population was 29,926 at the 2010 census. Located on the Western edge of the Silicon Valley, Saratoga is known locally for its suburban small-town feel, wineries, and high-end restaurants. Major attractions of Saratoga include Villa Montalvo, Hakone Gardens, and the Mountain Winery.
Data | Crime | Cost of living | Movers
The receipts
Compare the top ten
Pick a metric. The bars rescale. The red line is California’s statewide median.
California statewide median: $774,582
California statewide median: $99,122
On the map
Mapping the most expensive places in California
Saturday Night Science
Methodology: How We Determined The Most Expensive Places To Live In The Golden State For 2026
The two most important things to think about when it comes to being able to afford a city in California are how much money you make and how much you have to spend to live there.
You need to understand your costs in the context of how much money you make.
For example, if the median household earns $100,000 and spends $40,000 on housing, it’s actually cheaper to live there than a place with a median income of $50,000 and housing costs of $21,000. You might spend more on housing, but you have more money overall to play with.
With that example in mind, we derived several statistics from the latest Census American Community Survey 2020-2024 around incomes and costs. They are:
- Overall Cost Of Living Index
- Median Home Price / Median Income (lower is better)
- Median Income / Median Rent (Higher is better)
- Median Home Price
You can then compare these metrics in each of the places in California to figure out which is the most expensive.
You are left with a “Cost of Living Index” by taking the average rank of each of these metrics for each city.
So we used that cost of living index to rank all of the 428 places in California that have more than 5,000 people.
The place with the highest cost of living in California according to the data is Piedmont. We updated this article for 2026. This article is our eleventh time ranking the most expensive places to live in California.
The full plate
Most Expensive Cities In California
Click any column to sort. Search by city name.
| Rank | City | Cost Of Living | Population | Median Income | Average Home Price | Home/Income Ratio |
|---|---|---|---|---|---|---|
| 1 | Piedmont | 349 | 10,945 | $250,001 | $2,459,056 | 9.8x |
| 2 | Hillsborough | 348 | 11,099 | $250,001 | $5,279,135 | 21.1x |
| 3 | Atherton | 347 | 6,993 | $250,001 | $7,890,841 | 31.6x |
| 4 | Woodside | 345 | 5,126 | $250,001 | $3,891,384 | 15.6x |
| 5 | Tiburon | 342 | 9,012 | $232,969 | $3,020,895 | 13.0x |
| 6 | Palo Alto | 341 | 67,237 | $231,101 | $3,722,200 | 16.1x |
| 7 | Los Altos | 341 | 30,698 | $250,001 | $4,713,315 | 18.9x |
| 8 | Manhattan Beach | 340 | 34,210 | $204,306 | $3,227,202 | 15.8x |
| 9 | Beverly Hills | 338 | 31,624 | $132,977 | $3,662,756 | 27.5x |
| 10 | Saratoga | 338 | 30,319 | $250,001 | $4,189,623 | 16.8x |
| 11 | Newport Beach | 337 | 83,845 | $156,867 | $3,625,146 | 23.1x |
| 12 | Menlo Park | 337 | 32,727 | $210,025 | $2,865,159 | 13.6x |
| 13 | Burlingame | 337 | 30,525 | $174,000 | $2,761,630 | 15.9x |
| 14 | Malibu | 337 | 10,421 | $194,421 | $3,142,247 | 16.2x |
| 15 | Los Altos Hills | 337 | 8,377 | $250,001 | $6,102,345 | 24.4x |
| 16 | San Marino | 335 | 12,216 | $214,167 | $2,837,216 | 13.2x |
| 17 | Palos Verdes Estates | 331 | 12,925 | $242,014 | $2,763,820 | 11.4x |
| 18 | Cupertino | 329 | 58,566 | $234,707 | $3,189,452 | 13.6x |
| 19 | Laguna Beach | 324 | 22,710 | $143,843 | $2,949,835 | 20.5x |
| 20 | San Carlos | 311 | 29,614 | $237,470 | $2,459,877 | 10.4x |
| 21 | Los Gatos | 306 | 32,786 | $217,554 | $2,705,289 | 12.4x |
| 22 | Coronado | 300 | 19,015 | $134,534 | $2,508,031 | 18.6x |
| 23 | Mill Valley | 293 | 14,012 | $206,212 | $2,073,166 | 10.1x |
| 24 | Hermosa Beach | 290 | 19,063 | $166,442 | $2,245,351 | 13.5x |
| 25 | Villa Park | 290 | 5,748 | $202,245 | $2,343,977 | 11.6x |
| 26 | Sausalito | 289 | 7,141 | $182,357 | $1,505,307 | 8.3x |
| 27 | Millbrae | 288 | 22,689 | $163,476 | $2,082,465 | 12.7x |
| 28 | Mountain View | 287 | 83,732 | $189,917 | $2,037,086 | 10.7x |
| 29 | Belmont | 286 | 27,337 | $205,297 | $2,332,686 | 11.4x |
| 30 | Lafayette | 281 | 25,285 | $228,250 | $1,934,581 | 8.5x |
| 31 | Foster City | 275 | 32,792 | $199,143 | $1,911,067 | 9.6x |
| 32 | Santa Monica | 274 | 91,169 | $114,885 | $1,703,948 | 14.8x |
| 33 | Orinda | 274 | 19,514 | $250,001 | $1,985,117 | 7.9x |
| 34 | Rolling Hills Estates | 274 | 8,131 | $191,895 | $1,901,413 | 9.9x |
| 35 | Sunnyvale | 271 | 154,236 | $186,170 | $2,168,909 | 11.7x |
| 36 | Redwood City | 267 | 82,447 | $157,814 | $1,897,529 | 12.0x |
| 37 | Solana Beach | 257 | 12,823 | $152,167 | $2,183,118 | 14.3x |
| 38 | Larkspur | 256 | 12,854 | $140,417 | $2,129,545 | 15.2x |
| 39 | Corte Madera | 253 | 10,077 | $232,763 | $1,838,958 | 7.9x |
| 40 | St. Helena | 251 | 5,318 | $148,750 | $1,633,318 | 11.0x |
| 41 | San Mateo | 250 | 103,105 | $153,504 | $1,686,905 | 11.0x |
| 42 | San Francisco | 247 | 830,235 | $140,970 | $1,356,662 | 9.6x |
| 43 | Rancho Palos Verdes | 243 | 40,864 | $179,623 | $1,824,948 | 10.2x |
| 44 | Santa Clara | 242 | 130,256 | $178,958 | $1,782,192 | 10.0x |
| 45 | Moraga | 242 | 16,769 | $216,193 | $1,666,830 | 7.7x |
| 46 | Calabasas | 240 | 22,669 | $165,288 | $1,722,904 | 10.4x |
| 47 | El Segundo | 235 | 16,769 | $150,737 | $1,759,408 | 11.7x |
| 48 | San Anselmo | 235 | 12,679 | $173,641 | $1,647,302 | 9.5x |
| 49 | Campbell | 234 | 42,781 | $145,268 | $1,977,422 | 13.6x |
| 50 | Danville | 233 | 43,401 | $232,216 | $1,908,521 | 8.2x |
| 51 | Pleasanton | 232 | 76,960 | $190,124 | $1,601,646 | 8.4x |
| 52 | South Pasadena | 229 | 26,068 | $127,175 | $1,692,678 | 13.3x |
| 53 | Fremont | 227 | 228,295 | $181,506 | $1,543,132 | 8.5x |
| 54 | Half Moon Bay | 227 | 11,391 | $157,884 | $1,573,307 | 10.0x |
| 55 | Westlake Village | 225 | 7,743 | $179,954 | $1,585,475 | 8.8x |
| 56 | Santa Barbara | 223 | 87,779 | $106,182 | $1,834,095 | 17.3x |
| 57 | Arcadia | 223 | 55,170 | $113,516 | $1,414,451 | 12.5x |
| 58 | Berkeley | 222 | 120,257 | $108,092 | $1,443,684 | 13.4x |
| 59 | San Ramon | 221 | 85,993 | $196,161 | $1,543,534 | 7.9x |
| 60 | La Habra Heights | 219 | 5,478 | $179,583 | $1,399,870 | 7.8x |
| 61 | Milpitas | 218 | 78,578 | $178,798 | $1,502,891 | 8.4x |
| 62 | Sierra Madre | 217 | 10,940 | $143,547 | $1,437,492 | 10.0x |
| 63 | San Jose | 216 | 990,138 | $146,427 | $1,463,614 | 10.0x |
| 64 | Dublin | 215 | 70,803 | $214,385 | $1,305,295 | 6.1x |
| 65 | San Bruno | 214 | 42,307 | $141,272 | $1,327,402 | 9.4x |
| 66 | Redondo Beach | 213 | 69,291 | $150,245 | $1,500,192 | 10.0x |
| 67 | Encinitas | 213 | 61,480 | $162,229 | $1,889,066 | 11.6x |
| 68 | Pacifica | 212 | 37,261 | $160,523 | $1,284,847 | 8.0x |
| 69 | San Rafael | 211 | 60,433 | $119,435 | $1,319,431 | 11.0x |
| 70 | East Palo Alto | 211 | 29,069 | $113,493 | $1,034,441 | 9.1x |
| 71 | Irvine | 209 | 311,690 | $136,719 | $1,557,982 | 11.4x |
| 72 | Dana Point | 208 | 32,790 | $141,520 | $1,736,393 | 12.3x |
| 73 | Alameda | 207 | 77,238 | $137,697 | $1,155,484 | 8.4x |
| 74 | Culver City | 207 | 39,931 | $117,389 | $1,301,741 | 11.1x |
| 75 | San Clemente | 206 | 63,273 | $140,062 | $1,721,005 | 12.3x |
| 76 | Santa Cruz | 206 | 61,607 | $115,475 | $1,344,332 | 11.6x |
| 77 | South San Francisco | 205 | 64,305 | $136,578 | $1,242,214 | 9.1x |
| 78 | Albany | 205 | 19,414 | $144,107 | $1,261,177 | 8.8x |
| 79 | Laguna Niguel | 204 | 64,139 | $140,452 | $1,499,546 | 10.7x |
| 80 | Daly City | 203 | 101,964 | $123,547 | $1,143,595 | 9.3x |
| 81 | Union City | 203 | 67,464 | $133,715 | $1,276,127 | 9.5x |
| 82 | Yorba Linda | 203 | 67,170 | $157,582 | $1,419,513 | 9.0x |
| 83 | El Cerrito | 203 | 25,994 | $127,876 | $1,142,479 | 8.9x |
| 84 | Agoura Hills | 203 | 19,721 | $171,302 | $1,259,726 | 7.4x |
| 85 | Carlsbad | 202 | 114,373 | $142,748 | $1,370,649 | 9.6x |
| 86 | Morgan Hill | 202 | 45,425 | $163,920 | $1,356,869 | 8.3x |
| 87 | Clayton | 202 | 10,937 | $175,707 | $1,057,924 | 6.0x |
| 88 | Fairfax | 200 | 7,516 | $141,653 | $1,213,199 | 8.6x |
| 89 | Livermore | 199 | 85,522 | $160,775 | $1,122,823 | 7.0x |
| 90 | Walnut | 199 | 27,611 | $129,449 | $1,197,951 | 9.3x |
| 91 | Pasadena | 198 | 136,969 | $105,192 | $1,209,228 | 11.5x |
| 92 | Costa Mesa | 198 | 110,330 | $111,505 | $1,413,322 | 12.7x |
| 93 | Walnut Creek | 198 | 70,088 | $130,432 | $1,045,017 | 8.0x |
| 94 | Pacific Grove | 197 | 14,951 | $106,065 | $1,405,345 | 13.2x |
| 95 | Torrance | 196 | 142,130 | $116,217 | $1,124,932 | 9.7x |
| 96 | Scotts Valley | 196 | 12,044 | $143,750 | $1,260,978 | 8.8x |
| 97 | Glendale | 195 | 190,748 | $88,393 | $1,201,880 | 13.6x |
| 98 | Novato | 195 | 52,546 | $115,736 | $1,078,524 | 9.3x |
| 99 | Huntington Beach | 194 | 195,240 | $120,919 | $1,366,658 | 11.3x |
| 100 | Newark | 194 | 46,903 | $169,064 | $1,260,998 | 7.5x |
Source: U.S. Census ACS 2020-2024, Zillow research. 428 places with more than 5,000 residents.
Summary
Summary: Taking A Chunk Out Of Your Paycheck In California For 2026
Well, there you have it, the places in California that have the highest cost of living, with Piedmont ranking as the most expensive city in the Golden State.
The most expensive cities in California are Piedmont, Hillsborough, Atherton, Woodside, Tiburon, Palo Alto, Los Altos, Manhattan Beach, Beverly Hills, and Saratoga.


