Moreno Valley, CA
Demographics And Statistics
Living In Moreno Valley, California Summary
Life in Moreno Valley research summary. HomeSnacks has been using Saturday Night Science to research the quality of life in Moreno Valley over the past nine years using Census, FBI, Zillow, and other primary data sources. Based on the most recently available data, we found the following about life in Moreno Valley:
The population in Moreno Valley is 210,378.
The median home value in Moreno Valley is $544,266.
The median income in Moreno Valley is $87,477.
The cost of living in Moreno Valley is 132 which is 1.3x higher than the national average.
The median rent in Moreno Valley is $2,036.
The unemployment rate in Moreno Valley is 7.4%.
The poverty rate in Moreno Valley is 11.8%.
The average high in Moreno Valley is 81.2° and the average low is 52.0°.
Moreno Valley SnackAbility
Overall SnackAbility
Moreno Valley, CA Crime Report
Crime in Moreno Valley summary. We use data from the FBI to determine the crime rates in Moreno Valley. Key points include:
There were 4,140 total crimes in Moreno Valley in the last reporting year.
The overall crime rate per 100,000 people in Moreno Valley is 1,938.4 / 100k people.
The violent crime rate per 100,000 people in Moreno Valley is 272.5 / 100k people.
The property crime rate per 100,000 people in Moreno Valley is 1,665.9 / 100k people.
Overall, crime in Moreno Valley is -8.53% below the national average.
Total Crimes
Below National Average
Crime In Moreno Valley Comparison Table
| Statistic | Count Raw |
Moreno Valley / 100k People |
California / 100k People |
National / 100k People |
|---|---|---|---|---|
| Total Crimes Per 100K | 4,140 | 1,938.4 | 2,564.5 | 2,119.2 |
| Violent Crime | 582 | 272.5 | 486.0 | 359.0 |
| Murder | 7 | 3.3 | 4.5 | 5.0 |
| Robbery | 182 | 85.2 | 119.1 | 61.0 |
| Aggravated Assault | 374 | 175.1 | 325.8 | 256.0 |
| Property Crime | 3,558 | 1,665.9 | 2,078.4 | 1,760.0 |
| Burglary | 500 | 234.1 | 305.8 | 229.0 |
| Larceny | 2,503 | 1,171.9 | 1,345.2 | 1,272.0 |
| Car Theft | 555 | 259.9 | 427.5 | 259.0 |
Moreno Valley, CA Cost Of Living
Cost of living in Moreno Valley summary. We use data on the cost of living to determine how expensive it is to live in Moreno Valley. Real estate prices drive most of the variance in cost of living around California. Key points include:
The cost of living in Moreno Valley is 132 with 100 being average.
The cost of living in Moreno Valley is 1.3x higher than the national average.
The median home value in Moreno Valley is $544,266.
The median income in Moreno Valley is $87,477.
Moreno Valley's Overall Cost Of Living
Higher Than The National Average
Cost Of Living In Moreno Valley Comparison Table
| Living Expense | Moreno Valley | California | National Average | |
|---|---|---|---|---|
| Overall | 132 | 141 | 100 | |
| Services | 114 | 110 | 100 | |
| Groceries | 115 | 112 | 100 | |
| Health | 100 | 110 | 100 | |
| Housing | 179 | 195 | 100 | |
| Transportation | 126 | 125 | 100 | |
| Utilities | 95 | 128 | 100 | |
Moreno Valley, CA Weather
The average high in Moreno Valley is 81.2° and the average low is 52.0°.
There are 18.0 days of precipitation each year.
Expect an average of 10.0 inches of precipitation each year with 1.7 inches of snow.
| Stat | Moreno Valley |
|---|---|
| Average Annual High | 81.2 |
| Average Annual Low | 52.0 |
| Annual Precipitation Days | 18.0 |
| Average Annual Precipitation | 10.0 |
| Average Annual Snowfall | 1.7 |
Average High
Days of Rain
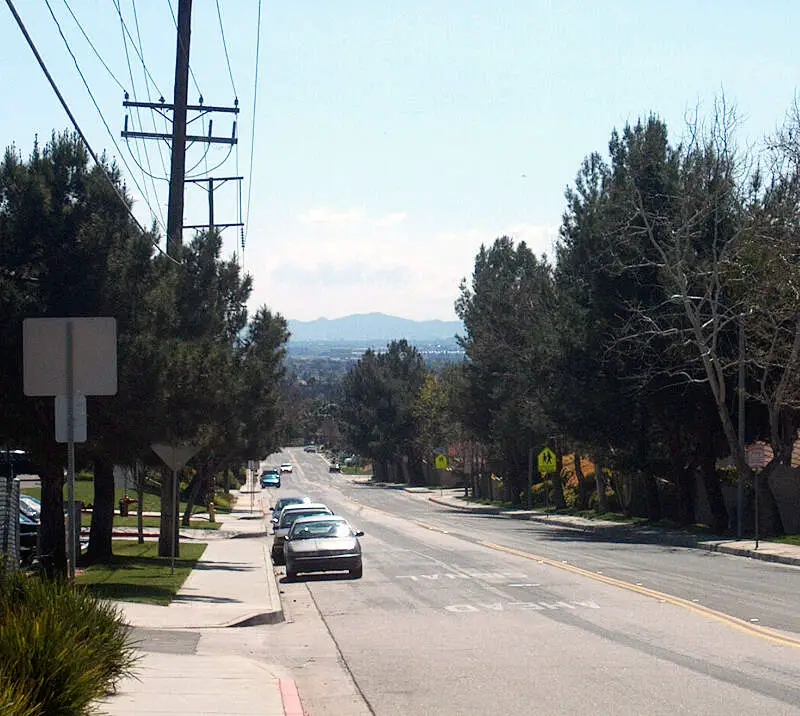
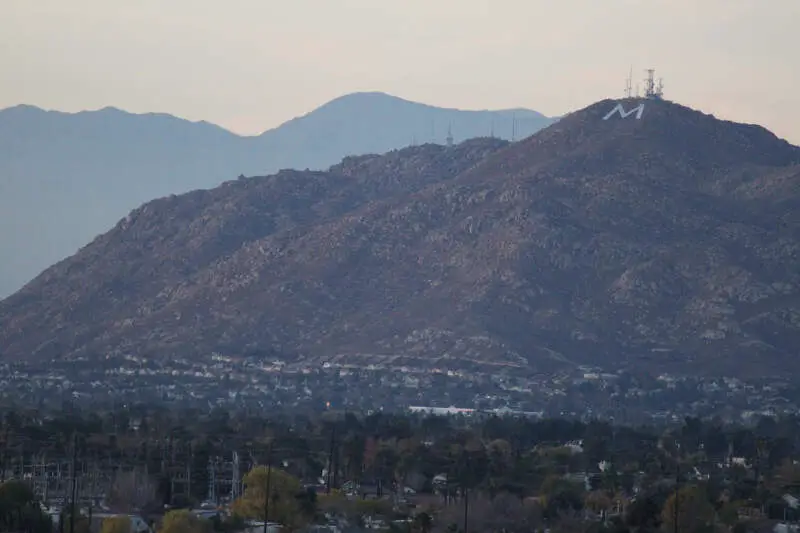
Moreno Valley, CA Photos

2 Reviews & Comments About Moreno Valley
/5

smb85 dkc94 - None
Also, do Moreno Valley and Perris also count as bad cities-
Since they're located in the desert in Riverside County, very hot for most of the year, have very little things to do here and maybe not alot of good jobs-
I've lived in Moreno Valley and Perris for most of my life and been wondering if these are bad cities as well. I've wished to have lived elsewhere that's full of green plant life and fresh water everywhere, cleaner cities with very little to no crime rate, better schools, jobs, cooler climate and temperatures, rains often and snows in winter.
HomeSnacks User - 2018-09-19 04:17:37.550929
Schools aren't the best in Moreno Valley. There's nothing to do here and there's a lot of gangs. I do not recommend Moreno Valley. It is not a safe place.
I don't have a favorite place on Moreno Valley since there isn't much to do.
Rankings for Moreno Valley in California


Locations Around Moreno Valley
Map Of Moreno Valley, CA
Best Places Around Moreno Valley
Grand Terrace, CA
Population 13,069
El Cerrito, CA
Population 25,781
Home Gardens, CA
Population 11,430
Woodcrest, CA
Population 17,111
Loma Linda, CA
Population 25,021
Redlands, CA
Population 72,985
Norco, CA
Population 25,211
Fontana, CA
Population 211,921
Bloomington, CA
Population 24,324
Temescal Valley, CA
Population 28,560
Moreno Valley Demographics And Statistics
Population over time in Moreno Valley
The current population in Moreno Valley is 210,378. The population has increased 12.2% from 2010.
| Year | Population | % Change |
|---|---|---|
| 2023 | 210,378 | 0.4% |
| 2022 | 209,578 | 0.6% |
| 2021 | 208,371 | -0.2% |
| 2020 | 208,751 | 0.7% |
| 2019 | 207,289 | 1.1% |
| 2018 | 205,034 | 0.7% |
| 2017 | 203,691 | 0.8% |
| 2016 | 202,061 | 0.6% |
| 2015 | 200,788 | 1.0% |
| 2014 | 198,872 | 1.3% |
| 2013 | 196,234 | 1.3% |
| 2012 | 193,758 | 1.5% |
| 2011 | 190,977 | 1.9% |
| 2010 | 187,428 | - |
Race / Ethnicity in Moreno Valley
Moreno Valley is:
14.0% White with 29,410 White residents.
17.1% African American with 35,962 African American residents.
0.1% American Indian with 277 American Indian residents.
5.4% Asian with 11,308 Asian residents.
0.6% Hawaiian with 1,285 Hawaiian residents.
0.6% Other with 1,172 Other residents.
2.6% Two Or More with 5,392 Two Or More residents.
59.7% Hispanic with 125,572 Hispanic residents.
| Race | Moreno Valley | CA | USA |
|---|---|---|---|
| White | 14.0% | 34.6% | 58.2% |
| African American | 17.1% | 5.3% | 12.0% |
| American Indian | 0.1% | 0.3% | 0.5% |
| Asian | 5.4% | 15.1% | 5.7% |
| Hawaiian | 0.6% | 0.3% | 0.2% |
| Other | 0.6% | 0.5% | 0.5% |
| Two Or More | 2.6% | 4.1% | 3.9% |
| Hispanic | 59.7% | 39.8% | 19.0% |
Gender in Moreno Valley
Moreno Valley is 50.0% female with 105,284 female residents.
Moreno Valley is 50.0% male with 105,093 male residents.
| Gender | Moreno Valley | CA | USA |
|---|---|---|---|
| Female | 50.0% | 50.0% | 50.5% |
| Male | 50.0% | 50.0% | 49.5% |
Highest level of educational attainment in Moreno Valley for adults over 25
9.0% of adults in Moreno Valley completed < 9th grade.
10.0% of adults in Moreno Valley completed 9-12th grade.
31.0% of adults in Moreno Valley completed high school / ged.
24.0% of adults in Moreno Valley completed some college.
9.0% of adults in Moreno Valley completed associate's degree.
12.0% of adults in Moreno Valley completed bachelor's degree.
4.0% of adults in Moreno Valley completed master's degree.
0.0% of adults in Moreno Valley completed professional degree.
1.0% of adults in Moreno Valley completed doctorate degree.
| Education | Moreno Valley | CA | USA |
|---|---|---|---|
| < 9th Grade | 9.0% | 8.0% | 5.0% |
| 9-12th Grade | 10.0% | 7.0% | 6.0% |
| High School / GED | 31.0% | 20.0% | 26.0% |
| Some College | 24.0% | 20.0% | 19.0% |
| Associate's Degree | 9.0% | 8.0% | 9.0% |
| Bachelor's Degree | 12.0% | 22.0% | 21.0% |
| Master's Degree | 4.0% | 10.0% | 10.0% |
| Professional Degree | 0.0% | 3.0% | 2.0% |
| Doctorate Degree | 1.0% | 2.0% | 2.0% |
Household Income For Moreno Valley, California
4.0% of households in Moreno Valley earn Less than $10,000.
1.9% of households in Moreno Valley earn $10,000 to $14,999.
3.8% of households in Moreno Valley earn $15,000 to $24,999.
5.1% of households in Moreno Valley earn $25,000 to $34,999.
10.1% of households in Moreno Valley earn $35,000 to $49,999.
16.7% of households in Moreno Valley earn $50,000 to $74,999.
15.6% of households in Moreno Valley earn $75,000 to $99,999.
22.7% of households in Moreno Valley earn $100,000 to $149,999.
10.9% of households in Moreno Valley earn $150,000 to $199,999.
9.3% of households in Moreno Valley earn $200,000 or more.
| Income | Moreno Valley | CA | USA |
|---|---|---|---|
| Less than $10,000 | 4.0% | 4.4% | 4.9% |
| $10,000 to $14,999 | 1.9% | 3.0% | 3.6% |
| $15,000 to $24,999 | 3.8% | 5.2% | 6.6% |
| $25,000 to $34,999 | 5.1% | 5.5% | 6.8% |
| $35,000 to $49,999 | 10.1% | 8.4% | 10.4% |
| $50,000 to $74,999 | 16.7% | 13.3% | 15.7% |
| $75,000 to $99,999 | 15.6% | 11.8% | 12.7% |
| $100,000 to $149,999 | 22.7% | 17.9% | 17.4% |
| $150,000 to $199,999 | 10.9% | 11.1% | 9.3% |
| $200,000 or more | 9.3% | 19.4% | 12.6% |


