Sacramentovs.San Jose Which City Is Right for You in 2026?
A head-to-head guide to cost of living, jobs, transportation, weather, crime, and quality of life — so you can decide where to live, work, or visit.
Updated 2026-05-26 · By HomeSnacks Editorial
Sacramento vs. San Jose at a glance
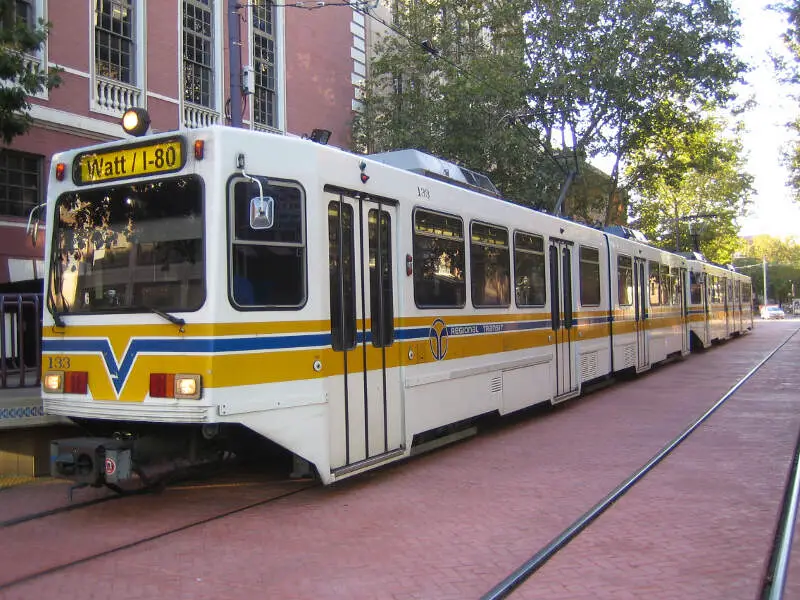
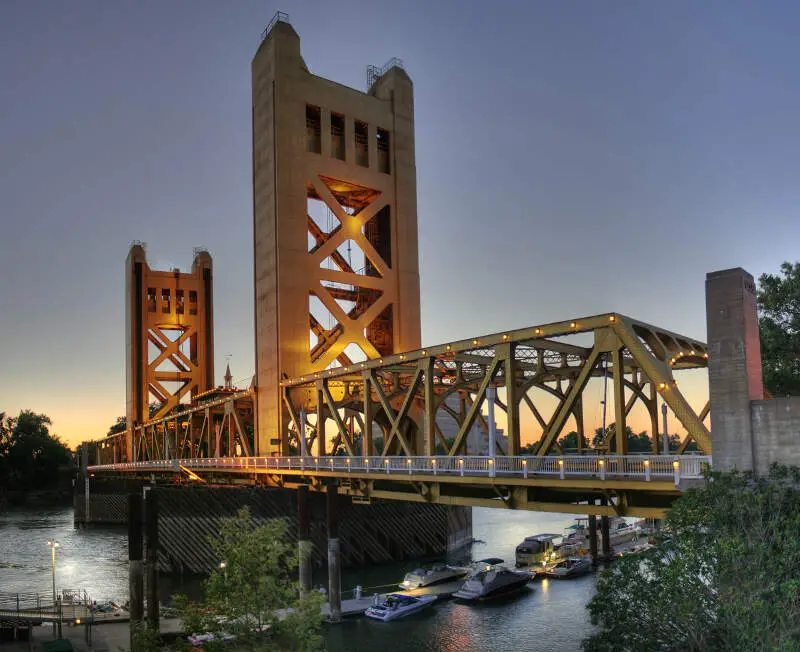
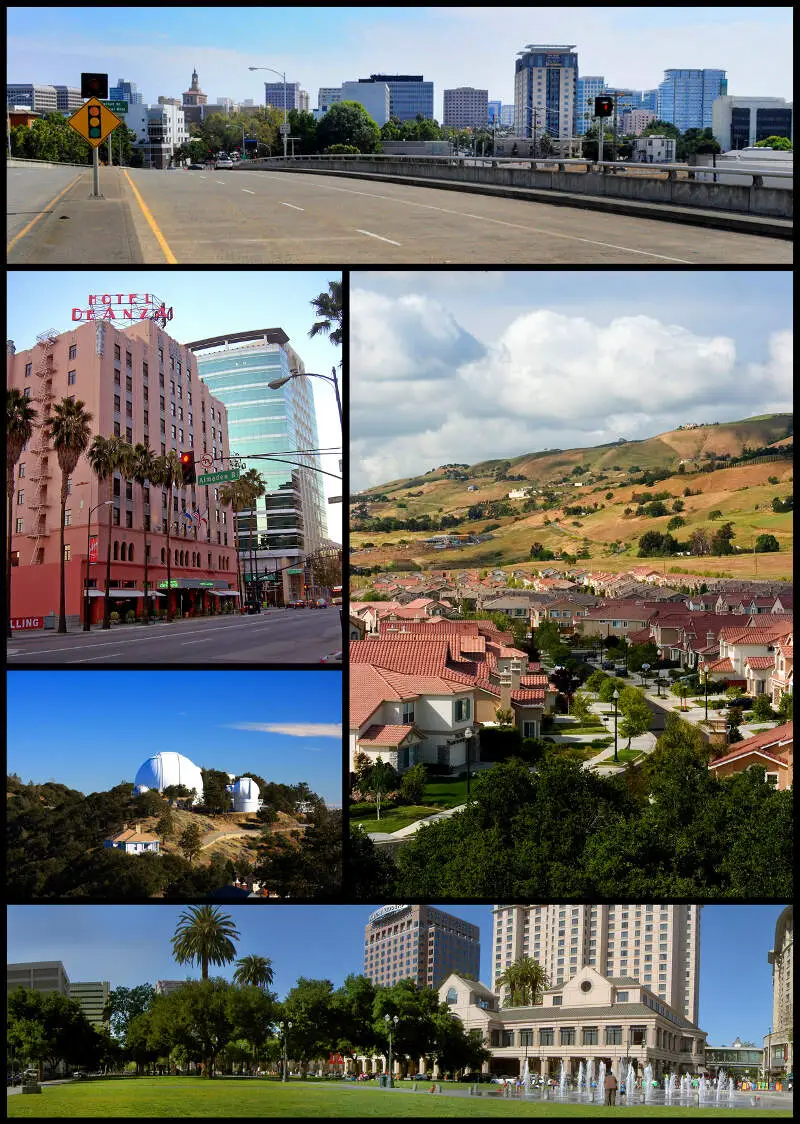
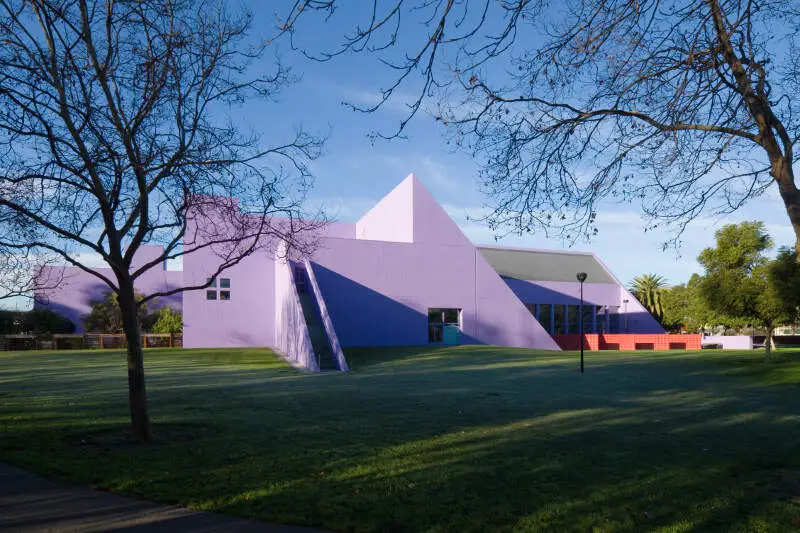
Sacramento, CA and San Jose, CA are frequently compared, and for good reason — they offer very different lifestyles at very different price points. Sacramento is the capital city of the U.S. state of California. The county seat of Sacramento County, it is located at the confluence of the Sacramento and American Rivers in the Sacramento Valley. San Jose, officially the City of San José, is the most populous city in the San Francisco Bay Area and Northern California, and the 13th-most populous in the United States, with 997,368 residents.
On cost of living, Sacramento is the cheaper city: its overall index sits at 137 versus 216 in San Jose (100 = national average). Median home values run $479,765 in Sacramento and $1,463,614 in San Jose, with median rents at $1,779 and $2,669 respectively. That puts the home-value-to-income ratio at 5.5x in Sacramento versus 10.0x in San Jose.
Crime data tells a different story. San Jose reports 3,195 total crimes per 100,000 residents annually versus 3,302 in Sacramento. Sacramento is the more racially diverse of the two on a Herfindahl index basis — Sacramento skews 29% Hispanic while San Jose skews 39% Asian. On HomeSnacks' overall SnackAbility score, San Jose edges ahead at 8.5/10 versus 7/10 for Sacramento.
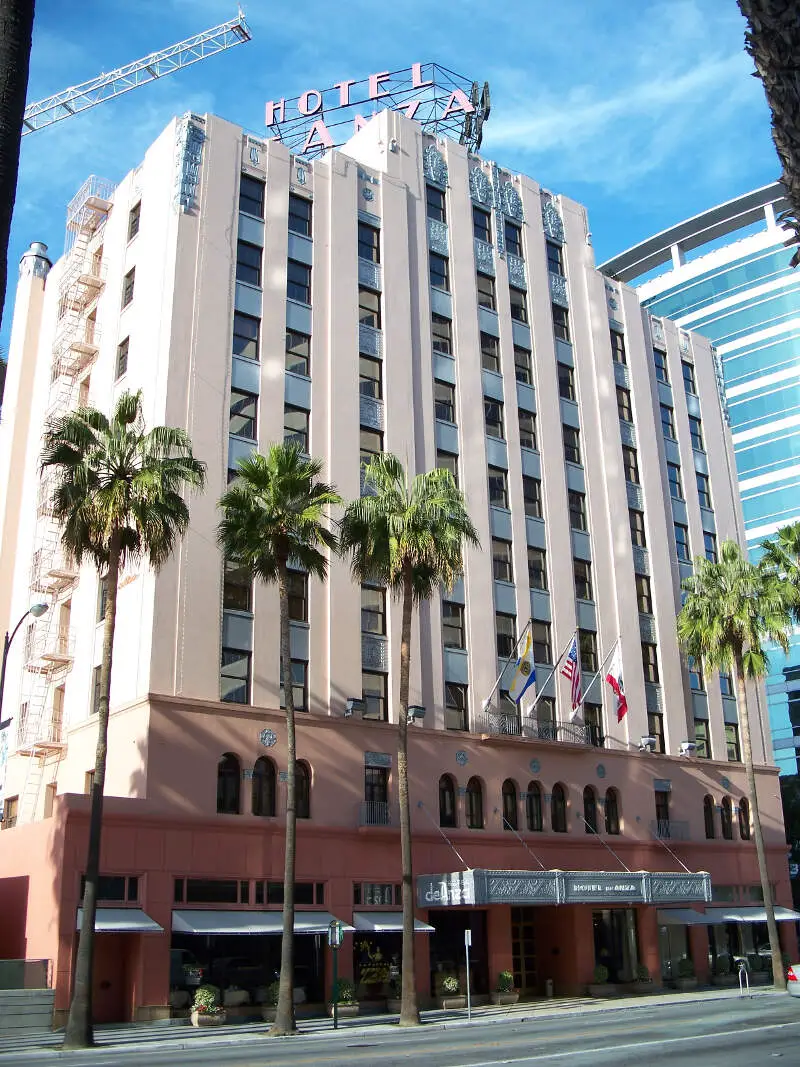
Sacramento vs. San Jose in photos
A side-by-side look at each city.

Cost of living
Sacramento is the cheaper city overall — 37% higher in San Jose than its rival. Index baseline: 100 = national average.
| Living expense | Sacramento | San Jose | US average |
|---|---|---|---|
| Overall | 137 | 216 | 100 |
| Services | 109 | 119 | 100 |
| Groceries | 122 | 125 | 100 |
| Health | 184 | 425 | 100 |
| Housing | 124 | 135 | 100 |
| Transportation | 121 | 132 | 100 |
| Utilities | 122 | 136 | 100 |
Lower index = cheaper. 100 = U.S. national average. Bar inside each cell scales relative to the highest value in the table.
Sources: HomeSnacks Cost of Living indices, normalized so 100 = U.S. national average. Drill in: Sacramento cost of living, San Jose cost of living, or the cheapest cities in America.
Housing breakdown
Home prices are higher in Sacramento. Compare absolute price and price-to-income — a $500k home in a $100k-income city is very different from one in a $50k-income city.
| Metric | Sacramento | San Jose | United States |
|---|---|---|---|
| Median Home Value | $479,765 | $1,463,614 | $332,700 |
| Median Rent | $1,779 | $2,669 | $1,413 |
| Median Income | $87,321 | $146,427 | $80,734 |
| Home Value To Income | 5.5x | 10.0x | 4.1x |
| Rent To Monthly Income | 0.24x | 0.22x | 0.21x |
Source: U.S. Census Bureau ACS 2020-2024. See also states with the highest rent in America.
Crime
San Jose is the safer city — total crime rate of 3,195 per 100k people vs 3,302 for Sacramento. US average: 2,119.
| Crime (per 100k) | Sacramento | San Jose | US average |
|---|---|---|---|
| Total crime | 3,302 | 3,195 | 2,119 |
| Murder | 9 | 3 | 5 |
| Robbery | 192 | 141 | 61 |
| Aggravated Assault | 520 | 386 | 256 |
| Violent Crime | 755 | 607 | 359 |
| Burglary | 442 | 427 | 229 |
| Larceny | 1,596 | 1,523 | 1,272 |
| Car Theft | 510 | 638 | 259 |
| Property Crime | 2,547 | 2,588 | 1,760 |
Lower = safer. Bar inside each cell scales relative to the highest crime rate in the table.
Source: FBI Uniform Crime Reporting (2024). All rates are per 100,000 people. City pages: Sacramento crime, San Jose crime. See also: safest cities in America.
Diversity
Sacramento is more racially diverse — lower HHI (closer to 0) means a more even mix across groups.
| Group | Sacramento | San Jose | United States |
|---|---|---|---|
| White | 29.3% | 22.3% | 57.4% |
| African American | 11.8% | 2.7% | 11.9% |
| American Indian | 0.2% | 0.2% | 0.5% |
| Asian | 20.1% | 39.2% | 5.9% |
| Hawaiian | 1.5% | 0.5% | 0.2% |
| Other | 0.8% | 0.5% | 0.6% |
| Two Or More | 6.9% | 3.8% | 4.3% |
| Hispanic | 29.4% | 30.8% | 19.3% |
Source: U.S. Census ACS 2020-2024. Lower HHI = more even racial mix. See also: most diverse cities in America.
SnackAbility — overall quality of life
San Jose scores higher overall — 8.5/10 vs 7/10. SnackAbility is our 1–10 quality-of-life score; the median U.S. city scores a 7.
SnackAbility is a HomeSnacks proprietary 1–10 score blending jobs, housing, education, commute, amenities, affordability, crime, and diversity. Median U.S. city ≈ 7. Data: Census, BLS, FBI. See also: best places to live in America.
Getting around: Sacramento vs. San Jose
How each city handles commuting, transit, walkability, and car culture — the day-to-day reality that shapes where you'd actually want to live.
Getting around Sacramento is mostly a car affair, though SacRT light rail connects downtown to suburbs like Rancho Cordova and Folsom. If you commute by car, expect I-5 and US-50 bottlenecks, though congestion rarely matches Bay Area levels. Sacramento is also genuinely bikeable: the flat downtown grid and the American River Bike Trail make cycling practical for many residents.
San Jose demands more patience behind the wheel. Highways 101, 880, and 280 clog predictably during tech-industry commute hours, and a drive that looks like 20 minutes on a map can easily double. VTA light rail and Caltrain exist, and BART now reaches Berryessa, but most San Jose workers still drive.
Jobs and careers in Sacramento vs. San Jose
The local job market, dominant industries, and which city to choose based on your career.
Sacramento's economy leans heavily on state government: if working for a California agency, the legislature, or a major public-sector union appeals to you, few cities offer more of those openings. Healthcare is the other pillar, with Sutter Health, UC Davis Health, and Dignity Health all running large operations here. The median household income is $87,321, shaped by that public-sector composition.
The job market in San Jose tilts sharply toward technology, semiconductors, and venture-backed startups. Cisco, Adobe, and eBay are headquartered here, and Apple's campus in Cupertino is a short commute away. The median household income is $146,427, nearly $60,000 above Sacramento's, and if your career is in tech or engineering, that gap matters.
Weather and climate
What to expect day-to-day — sun, fog, heat, rain, and the seasonal extremes that shape the lifestyle.
Sacramento summers are long and genuinely hot, with temperatures routinely cresting 100°F from June through September. Low humidity helps: evenings cool off quickly, and spring and fall are legitimately beautiful. Winters are mild but bring tule fog, a dense ground fog that can snarl driving and darken January for weeks.
San Jose runs cooler, buffered from extreme heat by the coastal ranges in the South Bay. Summer highs typically land in the mid-80s rather than triple digits, and the city rarely sees frost. Morning fog rolls in from the Bay during June and July (locals call it "June Gloom"), but afternoons usually clear, and neither city will make you dig out a snow shovel.
Culture, nightlife, and entertainment
Food, music, neighborhoods, and the city vibe that gives each place its personality.
Sacramento has shed its "cow town" reputation. Midtown anchors a genuine arts and restaurant scene: First Fridays draw thousands to galleries and food trucks, and the "Farm-to-Fork Capital" identity produces restaurants that back up the claim. Golden 1 Center hosts major concerts and Kings basketball, weekend options extend to Napa and the Sierra Nevada wine country, and a cost of living index of 137 means you can actually afford to go out.
San Jose has more scale: Santana Row brings upscale dining and nightlife, the SoFA District has a grittier arts corridor, and SAP Center books major acts and Sharks hockey. Vietnamese enclaves in East San Jose and Japanese spots downtown reflect the broader demographics: the city ranks among the most diverse large cities in America. The cost of living index of 216 means nights out are expensive, but the variety is real.
Outdoor activities and day trips
Parks, beaches, hikes, and the weekend escapes that define life outside the city limits.
The American River Parkway runs 23 miles through Sacramento as a greenbelt of trails, swimming holes, and kayak launches. Folsom Lake is a quick drive east for sailing and mountain biking, and Lake Tahoe is about 90 minutes up Highway 50. The flat Delta waterways to the west offer boating and fishing that feel surprisingly remote for a state capital.
San Jose trades flat river trails for rugged terrain. Almaden Quicksilver County Park and Alum Rock Park offer serious hiking within city limits, and the Santa Cruz Mountains (including remnants of Big Basin Redwoods State Park) are reachable in 45 minutes. The San Francisco Bay Trail loops around the bay for cycling and birdwatching.
Bottom line: which city is right for you?
Based on the head-to-head data above, here's the short version — pick the city that lines up with what you actually care about.
Choose Sacramento if you prioritize…
- a lower cost of living (cheaper groceries, services, and day-to-day expenses).
- more affordable housing relative to San Jose.
- a more racially diverse community (lower HHI on Census data).
Choose San Jose if you prioritize…
- lower crime — a safer place to live, work, and raise a family.
- a higher overall SnackAbility quality-of-life score.
Methodology: winners are picked from public data — U.S. Census Bureau ACS (income, home value, rent, race/HHI), FBI Uniform Crime Reporting (crime rates per 100k), and HomeSnacks' proprietary SnackAbility quality-of-life score, which blends Bureau of Labor Statistics data with the above.
More about California

Best Places To Live In California
Photo: Public domain
Cheapest Places To Live In California
Photo: Public domain
Most Dangerous Cities In California
Photo: Public domain
Best Places To Raise A Family In California
Photo: Public domain
Best Places To Retire In California
Photo: Public domain
Richest Cities In California
Photo: Public domain
Safest Places In California
Photo: Public domain
Worst Places To Live In California
Photo: Public domain